

Abstract
The gastric enterochromaffin-like (ECL) cell plays a major role in the regulation of gastric acid secretion. We have previously described that Pituitary Adenylate Cyclase-Activating Polypeptide (PACAP) is present on myenteric neurons in the rat and colocalizes with its high-affinity receptor, PAC1, expressed on the surface of gastric ECL cells. The study of ECL cell physiology has been hampered by the inability to isolate and purify ECL cells to homogeneity. Density gradient elutriation alone yields only 65–70% purity of ECL cells. In the present study, we used fluorescence-activated cell sorting (FACS) with a novel fluorescent ligand, Fluor-PACAP-38, for isolating pure ECL cells. FACS was used to isolate ECL cells based on their relatively small size, low density, and ability to bind the fluorescent ligand Fluor-PACAP-38. The sorted cells were unambiguously identified as ECL cells by immunohistochemical analysis using anti-PACAP type-I (PAC1), anti-histidine decarboxylase (HDC), and anti-somatostatin antibodies. Further confocal microscopy demonstrated that Fluor-PACAP-38, a ligand with a higher affinity for PAC1, bound to extracellular receptors of these FACS-purified cells. FACS yielded an average of 2 million ECL cells/4 rat stomachs, and >99% of the sorted cells were positive for PAC1 receptor and HDC expression. The absence of immunohistochemical staining for somatostatin indicated lack of contamination by gastric D cells, which are similar in size and shape to the ECL cells. Internalization of PACAP receptors and a rapid Ca2+ response in purified ECL cells were observed upon PACAP activation, suggesting that these cells are viable and biologically active. These ECL cells demonstrated a dosedependent stimulation of proliferation in response to PACAP, with a maximum of 30% proliferation at a concentration of 10−7 M. Microarray studies were perfor med to confirm the expression of genes specific for ECL cells. These results demonstrate that rat gastric ECL cells can be isolated to homogeneity by using a combination of density gradient centrifugation, followed by cell sorting using Fluor-PACAP. These techniques now allow microarray studies to be performed in ECL cells to characterize their functional gene expression and will facilitate pharmacological, biochemical, and molecular studies on ECL cell function.
Keywords: ECL cells, Fluor-PACAP, FACS, PAC1
Introduction
Regulation of gastric acid secretion is a complex integrated process of central and peripheral processes in a variety of cell types, including gastric enterochromaffin-like (ECL) cells. Compared with other gastric endocrine cells, ECL cells are relatively small, with an approximate diameter of 10 μm (Zeng and Sachs, 1998). The ECL cell synthesizes and stores histamine in vacuoles. Both paracrine and neural input 3 regulate histamine release from ECL cells. ECL cell proliferation in both human and animal models has been associated with primary (Zollinger-Ellison syndrome) and secondary hypergastrinemia (Prinz et al., 1994). With regard to the development of such pathologies, a concerted effort to study isolated endocrine cells has been made, as such models allow for direct stimulation or inhibition of target cells and observation of secondary effects attributed to functional changes in specific endocrine cells (Zeng and Sachs, 1998; Håkanson et al., 2001). Vasoactive Intestinal Polypeptide (VIP), adrenaline, noradrenaline, gastrin, and pituitary adenylate cyclase-activating polypeptide (PACAP) have been demonstrated to activate ECL cells in primary culture, ultimately influencing the secretion of acid by parietal cells (Håkanson et al., 2001).
PACAP, a neuropeptide localized in gastric nerve endings, has been shown to function as a signaling molecule during neural regulation of gastric acid secretion. PACAP specifically binds to PACAP type-I (PAC1) receptors, expressed by ECL cells in culture, or in gastric glands, and stimulates both calcium signaling and histamine release (Zeng et al., 1999; Sandvik et al., 2001). VIP, a peptide sharing sequence homology with PACAP, exhibits an approx 1000-fold reduced affinity for PAC1 as compared with VIP receptors (VPACs). RT-PCR analysis has verified that rat gastric ECL cells express PAC1, but not VPAC1 or VPAC2 (Zeng et al., 1999), and this differential expression of PAC1 has been utilized in the purification of ECL cells from rat gastric mucosa. Lindström et al. (2001) suggested that extracellular Ca2+ entry into the ECL cell, rather than IP3-induced mobilization of intracellular Ca2+, was important for histamine release from ECL cells. Furthermore, combined SKF 96365 and nifedipine treatment completely blocks PACAP-induced histamine secretion, suggesting that PACAP induces Ca2+ release from both L-type and receptor-operated Ca2+ channels. PACAP, which stimulates intracellular secretion of cAMP in ECL cells, might regulate histamine secretion via the activation of PAC1 receptor-mediated Ca2+ channels by secondary-messenger cAMP (Lindström et al., 2001). Zeng and Sachs (1998) have demonstrated that inhibition of calcium signaling in ECL cells blocks ECL cell histamine release, thereby implicating calcium response in histamine release and subsequent stimulation of HCl secretion by the parietal cell. In the present study, we isolated purified preparations of ECL cells to determine the signaling mechanism by which ECL cells regulate parietal cell gastric acid secretion.
Purification of mucosal endocrine cells is difficult, as each type comprises 1% or less of the total cell population. Employing elutriation and density gradient centrifugation, Prinz et al. (1994) and Zeng et al. (1999) have isolated gastric endocrine cells, particularly ECL cells. ECL cells contain vacuoles, which reduce their density and allow enrichment from gastric epithelial cell suspensions via elutriation, followed by nycodenz gradient of centrifugation steps. Immunostaining with anti-histidine decarboxylase (HDC), anti-histamine antibodies, and acridine orange accumulation in histamine-containing acid vacuoles (Prinz et al., 1994) have been used as a marker of cell purity. Elutriation and gradient centrifugation yields about 65–70% ECL cells. Further purification is obtained by 48-h culture of these isolated cells reaching 85% (Prinz et al., 1994). Nevertheless, even this degree of purity is not suitable for pharmacological and molecular biology studies designed to elucidate the exact signal transduction pathway, as well as the gene expression induced by the neuropeptide PACAP-38, as other cells could be contaminating the cell samples. Fluorescence-activated cell sorting (FACS) offers an additional purification step for isolating purified ECL cells based on their specific ligand-binding properties. In a previous published study, we established that a fluorescent PACAP compound, Fluor-PACAP, has an identical pharmacological and biological profile when compared with the native peptide (Germano et al., 2001).
The current study describes a method utilizing pronase to digest rat oxyntic mucosa to isolate and partially purify ECL cells by density gradient methods. Because ECL cells specifically bind PACAP via endogenous PAC1 receptors, ECL cells were then purified upon FACS after adding fluorescently labeled PACAP-38.
Materials and Methods
Animals
Experimental studies were performed using Sprague-Dawley rats (Charles River Laboratory, Wilmington, MA), weighing 300–350 g and housed under controlled conditions (22–24°C; lights on from 6 am to 6 pm). Animals had free access to chow (Ralston Purina, St. Louis, MO) and tap water. All animals adhered to the National Institutes of Health Guide for the Care and Use of Laboratory Animals and were approved by the Department of Veterans Affairs-Greater Los Angeles Healthcare System Animal Research Committee.
Digestion of Rat Stomach Tissue
The stomachs of four rats weighing between 300 and 350 g were extracted, and the esophageal and intestinal ends tied off. Each stomach was then inverted via a tiny fore-stomach incision, which was then tied off. Five milliliters of solution A (0.5 mM NaH2PO4, 1 mM NaH2PO4, 20 mM NaHCO3, 70 mM NaCl, 20 mM KCl, 11 mM dextrose, 50 mM HEPES, 0.35 mM EDTA, and 1% BSA) containing 1.3% pronase (Roche Diagnostics, catalog no. 1459643) was injected into the inverted stomach. Pouched stomachs were then incubated in 50 mL of solution A for 30 min at 37°C, then 50 mL of solution B (0.5 mM NaH2PO4, 1 mM NaH2PO4, 20 mM NaHCO3, 70 mM NaCl, 20 mM KCl, 11 mM dextrose, 50 mM HEPES, 0.1 mM anhydrous CaCl2, and 0.15 mM MgCl2) for 10 min at 37°C, solution A for another 30 min, and finally solution B with agitation for 10 min. The solution from the second solution B incubation containing ECL cells was collected and centrifuged.
Isolation of Pure ECL Cells Using FACS
The pellet was washed and resuspended with solution C (140 mM NaCl, 1.2 mM MgSO4, 1 mM anhydrous CaCl2, 10 mM HEPES, 11 mM dextrose), and a nycodenz gradient (Conc. 6%, Accurate Chemicals and Scientific Corporation, NY) was applied to isolate an ECL layer to approx 60% purity of ECL cells. The isolated cells were washed and resuspended in PBS and incubated with 10−7 M Fluor-PACAP for 30 min and sorted with FACS using parameters based first, on size and density, and second, by fluorescence of bound fluorescent ligand to the PAC1 receptor. The purified collection of cells was cultured at least 2 h in complete DMEM/F12 medium (10% fetal bovine serum, 5.2 mg/mL gentamicin, 0.1 mg/mL kanamicin sulfate) for PAC1 receptor re-expression.
Purity Assessment With FACS
The purity of ECL cells was assessed with FACS by employing three different antibodies: polyclonal rabbit anti-HDC (CURE Antibody Core, 94211), monoclonal rat anti-somatostatin, and polyclonal rabbit anti-PAC1. The cells were fixed with 4% paraformaldehyde and permeabilized with 0.1% Triton X-100 in PBS for 1 h each. The cells were then divided, approx 100,000 cells/tube, and incubated with the primary antibodies overnight at 4°C; negative controls (incubated with only the secondary antibodies previously) were incubated with goat IgG (1 μL/mL). The next day, the cells were washed twice with 0.05% Tween-20 in PBS. Each tube was then incubated with the specific Alexa 488 conjugated secondary antibodies at 4°C for 2 h: goat anti-rabbit (Molecular Probes, 1:5000), goat anti-rabbit (Molecular Probes, 1:2000), and goat anti-rat (Molecular Probes, 1:2000). The cells were washed twice with 0.05% Tween-20 in PBS, resuspended in PBS, and compared with the negative control to determine the purity of each sample using FACS.
Microarray Analysis on Purified ECL Cells
Total RNA was isolated from purified ECL cells using NucleoSpin® RNAand virus purification kits (protocol no. PT3168-1, BD Biosciences), and the Agilent low RNA input fluorescent linear amplification kit (product no. 5184-3523) was used to amplify isolated RNA. Total RNA from gastric mucosal layer was used as a baseline to compare with the highly expressed differential genes on purified ECL cells and labeled with Cyanine 3-dCTP (Perkin-Elmer, catalog no. NEL 576). Total RNA (100 ng) from purified ECL cells was amplified and labeled with Cyanine 5-d CTP (Perkin-Elmer, catalog no. NEL 577) using the Fluorescent Direct Label Kit (catalog no. G2557A). The UCLA Microarray Core, using an Agilent dual-laser microarray scanner, carried out the array hybridization and scanning steps.
Purity Assessment With Immunocytochemistry
Approximately 10,000 cells were attached onto glass slides precoated with Cell-Tak using Cytospin 3 (Shandon, Life Sciences International [Europe], Cheshire, England). The cells were fixed with 4% paraformaldehyde and permeabilized with 0.1% Triton X-100 in PBS. As in the purity assessment by FACS, the same three primary and secondary antibodies, at the previously used concentrations were applied to the cells. Slides were visually assessed under confocal microscopy. Negative control slides were prepared and incubated only with goat or rabbit IgG and secondary antibodies to compare with sample slides for purity assessment.
Calcium Signaling
Approximately 100,000 cells were attached to coverslips precoated with Cell-Tak, (BD Biosciences) and Fluo-4 (Molecular Probes) was added and incubated at 37°C for 30 min. The coverslips were then mounted and observed under confocal microscopy and activated with 10−7 M PACAP-38 and then 10−6 M ionomycin at 160 and 800 s, respectively. The calcium response was assessed by comparing the basal with the maximal Ca2+ released by addition of ionomycin.
Proliferation Assay
Cells were resuspended in 100 μL of complete DMEM/F12 and plated in 5-mL glass Falcon tubes (50,000 cells/tube). The tubes were then activated with 10−7 and 10−6 M PACAP-38 in triplicates. A set of tubes were not activated to represent basal proliferation conditions. The cells were counted with a hemocytometer 24 h later. The proliferation results were expressed as a percentage comparing to unstimulated cell growth.
Internalization
Approximately 100,000 cells were attached onto coverslips precoated with Cell-Tak in Petri dishes containing buffer (140 mM NaCl, 1.2 mM MgSO4, 1.0 mM CaCl2, 10 mM HEPES, 11.10 mM glucose, and 1% BSA) and placed on ice, and 10−6 M Fluor-PACAP was added. The Petri dishes were then placed in a thermostatically controlled chamber at 37°C, and the cells were observed for PAC1 receptor internalization using confocal microscopy.
Results
Isolating Pure ECL Cells From Rat Fundic Tissue Via FACS
Two density gradient centrifugations were performed using pronase-digested stomach cells (Fig. 1). A discrete band corresponding to the ECL layer of cells was identified (Fig. 1, black band). Following density gradient centrifugation, approx 7 × 10⁶ cells were released with a relative purity of approx 60%. The population of cells in the ECL layer was gated by forward toward side scatter analysis, which plotted the size versus density of the cell populations (Fig. 2). Given the wide variation in size and density, we explored different pools of cells. Pools of cells in Fig. 2A, B were subsequently analyzed to determine which pool contains the highest percentage of ECL cells, using RT-PCR analysis with primers for HDC, pepsinogen, and H+ and K+ ATPase. As shown in Fig. 2C, high-density cells are mainly parietal cells and, to a lesser extent, ECL and chief cells. Shown in Fig. 2D are low-density cells, which contained mainly ECL and chief cells, but no parietal cells.
Fig. 1.

Location of ECL Layer after density gradient centrifugation. ECL cells were isolated from the stomachs extracted from four rats with the esophageal and intestinal ends tied off. Each stomach was inverted and injected with pronase to form a stomach pouch. The ECL cells were collected and centrifuged following incubation with various solutions. A nycodenz gradient (conc. 6%) was applied to isolate an ECL layer of cells (black band), which yield approx 60% pure ECL cells. The collected ECL cells were incubated with Fluor-PACAP and sorted with FACS using parameters based first, on size and density, and second, on fluorescence. This process yielded approx 2 million pure ECL cells.
Fig. 2.

FACS analysis based on size and density. The purity of ECL cells was assessed with FACS by employing three different antibodies on two different isolated groups based on size: polyclonal rabbit anti-HDC, monoclonal rat antisomatostatin, and polyclonal rabbit anti-PAC1. β-Actin acts as the positive control because it is the housekeeping gene for all rat cells and is present in both groups tested. The group of cells encircled in dark gray (A) represents the group of high-density cells, and the RNAs isolated from this group test positive for pepsinogen, H+, K+ATPase, and HDC, suggesting that chief cells, parietal cells, and ECL cells were present in this population. However, in the group of cells encircled in light gray (B), which represents low-density cells, H+, K+ATPase was absent, suggesting that only chief cells and ECL cells were present in the low-density population of cells.
ECL cells were subsequently sorted using forward toward side scatter analysis, and by their ability to bind Fluor-PACAP-38 (Fig. 3). Two pools of cells were also examined by RT-PCR using primers directed against pepsinogen, H+, K+-ATPase, and HDC (Fig. 3). Examination of this pool of cells in Fig. 3A by RT-PCR demonstrated that contamination with parietal cells was present, as shown by amplification of transcripts for H+, K+-ATPase. As demonstrated in the RT-PCR result with moderate fluorescence/ low-density cells, no transcripts corresponding to pepsinogen or H+, K+-ATPase were present, whereas there was strong expression of HDC (Fig. 3D). These results suggest that the purest pool of ECL cells corresponds to moderately fluorescent/low-density cells (Fig. 4). To verify the identity of the homogeneous population of collected cells, confocal microscopic immunofluo-rescent analysis was performed using polyclonal antibodies raised against HDC, PAC1, somatostatin, and also microarray analysis. The data shown revealed that the majority of the sorted cells were of the ECL type. The final purity of the isolated ECL cells was observed to be >99% with a yield of approx 2 million ECL cells.
Fig. 3.

FACS analysis based on size and fluorescence. The purity of ECL cells was assessed with FACS by employing three different antibodies on two different isolated groups based on size and fluorescence: polyclonal rabbit anti-HDC, monoclonal rat anti-somatostatin, and polyclonal rabbit anti-PAC1. β-Actin acts as the positive control because it is the housekeeping gene for all rat cells and is present in both groups tested. The group of cells encircled in dark gray (A) represents highly fluorescent and large cells. According to the RNAs isolated from the cells, pepsinogen, H and K ATPase, and HDC confirm the presence of chief cells, parietal cells, and ECL cells in the population. Looking at the group representing moderately fluorescent and small cells, the RNAs showed only positivity for HDC, suggesting that pepsinogen and H and K ATPase had been successfully excluded from the population of cells.
Fig. 4.
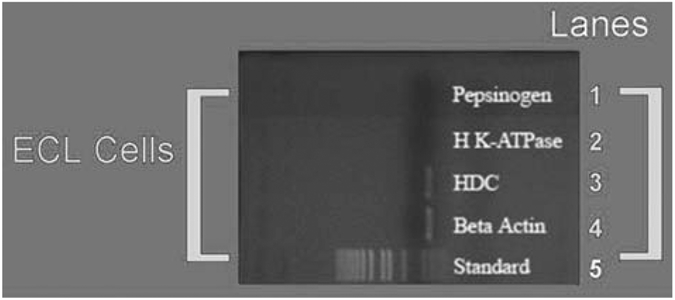
RT-PCR of moderate fluorescence/low-density cells. This is an enlarged image of PCR shown in Fig. 3, demonstrating clearly that only ECL cells are present in the population of cells isolated using parameters of moderate fluorescence and small size.
Purity Assessment of Sorted ECL Cells Using FACS
To determine the purity of isolated ECL cells, cell preps were assessed using cytofluorimetric analysis. We first used isolated ECL cells to study their ability to fluoresce following addition of Fluor-PACAP-38 (Fig. 5). In Fig. 5, peak B are ECL cells that show fluorescence following Fluor-PACAP-38 incubation.
Fig. 5.

FACS analysis following incubation with Fluor-PACAP-38. Represented are the results of FACS analysis following incubation of ECL cells with Fluor-PACAP-38. Unstained cells are shown by peak A, and the sorted fluorescent ECL cells after incubation with Fluor-PACAP-38 are indicated by peak B. The distinctness of the two peaks shows that isolated ECL cells are highly capable of fluorescing upon incubation with Fluor-PACAP-38.
To further confirm that isolated ECL cells were pure and free of contamination by gastric D cells, we performed purity assessment studies using FACS analysis with antibodies against HDC (Fig. 6A), PAC1 (Fig. 6B), or somatostatin antibodies (Fig. 6C). As demonstrated in the Fig 6A and B, the isolated ECL cells expressed both HDC and PAC1, but as shown in Fig. 6C somatostatin was not present in the cell populations studied.
Fig. 6.

Purity assessment using antibodies against HDC, PAC1, or somatostatin. Shown are FACs analysis results of ECL cells incubated with anti-HDC antibody (A), anti-PAC1 antibody (B), and anti-somatostatin antibodies (C). The green line represents unstained cells, and the purple peak represents sorted fluorescent cells. The distinct peaks shown in panels A and B affirm that the isolated ECL cells are positive for HDC and PAC1 receptors. The identical peak found in the anti-somatostatin panel confirms that the population of cells was negative for a somatostatin receptor, suggesting that the isolated population of cells did not contain D cells.
Microarray Analysis of Purified ECL Cells
Microarray analysis of purified ECL cells was performed to further define the purity of the ECL cells. A representative group of genes is predicted to be highly expressed by ECL cells (Fig. 7 and Table 1). Genes that were highly expressed included HDC, chromogranin A and B, and PAC1, whereas there were relatively low levels of expression of H+,K+-ATPase, cholecystokinin A, and VPAC1 and VPAC2 receptors. These results suggest that the gene expression profile of the isolated cells is consistent with those expected for ECL cells.
Fig. 7.

Microarray analysis of purified ECL cells. Microarray studies were done to observe genes present in the isolated population of ECL cells and to further confirm the absence of contaminating cell populations. RNA extracted from stomach mucosa was compared with RNA extracted from pure isolated ECL populations. The red dots indicate high levels of gene expression in ECL cells relative to the gastric epithelium, the green dots show low levels of expression, and yellow dots represent equal levels of gene expression when compared with that found in stomach mucosa. The gene for HDC, chromogranin A and B, and PAC1 were ≥ four fold upregulated, whereas gene expression for parietal cells, cholecystokinin A, VPAC1 and VPAC2 receptors was quite low. Gene expression for D cells and chief cells is not even listed because of the extremely low level of expression. Color image available for viewing at www.humanapress.com.
Table 1.
Genes Predicted to Be Highly Expressed by ECL Cells
| Gene name | Description | Fold change in expression |
|---|---|---|
| 297845_Rn | Rattus norvegicus Histidine decarboxylase (Hdc), mRNA. | 146.05 |
| NM_021655 | Rattus norvegicus Chromogranin A, parathyroid secretory protein 1 (Chga), mRNA. | 94.07 |
| 291163_Rn | Rattus norvegicus Chromogranin B, parathyroid secretory protein 1 (Chgb), mRNA. | 82.99 |
| 293925_Rn | similar to Mouse (Mus musculus domesticus) 129 tyrosine-threonine dual specificity phosphatase PAC-1 gene, complete cds. | 5.88 |
| NM_013165 | Rattus norvegicus Cholecystokinin B receptor (Cckber), mRNA. | 1.89 |
| 379638_Rn | Rattus norvegicus ATPase, H+/K+ transporting, nongastric, alpha polypeptide (Atp12a), mRNA | 1.37 |
| NM_012688 | Rattus norvegicus Cholecystokinin A receptor (Cckar), mRNA. | 0.80 |
| 226919_Rn | Rattus norvegicus vasoactive intestinal peptide receptor 2 (Vipr 2), mRNA. | 0.72 |
| NM_012685 | Rattus norvegicus Vasopressive intestinal peptide receptor (Vipr 1), mRNA. | 0.57 |
Confocal Laser Scanning Microscopy
To further confirm that isolated ECL cells express PAC1 and HDC, confocal microscopy was used to image cells (Fig. 8). We first evaluated the expression of PAC1 on isolated rat ECL cells using immunocyto-chemistry with polyclonal anti-PAC1 antibodies (panel A) compared to control (panel B). As demonstrated in A, the population of purified ECL cells shows strong fluorescence intensity with the anti-PAC1 antibodies. Panel B demonstrates the negative control. Isotope and species-specific antibodies were used as negative controls. These results show visually that essentially all of the isolated ECL cells in the field express PAC1.
Fig. 8.

Confocal analysis. Confocal images show the expression of PAC1 and HDC in isolated ECL cells. Approximately 10,000 cells were attached to glass slides precoated with Cell-Tak using the cytospin. The cells were then fixed with 4% paraformaldehyde and permeabilized with 0.1% Triton X-100 in PBS. The three antibodies used were polyclonal rabbit anti-HDC (panel A), polyclonal rabbit anti-PAC1 (panel B), and monoclonal rat anti-somatostatin ([anti-SS] panel C). The negative controls were incubated with goat IgG and shown in the panels D, E, and F. The presence of fluorescence with anti-PAC1 and anti-HDC further confirms the presence of the PAC1 and HDC receptors (panels A and B) present on the isolated cells, suggesting that the cells are ECL. The absence of fluorescence (panel C) strongly suggests that the isolated population of cells was not contaminated by D cells.
We next evaluated the expression of HDC on isolated rat ECL cells with a polyclonal anti-HDC antibodies, as shown in Fig. 8C,D. As demonstrated in panel C, all of the isolated cells express HDC, an enzyme specific to only ECL cells, of all the other stomach cells found.
Because D and ECL cells have similar size and shape characteristics, there was a possible risk of contamination with D cells. Thus, contamination by gastric D cells was evaluated by determining the expression of somatostatin with an anti-somatostatin antibodies (CURE 9431). As shown in Fig. 8E, none of the isolated ECL cells showed fluorescence with the anti-somatostatin antibodies, which excludes possible contamination by gastric D cells in our ECL populations.
Ca2+ Response to PACAP-38
To determine whether isolated ECL cells exhibit biological activity, we performed calcium response studies. Figure 9A shows an experiment on the effects of 200 nM PACAP-38 stimulation on calcium signaling, where a rapid release of Ca2+ from intracellular stores and then a plateau at 240 s was observed. Figure 9B illustrates the mean and standard deviation for 21 experiments.
Fig. 9.

Calcium response to PACAP stimulation. Approximately 100,000 cells were attached to coverslips precoated with Cell-Tak, and Fluo-4 was added and incubated at 37°C for 30 min. The coverslips were mounted and observed under confocal microscopy and activated with 10−7 M PACAP at 160 s and 10−6 M ionomycin at 800 s. The panel on the left represents three individual experiments performed, whereas the right panel shows the average of 21 experiments of calcium response to PACAP-38 with standard deviation.
PACAP-38 Stimulates ECL Prolifseration
Cells were divided into separate tubes with a known concentration of cells. One tube was unstimulated and left as the control, whereas the other tubes were stimulated with 10 nM and 100 nM PACAP-38. Following a 24-h incubation of sorted ECL cells with PACAP-38 at the indicated molar concentration, cellular proliferation was assessed by counting the number of viable cells using a hemocytometer. As demonstrated, there is nearly a 25% increase of ECL cell growth compared with unstimulated cells (Fig. 10). These results indicate that the isolated and purified ECL cells are viable and also capable of PACAP-induced biological activity as shown by Ca2+ signaling and proliferation studies.
Fig. 10.
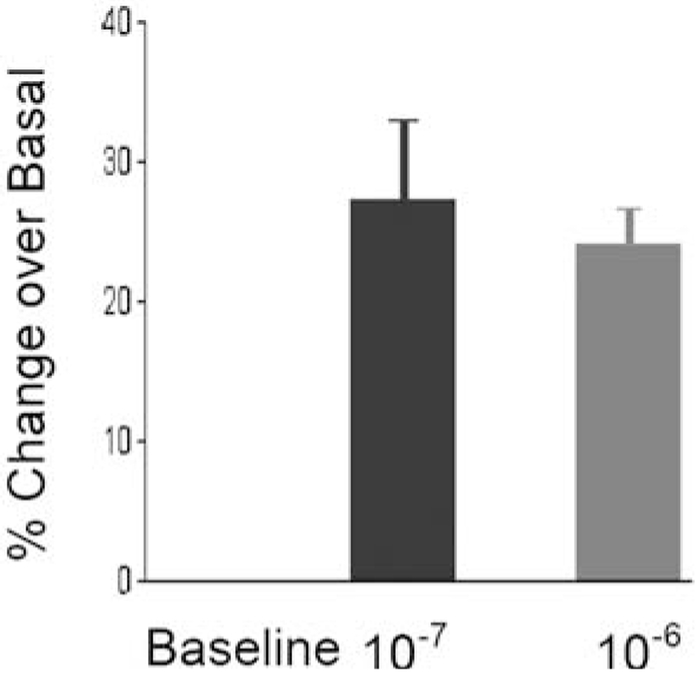
PACAP-induced proliferation of ECL cell cultures. Cells (50,000) were plated in complete DMEM/F12 medium in separate 5-mL Falcon tubes. The tubes were then activated with 10−7 and 10−6 M PACAP-38 in triplicates. A set of tubes was not activated to represent basal proliferation conditions. The cells were counted with a hemocytometer after 24 h of stimulation. The proliferation results were expressed as a percentage compared with unstimulated cell growth.
Internalization Using Confocal Microscopy
Confocal microscopy was used to visualize PAC1 receptor staining by Fluo-PACAP. Internalizatiion of PAC1 receptor was observed after warming isolated ECL cells in the chamber. Initiation of PAC1 receptor internalization was observed after approx 2 min (Fig. 11).
Fig. 11.

PAC1 receptor internalization sequence in pure ECL cells. From left to right: time 0 (A), 113.610 s (B), 265.090 s (C), 716.570 s (D), 568.050 s (E), and 719.530 s (F).
Discussion
Gastric carcinoid tumors, observed in patients with chronic atrophic gastritis (type-I tumors) and combined Zollinger-Ellison syndrome with multiple endocrine neoplasia type I (type-II tumors) are correlated with hypergastrinemia and the proliferation of ECL cells (Låuffer et al., 1999). Låuffer et al. (1999) showed that PACAP is the fundic neural modulator for ECL proliferation. Employing elutriation followed by enrichment on collagen I-treated plates to isolate ECL cells, these investigators reported that PACAP stimulated 5-bromo-2-deoxyuridine (BrdU) uptake by almost fourfold over baseline. Additionally, inhibitors of growth factor receptor-associated and cytosolic protein tyrosine kinases inhibited PACAP-38-induced BrdU uptake in ECL cells by 65%. PACAP/VIP-related peptides were demonstrated to exhibit qualities as potent neuronal modulators of ECL cell proliferation (Låuffer et al., 1999). A criticism of these studies is the use of enriched ECL cell preparations, and an even more pure preparation of ECL cells is required to rule out potential paracrine effects of contaminating gastric cell types; although with Ca2+ signaling studies, rapid superfusion was used, ruling out paracrine effects (Prinz et al., 1994).
The development of this method for isolating pure ECL cells by adding cytoflourimetric sorting enhances the ability to collect and study in vitro cellular systems for functional physiologic and genetic studies. The FACS criteria for the purification of ECL cells included the documented small size and low density of these cells relative to the other gastric cell types released upon stomach digestion, as well as green fluorescence labeling attributed to the natural binding of Fluor-PACAP-38 to PAC1 receptors (Zeng and Sachs, 1998). Although in the stomach other cell types that express PAC1 or VPAC are able to bind PACAP-38 (Zeng and Sachs, 1998), the imposition of size, density, and ligand-binding criteria focused sorting upon a specific homogeneous population of cells (Fig. 1). Accordingly, this gated group of cells was unambiguously identified as ECL cells, purified to approx 99%, based on subsequent immunohistochemical observations (Fig. 8). The yield of ECL cells after sorting has been greater than that afforded by the elutriation method. As a result, we speculated that cell sorting minimizes the harsh treatment of these cells during purification, apparently to a greater extent than elutriation, as observed by the greater relative recovery of viable ECL cells. Upon closer inspection of the statistics tabulated by the sorter, the discrepancy between the number of cells counted by FACS and those counted with a hemocytometer was attributed to the rather low threshold set on the sorter. Because it was difficult to determine whether the FACS machine counted actual cells or cellular debris, visual inspection was required to approximate the actual ECL yield. The collected ECL cells composed about 60% of cells tallied before sorting, consistent with the published data that described ECL cells as comprising about 65% of the endocrine cells in the rat stomach; these cells, in turn, constitute only 1–5% of the total gastric mucosal cell mass (Låuffer et al., 1999).
Based on the established pharmacology of PACAP (Germano et al., 2001), we proposed that a significant variable that might have affected the yield of sorted ECL cells was the possibility of PACAP-38 internalization (Germano et al., 2001). Although the cells were incubated on ice or at lower temperatures to decrease the progression of this activity, the actual sorting process was not temperature regulated. Therefore, ECL cells could have internalized the peptide, or the peptide might have degraded because of temperature denaturation, thereby reducing the capacity of the FACS to recognize and sort the cells of interest. Although temperature regulation as the cells traveled through the FACS machine was not feasible, we incorporated procedural modifications to decrease internalization interference. The cells procured before sorting were separated into three tubes and incubated with Fluor-PACAP-38 on ice. Furthermore, during the actual sorting process, the samples resided on ice, keeping the temperature low to slow down peptide internalization. In this way, the sorting process was optimized for ECL recovery and purity.
Because HDC is an established marker for ECL cells, anti-HDC immunohistochemical analysis was implemented to verify purification of the desired cell type. Even after pronase digestion and sorting, the PAC1 receptors of the FACS-purified ECL cells remained intact, as evidenced by their capacity to bind Fluor-PACAP-38, corroborating the finding that ECL cells express PAC1. Therefore, visualization of the specificity of fluorescent-tagged PACAP-38 lends support to the validity of this novel methodology for isolating pure ECL samples from rat stomachs. Although the collected ECL cells did not elicit signs of morphological alterations owing to the purification process, subsequent functional analyses were employed to determine cellular vitality.
Pituitary adenylate cyclase-activating polypeptide 38 (PACAP-38) treatment of ECL cells was utilized to further verify that the isolated cells were physiologically functional. The mitogenic effect of PACAP-38 observed in this investigation was similar to that reported in other cell systems, including those measured by alterations in cell numbers, MTT (3-[4, 5-Dimethythiazol 2-yl] -2, 5-diphenyl-tetrazolium bromide; Sigma, catalog no. M-2128 5- assay, and [3H]thymidine uptake. In particular, the nearly 20% increase in ECL proliferation over basal levels after only 24 h of treatment with 10−7 M PACAP-38 (illustrated in Fig. 3) confirmed the data acquired by Låuffer et al. (1999) in which low concentrations of PACAP-38 induced ECL proliferation, as measured by BrdU uptake. The ability of Fluor-PACAP-38 to induce ECL proliferation also implied that PAC1 and its associated second-messenger components remained functional throughout purification. The FACS-purified ECL cells were viable after digestion and sorting in preparation for succeeding in vitro investigation and short-term culturing. Supplementary MAPKs and cAMP assays should elucidate the signal transduction mechanisms invoked by PACAP stimulation of proliferation hypothesized by Låuffer et al. (1999).
The purification and yield of FACS-purified ECL cells was, in general, greater than that afforded by elutriation and density centrifugation alone. With the ability to isolate such a pure collection of ECL cells, further microarray analyses employing ECL mRNA extracts will enable the unequivocal deciphering of gene expression under various conditions within the context of gastric acid secretion as well as carcinogenesis. Furthermore, with the availability of PACAP and VIP knockout mice, the sorting protocol might be adapted to these model systems to facilitate reverse genetic studies of PACAP functioning within the neural branch of gastric secretion regulation. In a broader context, taking advantage of known cell-specific receptor ligand-binding characteristics, FACS should be applicable to the isolation and purification of other cell types for similar genome, transcriptome, and proteome analyses.
In conclusion, the use of FACS with Fluor-PACAP permits the purification of ECL cells by taking advantage of the expression of PAC1 receptors on their surface and thereby will facilitate genetic and molecular studies. Moreover, these technological achievements will provide the basis for developing more refined studies to characterize the cellular biology of rare cells within the gastrointestinal tract.
Acknowledgments
This work was supported by a Department of Veteran Affairs merit review grant (J. R. P.).
References
- Germano PM, Stalter J, Le SV, Wu M, Yamaguchi DJ, Scott D, and Pisegna JR (2001) Characterization of the pharmacology, signal transduction and internalization of a fluorescent PACAP ligand, Fluor-PACAP, on NIH 3T3 cells expressing PAC1. Peptides 6, 861–866. [DOI] [PMC free article] [PubMed] [Google Scholar]
- Håkanson R, Chen D, Lindström E, Bernsand M, and Norlén P (2001) Control of secretion from rat stomach ECL cells in situ and in primary culture. Scand. J. Clin. Lab. Invest. Suppl. 234, 53–60. [PubMed] [Google Scholar]
- Låuffer JM, Modlin IM, Hinoue T, Kidd M, Zhang T, Schmid SW, and Tang LH (1999) Pituitary adenylate cyclase-activating polypeptide modulates gastric enterochromaffin-like cell proliferation in rats. Gastroenterology 116 (3), 623–635. [DOI] [PubMed] [Google Scholar]
- Lindström E, Eliasson L, Björkqvist M, and Håkanson R (2001) Gastrin and the neuropeptide PACAP evoke secretion from rat stomach histamine-containing (ECL) cells by stimulating influx of Ca2+ through different Ca2+ channels. J. Physiol. 535 (Pt3), 663–677. [DOI] [PMC free article] [PubMed] [Google Scholar]
- Prinz C, Scott DR, Hurwitz D, Helander HF, and Sachs G (1994) Gastrin effect on isolated rat enterochromafin-like cells in primary culture. Am. J. Physiol. 267, G663–675. [DOI] [PubMed] [Google Scholar]
- Sandvik AK, Cui G, Bakke I, Munkvold B, and Waldum HL (2001) PACAP stimulates gastric acid secretion in the rat by inducing histamine release. Am. J. Physiol. Gastrointest. Liver Physiol. 281 (4), G997–1003. [DOI] [PubMed] [Google Scholar]
- Zeng N and Sachs G (1998) Properties of isolated gastric enterochromaffin-like cells. Yale J. Biol. Med. 71, 233–246. [PMC free article] [PubMed] [Google Scholar]
- Zeng N, Athmann C, Kang T, Lyu RM, Walsh JH, Ohning GV, et al. (1999) PACAP type I receptor activation regulates ECL cells and gastric acid secretion. J. Clin. Invest. 104, 1383–1391. [DOI] [PMC free article] [PubMed] [Google Scholar]