Abstract
Circulating extracellular vesicles (EVs) are a novel and emerging biomarker for nonalcoholic steatohepatitis (NASH). It has been demonstrated that total circulating EVs and hepatocyte‐derived EVs are elevated in male mice with diet‐induced NASH. How hepatocyte‐derived EVs change over time and other cellular sources of EVs in NASH have not been determined. Our objective was to define the quantitative evolution of hepatocyte‐derived, macrophage‐derived, neutrophil‐derived, and platelet‐derived EVs in male and female mice with dietary NASH. Fluorescently labeled antibodies and a nanoscale flow cytometer were used to detect plasma levels of EVs. Asialoglycoprotein receptor 1 (ASGR1) and cytochrome P450 family 2 subfamily E member 1 (CYP2E1) are markers of hepatocyte‐derived EVs; galectin 3 is a marker of macrophage‐derived EVs; common epitope on lymphocyte antigen 6 complex, locus G/C1 (Ly‐6G and Ly‐6C) is a marker of neutrophil‐derived EVs; and clusters of differentiation 61 (CD61) is a marker of platelet‐derived EVs. Nonalcoholic fatty liver disease activity score (NAS) was calculated using hematoxylin and eosin‐stained liver sections, and magnetic resonance imaging (MRI) was used for measurement of the fat fraction and elastography. Hepatocyte‐derived EVs increased in both male and female mice at 12 and 10 weeks of feeding, respectively, and remained elevated at 24 weeks in both male and female mice and at 48 weeks in male mice and 36 weeks in female mice. Macrophage‐ and neutrophil‐derived EVs were significantly elevated at 24 weeks of dietary feeding concomitant with the histologic presence of inflammatory foci in the liver. In fat‐, fructose‐, and cholesterol‐ (FFC) fed male mice, platelet‐derived EVs were elevated at 12, 24, and 48 weeks, whereas in female mice, platelet derived EVs were significantly elevated at 24 weeks. Hepatocyte‐, macrophage‐ and neutrophil‐derived EVs correlated well with the histologic NAS. Conclusion: Circulating cell‐type‐specific EVs may be a novel biomarker for NASH diagnosis and longitudinal follow up.
Abbreviations
- +
positive
- ALT
alanine aminotransferase
- APC
allophycocyanin
- ASGR1
asialoglycoprotein receptor 1
- CD
clusters of differentiation
- CYP2E1
cytochrome P4502E1
- EV
extracellular vesicle
- FFC
fat, fructose, and cholesterol
- Ly‐6G/6C
lymphocyte antigen 6 complex, locus G/C1
- MRE
magnetic resonance elastography
- MRI
magnetic resonance imaging
- NAFLD
nonalcoholic fatty liver disease
- NAS
nonalcoholic fatty liver disease activity score
- NASH
nonalcoholic steatohepatitis
- ns
not significant
- RCD
rodent chow diet
Nonalcoholic fatty liver disease (NAFLD) is the most prevalent chronic liver disease worldwide.1 The progressive component of NAFLD, termed nonalcoholic steatohepatitis (NASH), is characterized by hepatocellular injury, ballooning, inflammation, and fibrosis. NAFLD, including NASH, is a complex and heterogeneous disorder in which the combinatorial and variable contribution of multiple pathogenic processes, such as lipotoxicity, microbiome, environment, epigenetics, genetic variants, and other unidentified factors, leads to great individual variability.2 Biological sex is an additional key factor that influences disease phenotype.3, 4 The influence of biological sex on NAFLD pathogenesis and on biomarkers being developed as a replacement to the gold‐standard liver biopsy remains incompletely understood.
Circulating extracellular vesicles (EVs) are a relatively novel and promising blood‐based biomarker being tested for diagnostic utility in NAFLD.5, 6 Most cells release EVs into their extracellular milieu.6 Quantitative changes in EV numbers or qualitative changes in EV cargoes in disease states may serve as disease‐specific signatures and are being developed as potential blood‐based biomarkers.5 It has been demonstrated that total circulating EVs and hepatocyte‐derived EVs are elevated in male mice with diet‐induced NASH.7 In addition to hepatocytes, innate immune cells, especially macrophages and neutrophils, are implicated in NASH8, 9; however, alternative cellular sources of EVs in NASH models have not been characterized.
Epidemiologic data support an increase in NAFLD prevalence in women after menopause,10 yet overall, men are at greater risk for NAFLD and related fibrosis and hepatocellular carcinoma, even after adjusting for age and metabolic comorbidities.11 Dietary murine models of NAFLD frequently demonstrate a similar sexual dimorphism.3 Male mice from the C57BL/6J strain develop significant weight gain and associated metabolic features, such as insulin resistance and hepatic steatosis, while female mice from the same strain are relatively resistant to the effects of diet‐induced obesity.12 Similarly, biomarkers of liver disease may demonstrate sexual dimorphism.13 For example, plasma alanine aminotransferase (ALT) levels and microRNA‐122 levels are higher in men than women.13, 14 The influence of biological sex on circulating EVs in NAFLD has not been carefully examined. The diverse cellular sources of EVs have also not been delineated. Therefore, our objective was to characterize circulating EVs derived from platelets, macrophages, neutrophils, and hepatocytes in female mice fed a diet high in fat, fructose, and cholesterol (FFC) over time in comparison to male mice in order to report on the cellular sources of circulating EVs and the influence of biological sex on circulating EVs. We further compared circulating EVs with a histologic assessment of the well‐established gold‐standard NAFLD activity score (NAS) and magnetic resonance elastography (MRE) parameters, an emerging noninvasive biomarker. Here, we demonstrate that hepatocyte‐derived EVs are elevated early in NAFLD, well before histologically apparent inflammation, and remain elevated over time; furthermore, hepatocyte‐derived EVs correlate well with histologic features of NASH.
Materials and Methods
Animal Model
All animal use was approved by the institutional care and animal use committee of the Mayo Clinic and conducted in accordance with the public health policy on the humane use and care of laboratory animals. C56BL/6J female mice (n = 96; 9 weeks of age) were purchased from the Jackson Laboratory (Bar Harbor, ME) and acclimated for 3 weeks on standard rodent chow diet (RCD). At 12 weeks of age, mice were randomized to two dietary groups; the RCD group of mice continued to receive rodent chow (catalog number 5053; Lab Test Diet), whereas the NASH group was switched to an FFC diet. The FFC diet provides 40% kcal from fat and 0.15% cholesterol (AIN‐76A; Western Diet), with high fructose corn syrup (23.1 g/L fructose and 18.9 g/L glucose) in their drinking water, as previously described by us.15 Mice had unrestricted access to food and water and were housed in standard pathogen‐free facilities with 12‐hour day–night circadian cycles. Mouse grouping was based on the time points (1, 10, 16, 24, 36, and 60 weeks) that mice were euthanized. FFC‐fed mice and chow‐fed mice were each housed in two cages, four per cage, per time point.
Magnetic resonance imaging (MRI) examinations were performed monthly. Body weight was recorded before MRI and also before euthanasia, both following 6 hours of fasting. At each terminal time point, mice were euthanized following 6 hours fasting during the light cycle. Platelet‐poor plasma collected by cardiac puncture was isolated from citrated blood by centrifugation at 1,200g for 20 minutes at room temperature, followed by 13,000g at 4°C for 2 minutes. Plasma was stored at −20°C until further analyses. The liver was excised, weighed, fixed in formalin, and embedded in paraffin for histology.
To compare the influence of biological sex on EVs, we used archived plasma from a published study in which male C56BL/6J mice, obtained from Jackson Laboratory, were fed the FFC diet.16 We analyzed available samples from weeks 12, 24, and 48. The primary mouse handler from our laboratory, mouse room in the vivarium, and rack cage positions were similar in both studies. Histologic assessment of NAFLD, MRI characteristics, and plasma ALT levels from this cohort of male mice have been reported in our published work.16
Detection and Quantification of Plasma EVs
Plasma EVs were detected by nanoscale flow cytometry (A60‐Micro; Apogee Flow Systems Inc.). Well‐characterized cell‐type‐specific plasma membrane proteins that have been used for EV characterization were used. These include clusters of differentiation (CD) 61 for platelet‐derived EVs (CD61‐allophycocyanin [APC], clone 2C9.G2; Miltenyi Biotec),17 Mac‐2 (also known as galectin‐3) for macrophage‐derived EVs (Alexa Fluor 448 Galectin‐3; BD Biosciences),18 RB6‐8C5 antigen for neutrophil‐derived EVs (APC‐Cy7‐lymphocyte antigen 6 complex, locus G/C1 [Ly‐6G and Ly‐6C]; BD Biosciences),19 and asialoglycoprotein receptor 1 (Asgr1; Proteintech) and cytochrome p450 family 2, subfamily e, polypeptide 1 (Cyp2E1; CYP450‐GP) for hepatocyte‐derived EVs.20, 21, 22, 23, 24, 25, 26, 27
ASGR1 and CYP2E1 antibodies were covalently conjugated with fluorophores using commercially available antibody labeling kits (Alexa Fluor 488 and Alexa Fluor 647 from Thermo Fisher Scientific) according to instructions; antibody‐matched isotypes were also conjugated to the respective fluorophores. Antibody conjugation efficiency was measured using Nanodrop (Thermo Fisher Scientific). To exclude differences in antibody‐labeling efficiency, we confirmed that there were no differences in fluorescence signal intensity for each specific antibody and its isotype control by nanoscale flow cytometry on phosphate‐buffered saline as it is devoid of EVs (Supporting Fig. S1). For each sample, 10 μL plasma was labeled with either antibodies to detect platelet‐, macrophage‐, and neutrophil‐derived EVs or labeled with antibodies to detect hepatocyte‐derived EVs, and incubated for 30 minutes at room temperature in the dark. The final concentrations of antibodies used were 10 μg/mL for platelet‐, macrophage‐, and neutrophil‐derived EVs and 5 μg/mL for hepatocyte‐derived EVs. Isotype control immunoglobulins were used at the same concentration as corresponding antibodies. Single‐labeled plasma samples were included to set up compensation. Each plasma sample was assayed in triplicate. After incubation, 1% filtered paraformaldehyde was added to stop the immunolabeling reaction, and the final volume of each sample was brought to 200 μL.
Before sample analysis, the A60‐Micro nanoscale flow cytometer was calibrated using a reference bead mix, as described.28 Briefly, polystyrene and silica beads with diameters ranging from 110 nm to 1,300 nm were used to evaluate A60‐Micro sensitivity for light‐scatter detection. Light‐scatter triggering thresholds were set such that all events falling between 110 nm and 1,000 nm were gated as EVs. Nonspecific fluorescent backgrounds produced by plasmas incubated with isotype controls were used to gate on antibody‐positive EVs. Samples were run at a flow rate of 1.5 μL/minute for 1 minute.
Histologic Analyses and ALT
We stained 5‐μm sections of formalin‐fixed paraffin‐embedded liver tissues with hematoxylin and eosin using standard techniques; these were used for histologic grading according to the NAFLD activity score (NAS) by a blinded expert pathologist.29 Fibrosis was assessed by sirius red staining of 5‐µm liver sections, as described by us in detail, and also graded in a blinded fashion by an expert pathologist.30 The percentage area of sirius red staining was quantified using National Institutes of Health ImageJ software. Plasma ALT levels were measured using a commercial veterinary chemistry analyzer (VetScan 2; Abaxis).
MRI/MRE and Processing
All experiments were performed on a 3.0‐T whole‐body MRI scanner (HDx; GE Healthcare, Milwaukee, WI) with a custom 8‐channel, 4‐cm inner diameter, receive‐only, birdcage imaging coil. After a 6‐hour fasting, each mouse was anesthetized with 1.0%‐1.5% isoflurane and received maintenance inhalation anesthesia during the scan. A sliver needle (0.26 mm in diameter and 39 mm in length; Asahi Medical Instrument Co., Kawaguchi, Japan) was inserted into the liver tissue from the anterior abdominal wall. The other end of the needle was connected to a passive pneumatic driver to generate shear waves throughout the liver at 80 Hz. The MRI/MRE imaging and image‐processing methods have been described.16 Hepatic fat fraction (%) was assessed by the two‐point Dixon method, using a fasting, spoiled, gradient echo sequence. Acquisition time was about 1 minute per mouse. MRE wave images were acquired with a free‐breathing, 4‐shot, 8‐slice, spin‐echo‐based echo planar imaging MRE sequence. Acquisition time was about 2.5 minutes per mouse. We calculated the means and SDs of shear stiffness and damping ratio within manually defined volumetric regions of interests. We calculated the normalized shear stiffness/damping ratio with the absolute value of shear stiffness/damping ratio of FFC‐fed mice weighted by the mean value of age‐matched RCD‐fed mice in each group. The normalized values for RCD mice should be 1 at each time point.
Statistical Analyses
Statistical analyses were performed using SPSS version 19.0 (IBM Analytics). Quantitative variables were presented as mean ± SEM. The one‐tailed or two‐tailed Student t test or Mann‐Whitney U test was used for comparing groups. Spearman's rank correlation coefficient was calculated for correlation analysis. P < 0.05 was considered significant. Data analyses of the flow cytometry experiment were performed using FlowJo 10.0. All authors had access to the study data and reviewed and approved the final manuscript.
Results
Cellular Sources of Elevated Plasma EVs in FFC‐FED Mice
We used nanoscale flow cytometry to characterize circulating EVs in plasma in order to understand the cellular sources and kinetic changes in EVs in the development and progression of NASH. Label‐free quantification of total EVs is shown in Supporting Fig. S2. As total EVs are nonspecific, we wanted to examine the cell‐type‐specific EVs; therefore, we first quantified hepatocyte‐derived EVs using the markers ASGR1 and CYP2E1 in female and male FFC‐fed mice over time. ASGR1‐positive EVs were elevated in male mice at 12, 24, and 48 weeks and in female mice at 10, 24, and 36 weeks (Fig. 1A,B). Not all ASGR1‐positive EVs expressed CYP2E1 (Fig. 1C,D), but the percentage of ASGR1‐positive EVs that also expressed CYP2E1 remained comparable between RCD‐fed and FFC‐fed mice. CYP2E1‐positive EVs were significantly increased in FFC‐fed male mice at 24 and 48 weeks of feeding and in FFC‐fed female mice at 10 and 24 weeks of feeding (Fig. 1E,F). We determined that the percentage of CYP2E1‐positive EVs that also expressed ASGR1 were similar between RCD‐fed and FFC‐fed mice (Fig. 1G,H). These data indicate that hepatocyte‐derived EVs are elevated in FFC‐fed male and female mice over time. Not all EVs expressed both markers, indicating heterogeneity in hepatocyte‐derived EVs. The percentages that expressed both markers remained unchanged between RCD‐fed and FFC‐fed mice, suggesting that EVs elevated due to FFC feeding in mice did not express both hepatocyte markers.
Figure 1.
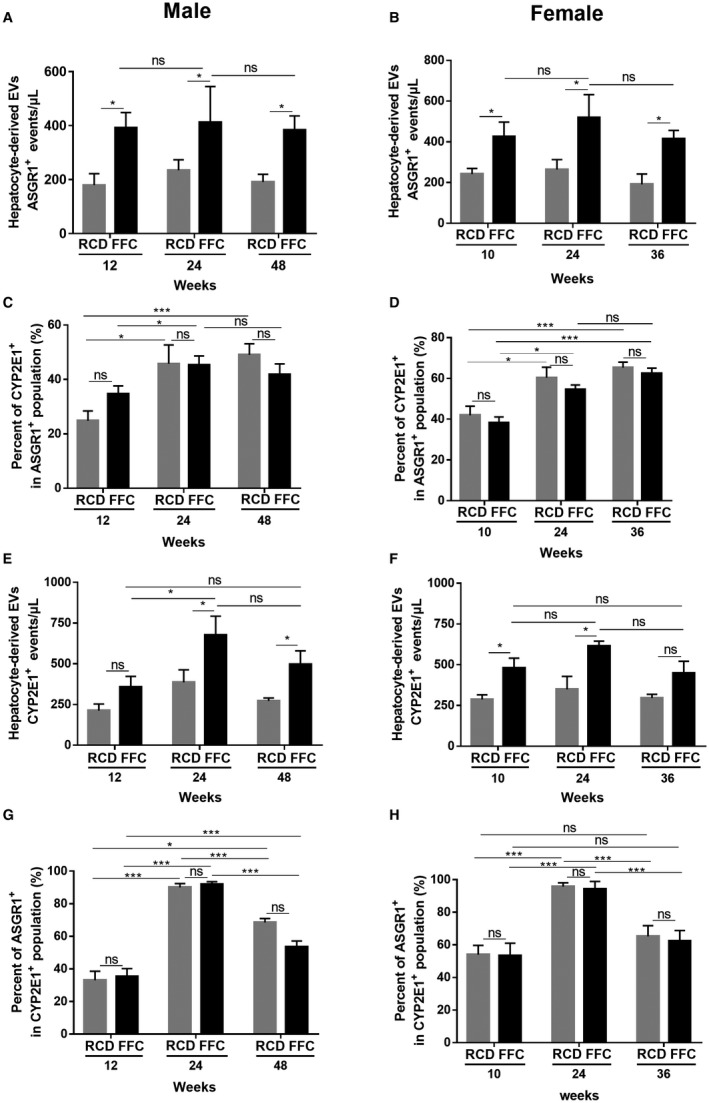
Hepatocyte‐derived EVs in male and female FFC‐fed mice. (A,B) Quantification of circulating hepatocyte‐derived EVs (ASGR1+) in both male and female RCD and FFC‐fed mice. (C,D) Percentages of CYP2E1+ EVs in the ASGR1+ populations in both RCD and FFC‐fed male and female mice. (E,F) Quantification of circulating hepatocyte‐derived EVs (CYP2E1+) in both male and female RCD and FFC‐fed mice. (G,H) Percentages of ASGR1+ EVs in the CYP2E1+ populations in both RCD and FFC‐fed male and female mice. Data represent mean ± SEM; n = 6 for each group; *P < 0.05, ***P < 0.001.
Secretory products of cells of the innate immune system, especially macrophages and neutrophils, play an important role in the inflammation noted in NASH. To determine whether these cell types could also release EVs, we quantified macrophage‐derived and neutrophil‐derived EVs. Platelet‐derived EVs are known to be abundant and were also included. Macrophage‐derived EV levels were increased in both male (at 24 and 48 weeks) and female (at 24 and 36 weeks) RCD‐fed and FFC‐fed mice over time, although EVs were significantly higher in the FFC‐fed mice (Fig. 2A,B). There were no differences between RCD‐fed and FFC‐fed macrophage‐derived EVs at early time points. Neutrophil‐derived EVs could not be detected at 12 weeks in FFC‐fed male mice and 10 weeks in female mice (Fig. 2C,D). These EVs were elevated concomitantly with histologic NASH at 24 weeks in both male and female mice. The elevation persisted in FFC‐fed male mice at 48 weeks. Interestingly, even in RCD‐fed mice, neutrophil‐derived EVs increased with age. Platelet‐derived EVs were significantly higher in FFC‐fed male mice than RCD‐fed male mice at 12, 24, and 48 weeks (Fig. 2E). In contrast, FFC‐fed and RCD‐fed female mice demonstrated an increase in platelet‐derived EVs at 24 weeks of feeding, although the increase in FFC‐fed mice was significantly greater (Fig. 2F).
Figure 2.
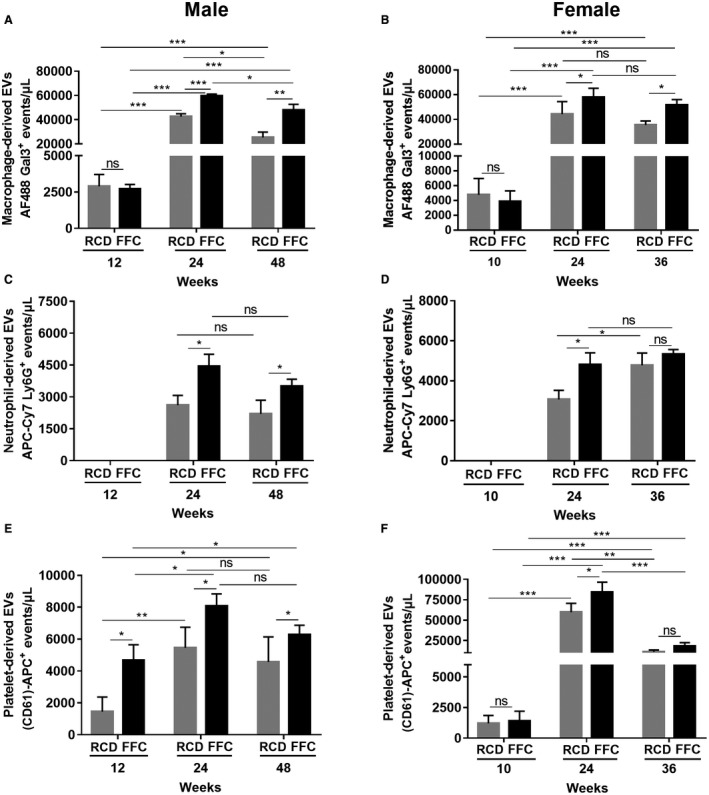
Macrophage, neutrophil, and platelet‐derived EVs in male and female FFC‐fed mice. (A,B) Quantification of circulating macrophage‐derived EVs (Alexa Fluor 448 Galectin‐3) in both male and female RCD and FFC‐fed mice. (C,D) Quantification of circulating neutrophil‐derived EVs (APC‐Cy7‐Ly6G and Ly‐6C) in both male and female RCD and FFC‐fed mice. (E,F) Quantification of circulating platelet‐derived EVs (CD61‐APC) in both male and female RCD and FFC‐fed mice. Data represent mean ± SEM; n = 6 for each group; *P < 0.05, **P < 0.01, ***P < 0.001. Abbreviation: AF488 Gal3, Alexa Fluor 448 Galectin‐3.
We investigated the correlation between circulating EVs of different cell types with histologic and imaging features. Macrophage‐derived EVs correlated with steatosis, lobular inflammation, ballooning, and fibrosis stage, which marked the severity of NASH and could be distinguished by different NAS scores (Fig. 3A; Table 1). Neutrophil‐ and platelet‐derived EVs not only correlated with NAS predominantly driven by ballooning (Fig. 3B,C) but also fibrosis stage and MRI‐calculated fat fraction (Table 1). Hepatocyte‐derived EVs increased with NAS (Fig. 3D,E) and correlated with individual components of NAS (Table 1) but did not correlate with fat fraction. The highest correlations were between macrophage‐derived EVs and neutrophil‐derived EVs and histologic gold‐standard features of NASH (Table 1). These data suggest that EVs could be used as potential biomarkers.
Figure 3.
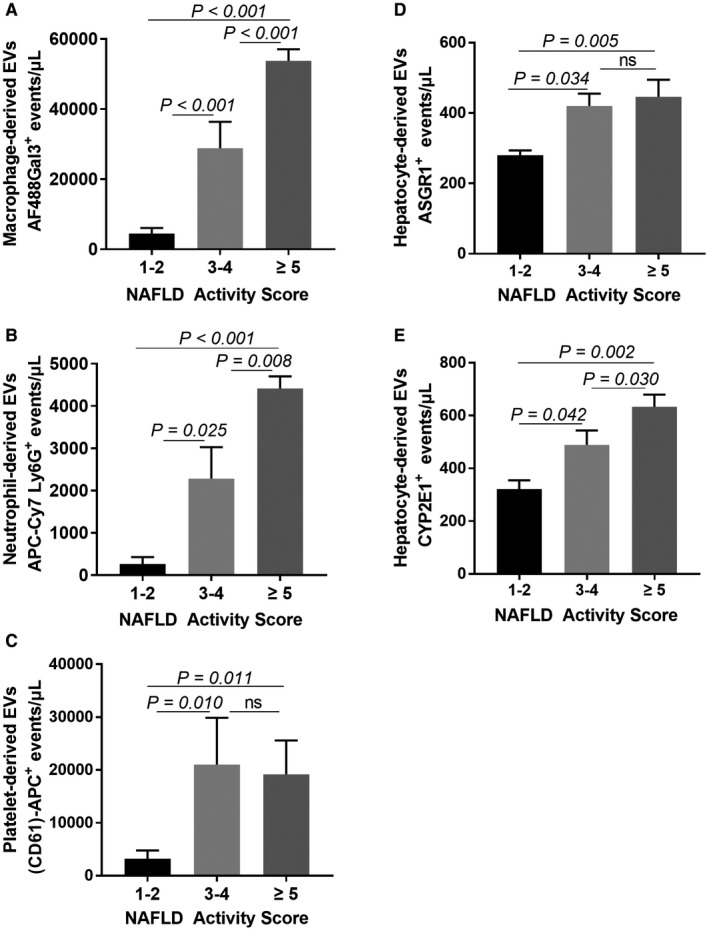
Correlations of circulating EV levels with NAS. (A) Correlation of macrophage‐derived EVs with NAS. (B) Correlation of neutrophil‐derived EVs with NAS. (C) Correlation of platelet‐derived EVs with NAS. (D) Correlation of hepatocyte‐derived ASGR1+ EVs with NAS. (E) Correlation of hepatocyte‐derived CYP2E1+ EVs with NAS. Data represent mean ± SEM; n = 5 for NAS 1‐2, n = 14 for NAS 3‐4, n = 17 for NAS ≥5.
Table 1.
Correlations of Circulating EV Levels With Steatosis, Inflammation, and Fibrosis in All Male and Female FFC‐FED Mice With NASH
| Macrophage EVs | Neutrophil EVs | Platelet EVs, | Hepatocyte‐ASGR1+ EVs | Hepatocyte‐CYP2E1+ EVs | ||||||
|---|---|---|---|---|---|---|---|---|---|---|
| r | P | r | P | r | P | r | P | r | P | |
| NAS (n = 36) | 0.554 | <0.001 | 0.511 | 0.001 | 0.406 | 0.014 | 0.432 | 0.024 | 0.428 | 0.012 |
| Fat fraction (%) (n = 24) | 0.158 | 0.405 | 0.622 | <0.001 | 0.608 | <0.001 | 0.266 | 0.163 | 0.100 | 0.997 |
| Steatosis grade (n = 36) | 0.364 | 0.029 | 0.197 | 0.249 | 0.206 | 0.228 | 0.486 | 0.032 | 0.525 | 0.013 |
| Fibrosis stage (n = 36) | 0.577 | <0.001 | 0.597 | <0.001 | 0.518 | 0.001 | 0.502 | 0.002 | 0.511 | 0.003 |
| Lobular inflammation (n = 36) | 0.415 | 0.012 | 0.341 | 0.042 | 0.205 | 0.231 | 0.463 | 0.010 | 0.425 | 0.016 |
| Ballooning (n = 36) | 0.502 | 0.002 | 0.650 | <0.001 | 0.537 | 0.001 | 0.324 | 0.047 | 0.398 | 0.038 |
FFC‐FED Female Mice Gain Weight and Develop Liver Injury, Inflammation, and Fibrosis
Female mice fed the FFC diet gained body mass steadily starting at 10 weeks and reached a plateau at week 24 (Fig. 4A). Compared with their age‐matched controls, the mean values of body weights were significantly higher at all time points except week 1 (Fig. 4A). RCD‐fed mice did not gain weight over the duration of the study. FFC‐fed mice developed hepatomegaly at 10 weeks of feeding (FFC‐fed mice, 1.36 ± 0.20 g vs. RCD‐fed mice, 1.00 ± 0.09 g; P < 0.001). Furthermore, when normalized to body mass, the liver index or relative liver mass was elevated in the FFC‐fed female mice at weeks 10, 24, 36, and 60 but comparable at week 16 of feeding between the two dietary groups (Fig. 4B). Serum ALT levels of FFC‐fed mice were unchanged at week 1 and increased starting at week 10 compared to RCD‐fed mice (Fig. 4C). ALT levels plateaued at week 24 in FFC‐fed female mice and remained unchanged over time in RCD‐fed mice.
Figure 4.
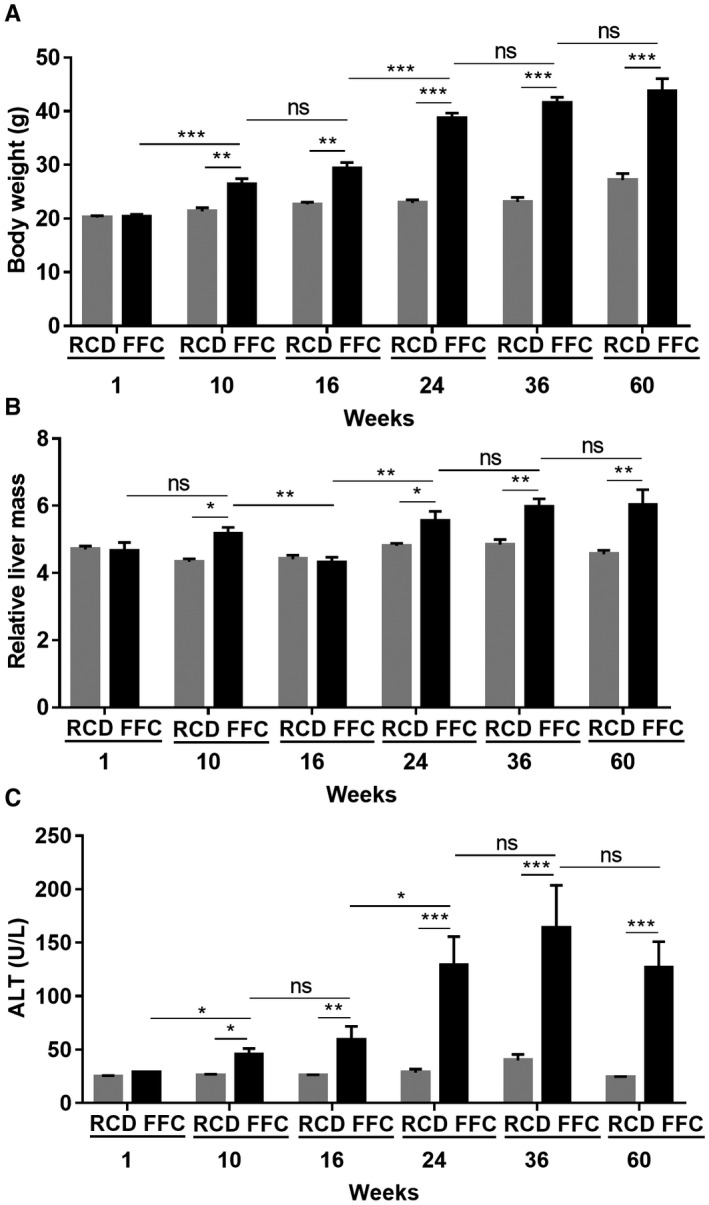
FFC‐fed female mice develop liver injury. (A) Body weight of FFC‐fed female mice (n = 5‐8 per group) showed significantly elevated body weights from week 10 onwards compared with RCD mice (n = 7‐8 per group). (B) FFC‐fed mice had significantly higher relative liver mass at weeks 10, 24, 36, and 60 (n = 7‐8 per group). (C) FFC‐fed mice had significantly elevated ALT levels compared with RCD mice from weeks 10 to 60 (n = 4‐8 per group), while the ALT levels of RCD mice were stable and low. Data represent mean ± SEM; *P < 0.05, **P < 0.01, ***P < 0.001.
Histologic analysis demonstrated that steatosis was observed from week 1 onwards (Figs. 5A and 6). At week 1, five out of eight FFC‐fed female mice had mild steatosis. This increased progressively at week 10 onwards and by week 36, six out of eight female mice had developed severe steatosis. In contrast, male mice developed severe steatosis by 24 weeks of FFC feeding.16 RCD‐fed female mice demonstrated no steatosis for the duration of the study. Ballooning was first noted in FFC‐fed female mice at week 16 and persisted for the duration of the study through week 60 (Fig. 5B). FFC‐fed mice first demonstrated lobular inflammation at 16 weeks, and this also persisted for the duration of the study (Fig. 5C). Male mice showed more severe inflammation than female mice16; at week 24, all FFC‐fed female mice had mild inflammation (grade 1, 100%) while most male mice had moderate inflammation (grade 2; 62.5%, 5/8). No tumor formation was observed in the FFC‐fed female mice over the duration of the feeding study. NAS was computed by summing the scores for steatosis, hepatocyte ballooning, and lobular inflammation. All the FFC‐fed mice had significantly increased NAS compared to RCD‐fed mice at weeks 10, 16, 24, 36, and 60 (Fig. 5D). At week 24, female FFC‐fed mice had intermediate NAS (3 ≤ NAS ≤ 5, borderline NASH; 100%) while most males had already reached a higher NAS of 6 (NAS >5, definite NASH; 62.5%, 5/8).16
Figure 5.
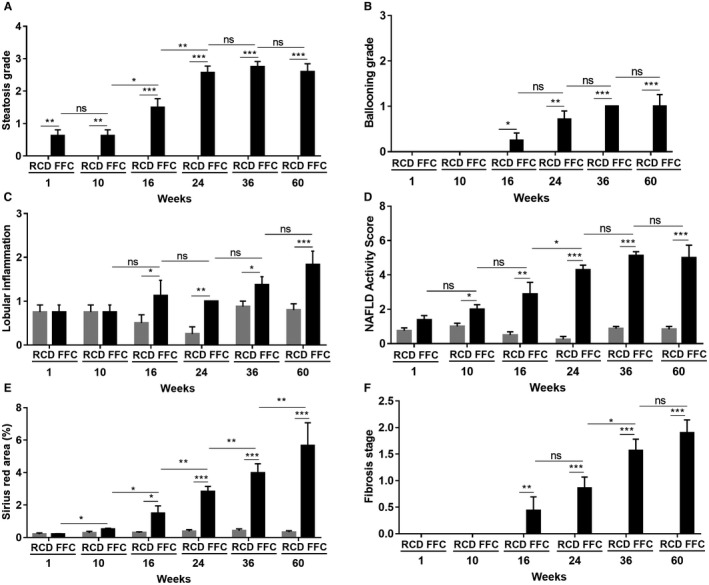
Histologic assessment of NASH in FFC‐fed female mice. (A) FFC‐fed mice showed significant steatosis from week 1 and reached a plateau around grade 3 at week 24, while no RCD‐fed mice developed steatosis (n = 5‐8 per group). (B) FFC‐fed mice demonstrated hepatocyte ballooning from week 16 onwards, while no ballooning was seen in RCD mice at any time (n = 5‐8 per group). (C) FFC‐fed mice developed progressive lobular inflammation with significantly elevated lobular inflammation scores from week 16 onwards (n = 5‐8 per group). (D) All FFC‐fed mice demonstrated significantly increased NAS compared with RCD mice from week 10 (n = 5‐8 per group). (E) The percentage of sirius red‐stained area in FFC‐fed mice was elevated significantly from week 16 compared with RCD mice, for which values remained stable and low at all times (n = 5‐8 per group). (F) FFC‐fed mice demonstrated progressively increased fibrosis from week 16, while no RCD‐fed mice showed fibrosis (n = 5‐8 per group). Data represent mean ± SEM; *P < 0.05, **P < 0.01, ***P < 0.001.
Figure 6.
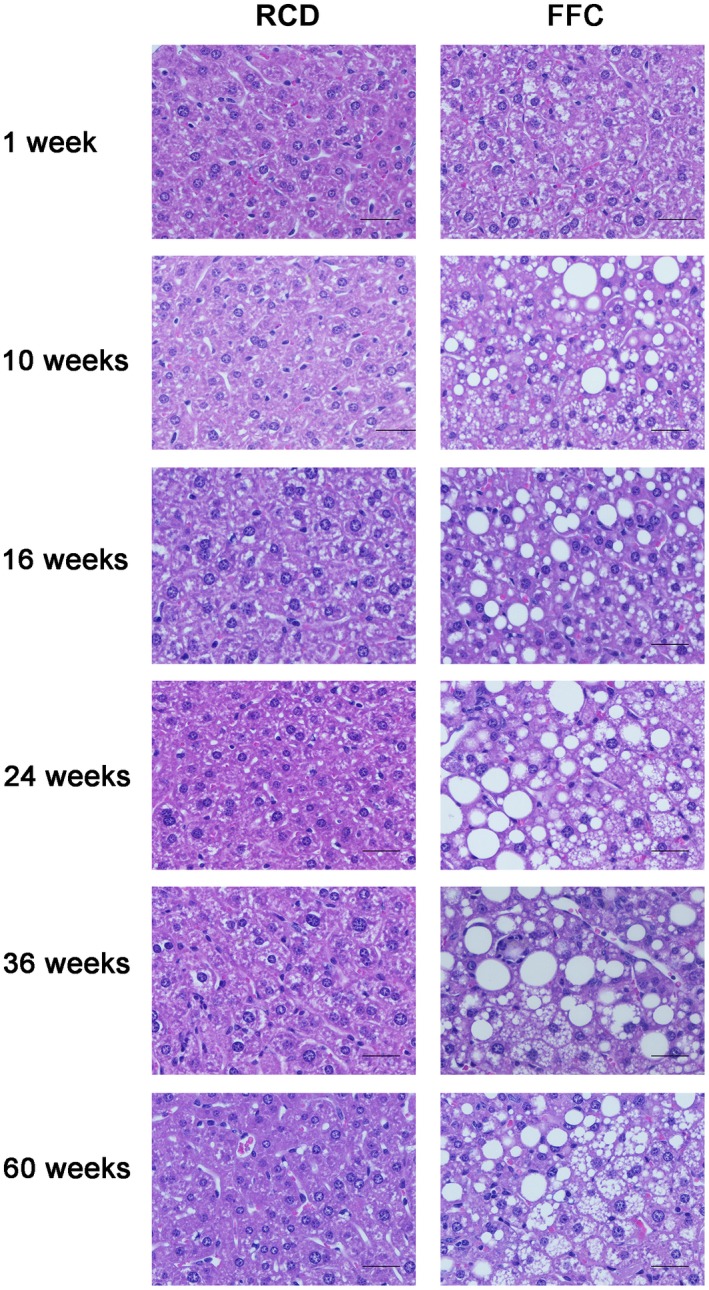
Histologic images of NASH in FFC‐fed female mice. Representative images of hematoxylin and eosin‐stained hepatic sections (both RCD‐fed and FFC‐fed mouse samples at all time points). Original magnification ×20; n = 5‐8 per group. The rapid onset of steatosis was observed in FFC‐fed mice at week 1 (grade 1; 62.5%, 5/8). Steatosis developed progressively afterwards; most FFC‐fed mice showed severe steatosis (grade 3) at week 36 (75%, 6/8) and week 60 (60%, 3/5). FFC‐fed mice demonstrated mild ballooning from week 16 (grade 1; 25%, 2/8); more mice developed mild ballooning afterwards and kept grade 1 ballooning until their endpoint at week 60. No steatosis or ballooning was observed in RCD‐fed mice at any time point.
Sirius red‐stained sections were analyzed for quantitative measurement of fibrosis by image analysis and histologic stage of fibrosis (Figs. 5E,F and 7). The percentage of sirius red‐stained area increased in FFC‐fed female mice; this became significant from week 16 onwards compared with RCD‐fed mice, which did not develop fibrosis over time, and was concordant with the histologic fibrosis stage. In comparison to previously reported FFC‐fed male mice, the onset of fibrosis was slower and the severity was mitigated in female mice. For example, at 36 weeks of feeding, female FFC‐fed mice had mild to moderate fibrosis (1a ≤ fibrosis ≤ 2; 100%) while most males had severe fibrosis (fibrosis >2; 57.1%, 4/7).
Figure 7.
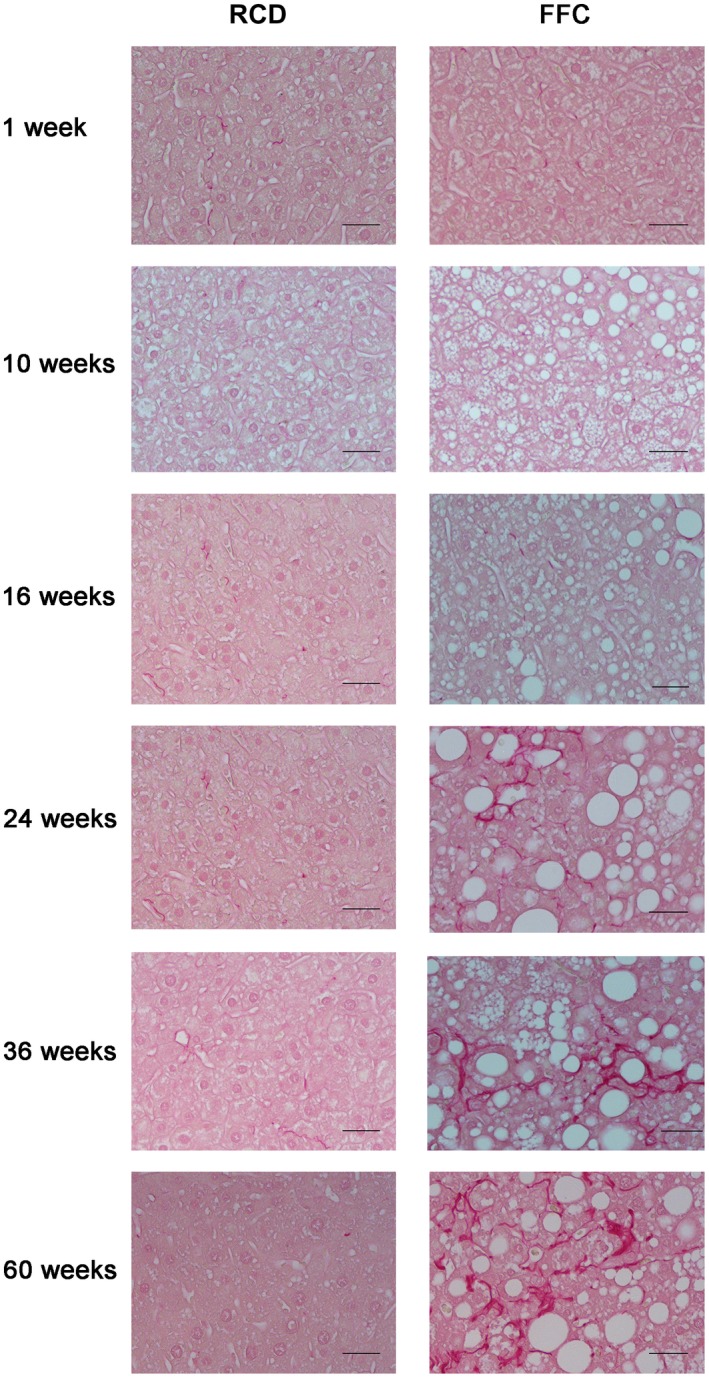
Images of sirius red‐stained livers of FFC‐fed female mice. Representative images of sirius red‐stained hepatic sections (both RCD‐fed and FFC‐fed mouse samples at all time points). Original magnification ×20; n = 5‐8 per group. No fibrosis was seen in RCD‐fed mice at any time point. Most FFC‐fed mice did not show fibrosis until week 16 (fibrosis, 0; 62.5%, 5/8). From week 24 onwards, all FFC‐fed mice demonstrated progressively increased fibrosis. At week 36, all FFC‐fed mice had mild to moderate fibrosis (1a ≤ fibrosis ≤2; 100%) that persisted until the endpoint at week 60 (fibrosis, ≤2; 80%, 4/5).
FAT Fraction and MRE‐Assessed Mechanical Properties
MRI‐measured fat fraction was elevated following 1 week of FFC feeding and continued to increase over time (Fig. 8A). Our previously reported male FFC‐fed cohort16 showed a significantly higher fat fraction at weeks 24 and 36 compared to FFC‐fed female mice (week 24, 33.0% ± 3.3% vs. 22.5% ± 1.7%, P < 0.001, respectively; week 36, 30.1% ± 1.9% vs. 23.0% ± 1.8%, P < 0.001, respectively). Shear stiffness and damping ratio were analyzed as normalized values calculated from absolute value weighted by the mean value of age‐matched controls. The mean shear stiffness in FFC‐fed female mice was higher than RCD‐fed controls (Fig. 8B). In comparison, our published kinetic analysis in FFC‐fed male mice demonstrated an increase in mean shear stiffness at week 16, and this persisted for the duration of the study to week 48 of FFC feeding.16 The damping ratio measurement demonstrated an increasing trend in FFC‐fed female mice up to week 36 of feeding (Fig. 8C). The damping ratio decreased slightly in response to significant fibrosis at week 60 of FFC feeding in female mice. In comparison, we had reported a reduction in damping ratio at weeks 36 and 48 in FFC‐fed male mice.16
Figure 8.
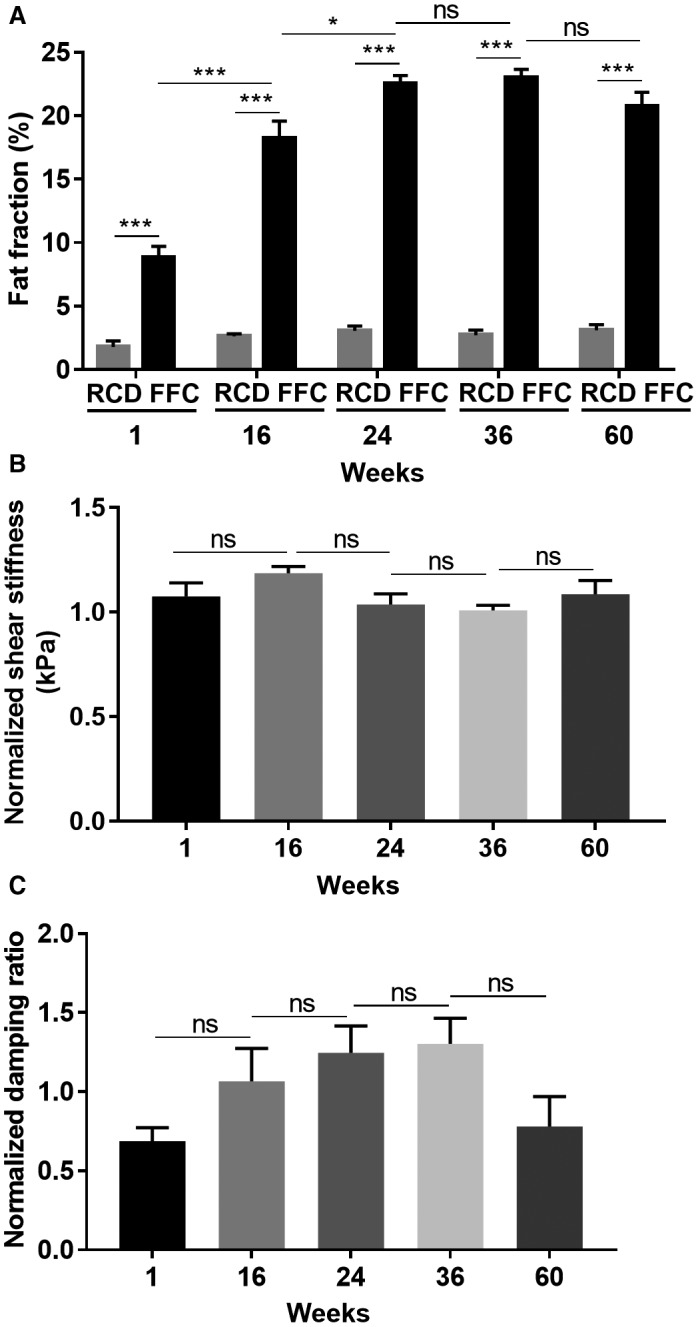
MRI parameters in FFC‐fed female mice. (A) FFC‐fed mice showed significantly elevated fat fraction from week 1 onwards, while the values of RCD‐fed mice were stable and low. (B) Shear stiffness measurements in FFC mice were higher than their RCD‐fed controls at all time points, but the elevation was not statistically significant. (C) Damping ratio measurements demonstrated an increasing trend from week 1 to week 36 and decreased slightly at week 60. Data represent mean ± SEM; n = 4‐8 per group; *P < 0.05, ***P < 0.001.
Discussion
Our objective in this study was to characterize the cellular origin of circulating EVs over time in a dietary NASH model in female and male mice and compare this to the established biomarkers of histology and MRE findings. The principal findings of this study are the following: i) Cellular origin and EV numbers change over time in FFC‐fed female and male mice. Hepatocyte‐derived circulating EVs are increased in FFC‐fed female and male mice at 10 and 12 weeks, respectively, of feeding and continue to increase subsequently. Macrophage‐derived EVs continue to increase in FFC‐fed female and male mice over time. Neutrophil‐derived EVs are increased in female and male mice with age and increase further in FFC‐fed female and male mice at 24 weeks compared to RCD‐fed mice; ii) female mice gain weight and develop NASH, albeit delayed and attenuated in comparison with male mice. With regard to histologic features of NASH, steatosis is attenuated to a lesser degree than inflammation and fibrosis in FFC‐fed female mice; iii) FFC‐fed female mice develop significant steatosis as assessed by MRI; however, shear stiffness remains unchanged and damping ratio does not decrease in contrast to FFC‐fed male mice.
EVs are cell‐derived nanoparticles released into the extracellular milieu by most cell types.31 Not only are EVs regarded as important mediators of local and systemic cell‐to‐cell communication, they also play a role in the pathogenesis of inflammatory and fibrotic responses in the liver.7, 26, 27, 32 Importantly, circulating EVs are emerging as a potential biomarker, or liquid biopsy, for NASH. Although hepatocyte‐derived EVs, platelet‐derived EVs, endothelial cell‐derived EVs, and total circulating EVs have been shown to be elevated in murine models of NASH and human samples of NASH and obesity,7, 26, 33 this is the first report of the kinetic changes in EVs of hepatocyte, macrophage, neutrophil, and platelet origin in a mouse model of NASH. We defined hepatocyte‐derived EVs as the population that expressed either ASGR1 or CYP2E1. We found that hepatocyte‐derived EVs were increased at early time points when the predominant histologic lesion is steatosis and remain elevated with NASH progression over time. Hepatocyte‐derived EVs correlated with ballooning, inflammation, and fibrosis of the liver. The correlation between circulating levels of hepatocyte‐derived EVs and inflammation, NAS, and fibrosis strengthens the rationale for quantifying hepatocyte‐derived EVs to predict severity of NASH and hepatocellular injury.
There is no gold‐standard method for EV isolation.34 Currently used methods vary in EV yield, purity, quality, and labor.35 High throughput polymer‐based methods are fraught with coprecipitated impurities. Differential ultracentrifugation and density gradient centrifugation are laborious, although these methods yield purer EVs at the cost of a lower yield. Furthermore, when compared systematically, EV yield across methods is highly variable.36 We used nanoscale flow cytometry to characterize circulating vesicles as it provides several advantages to other conventional EV isolation methods.37 This modality has high throughput capabilities, is easy to perform, requires minimal sample preparation, and can detect multiple populations of EVs simultaneously in relatively small volumes of plasma.28, 38 It has high sensitivity to detect single EVs across a wide size range. Due to size overlap with chylomicrons, light scatter may not be able to separate chylomicrons from EVs; therefore, mice were killed in the fasted state to minimize contribution from chylomicrons. Conventional flow cytometry has become an accepted tool in clinical diagnostics. An eventual goal of nanoscale flow cytometry is to also apply it to clinical diagnostics. We chose this modality to demonstrate proof‐of‐principle that EVs of different cells of origin can be detected in plasma in a mouse model of NASH.
Cells of the innate immune system, in particular macrophages and neutrophils, are known mediators of the sterile inflammatory response in NASH; therefore, we asked whether these cell types release EVs in our dietary NASH model. We also quantified platelet‐derived EVs as they are known to be physiologically abundant. We found that macrophage‐ and neutrophil‐derived EVs strongly correlated with hepatic steatosis, inflammation, fibrosis, and NAS in FFC‐fed mice. It has been shown that neutrophil‐derived exosomes can induce airway smooth muscle proliferation in asthma and also macrophage inflammatory responses in rheumatoid arthritis39, 40; therefore, they may play a role in NASH. Similarly, adipose tissue macrophage‐derived EVs can influence systemic insulin resistance in obesity.41 Macrophage‐derived EVs can influence anti‐hepatitis C immune responses42 and placental inflammatory responses.43 Adipose tissue expansion and inflammation are a component of obesity‐associated metabolic syndrome in our mouse dietary model and in humans with NASH.15, 44 Adipose tissue‐derived EVs are elevated in diet‐induced obesity mouse models45; therefore, we cannot exclude a contribution from adipocyte‐derived EVs in our model. In our study, we demonstrate that neutrophil‐derived EV levels increased significantly with increasing NAS, and this may contribute to the inflammatory reaction observed in NASH. We also found that NAS correlated with expression level of macrophage‐derived EVs. Altogether, these data suggest that macrophage‐ and neutrophil‐derived EVs may be potential biomarkers to help identify inflammation severity in NASH. These immune cell‐derived EVs could potentially be arising from innate immune cells in the liver, adipose tissue, or other target organs affected in obesity; they may also play a role in liver injury and interorgan crosstalk. We will test these hypotheses in future experiments.
We also noted kinetic and sex‐linked changes in platelet‐derived EVs. In male mice, FFC feeding led to an increase in platelet‐derived EVs as early as 12 weeks. This was in contrast to female FFC‐fed mice in which an elevation in EVs was not observed at 10 weeks; however, at 24 weeks of feeding, platelet‐derived EVs were significantly elevated in RCD‐fed and FFC‐fed female mice, declining at 36 weeks of feeding but still significantly higher than FFC‐ and RCD‐fed male mice. The role of platelet‐derived EVs in NASH and if they are protective in FFC‐fed female mice warrant further exploration. It is possible that the changes in EV cell of origin and number over time in FFC‐fed mice and the sexual dimorphism we observe in EVs play a role in the pathogenesis of the dimorphic NASH phenotype observed in these mice. We will test this hypothesis in future studies.
This is a descriptive study and establishing the particular cargo of each type of EV is beyond the scope of this study. A limitation of our study is that the two sex‐based cohorts, female mice and male mice, were separated in time. This approach of nanoscale flow cytometry will be tested in future simultaneous cohorts of male and female mice. Furthermore, we fed the control mice standard rodent chow rather than a purified control diet, which may impact basal EV numbers. Specific EV cargo can play a role in inflammation as elevated EVs in obesity preferentially package macrophage migration inhibitory factor.33 Thus, it is possible that EV cargo also contributes to sexual dimorphism in diet‐induced NASH models.
Histologically, FFC‐fed female mice demonstrated attenuated NASH in comparison with FFC‐fed male mice, as we previously reported.16 Each individual component of the histologic lesions observed in NASH was slower in onset and lesser in severity in female mice. Recent studies have demonstrated mechanistic insights into the sexual dimorphism observed in dietary obesity models by demonstrating that female mice housed at thermoneutrality develop diet‐induced obesity, fatty liver, and inflammation due to changes in the stress hormone cortisone, immune responses, and changes in the microbiome along with increased intestinal permeability.3 An integrated multi‐omics and phenotypic analysis of approximately 100 mouse strains in the hybrid mouse diversity panel elucidated sex‐specific and tissue‐specific genes that account for sexual dimorphism. We hypothesize that EVs may contribute to sexual dimorphism, although they could be a biomarker of the attenuated NASH phenotype.
MRI and MRE parameters are another emerging biomarker for the noninvasive assessment of mechanical properties of soft tissues. Fat‐fraction measurement was very accurate in the assessment of hepatic steatosis in FFC‐fed female mice, in keeping with its known accuracy.46 In clinical practice, liver elastography is beginning to see widespread use for assessing hepatic fibrosis as an alternative biomarker to biopsy and is recommended in several guidelines for assessment of liver fibrosis following numerous studies demonstrating that elastography parameters are highly accurate in detecting clinically significant fibrosis.47, 48 Elastography‐assessed tissue mechanical responses generally reflect biological composite and matrix structure change of cells and soft tissues. There is a significant sex difference found, with female liver being on average softer than their male counterparts.49, 50 We did not observe any increase in shear stiffness and only a modest trend in damping ratio; this is not surprising due to mild inflammation and fibrosis in FFC‐fed female mice. In our prior studies, we found that the damping ratio or loss modulus increases significantly at early onset of hepatic inflammation, even before histologically detectable cellular lesions, but is not sensitive to the later progressive development of steatosis and fibrosis.16 Notably, the effect of steatosis on liver stiffness remains controversial. In both this study and our prior study, the presence of steatosis did not lead to a significant change in liver stiffness in female mice at 80 Hz. Further studies are needed to determine whether steatosis alone affects liver stiffness and if so whether the effect is frequency dependent.
In conclusion, circulating EVs from hepatocytes, macrophages, neutrophils, and platelets demonstrate kinetic trends in a dietary model of NASH in female and male mice. Hepatocyte‐derived, neutrophil‐derived, and macrophage‐derived EVs strongly correlated with the histologic assessment of NASH and noninvasive MR‐based biomarkers of NASH. Platelet‐derived EVs demonstrated the most sexual dimorphism. These initial findings need further validation and assessment of their biologic relevance in preclinical models and in human plasma samples.
Supporting information
Acknowledgment
We thank Diane M. Sauter, Philip J. Rossman, and Thomas C. Hulshizer for their excellent technical assistance.
Supported by the National Institutes of Health (grants EB017197 to M.Y. and DK111378 to H.M.), the Mayo Foundation (to H.M.), and by a postdoctoral fellowship from the Fonds de Recherche du Quebec‐Sante (to F.L.).
Present address for Abagail Raiter is University of Minnesota, Minneapolis, MN.
Present address for Harikrishna Bandla is CARES, New Brunswick, NJ.
Potential conflict of interest: Dr. Glaser owns stock in, owns intellectual property rights in, and received grants from Resoundant. Dr. Yin has intellectual property and a financial interest related to this research. The other authors have nothing to report.
Contributor Information
Meng Yin, Email: yin.meng@mayo.edu.
Harmeet Malhi, Email: malhi.harmeet@mayo.edu.
References
Author names in bold designate shared co‐first authorship.
- 1. Younossi Z, Anstee QM, Marietti M, Hardy T, Henry L, Eslam M, et al. Global burden of NAFLD and NASH: trends, predictions, risk factors and prevention. Nat Rev Gastroenterol Hepatol 2018;15:11‐20. [DOI] [PubMed] [Google Scholar]
- 2. Greuter T, Malhi H, Gores GJ, Shah VH. Therapeutic opportunities for alcoholic steatohepatitis and nonalcoholic steatohepatitis: exploiting similarities and differences in pathogenesis. JCI. Insight 2017;2:pii:95354. [DOI] [PMC free article] [PubMed] [Google Scholar]
- 3. Giles DA, Moreno‐Fernandez ME, Stankiewicz TE, Graspeuntner S, Cappelletti M, Wu D, et al. Thermoneutral housing exacerbates nonalcoholic fatty liver disease in mice and allows for sex‐independent disease modeling. Nat Med 2017;23:829‐838. Erratum in: Nat Med 2017;23:1241. [DOI] [PMC free article] [PubMed] [Google Scholar]
- 4. Lonardo A, Nascimbeni F, Ballestri S, Fairweather D, Win S, Than TA, et al. Sex differences in NAFLD: state of the art and identification of research gaps. Hepatology 2019. 10.1002/hep.30626 [DOI] [PMC free article] [PubMed] [Google Scholar]
- 5. Hirsova P, Ibrahim SH, Verma VK, Morton LA, Shah VH, LaRusso NF, et al. Extracellular vesicles in liver pathobiology: small particles with big impact. Hepatology 2016;64:2219‐2233. [DOI] [PMC free article] [PubMed] [Google Scholar]
- 6. Szabo G, Momen‐Heravi F. Extracellular vesicles in liver disease and potential as biomarkers and therapeutic targets. Nat Rev Gastroenterol Hepatol 2017;14:455‐466. [DOI] [PMC free article] [PubMed] [Google Scholar]
- 7. Kakazu E, Mauer AS, Yin M, Malhi H. Hepatocytes release ceramide‐enriched pro‐inflammatory extracellular vesicles in an IRE1alpha‐dependent manner. J Lipid Res 2016;57:233‐245. [DOI] [PMC free article] [PubMed] [Google Scholar]
- 8. Hundertmark J, Krenkel O, Tacke F. Adapted immune responses of myeloid‐derived cells in fatty liver disease. Front Immunol 2018;9:2418. [DOI] [PMC free article] [PubMed] [Google Scholar]
- 9. van der Windt DJ, Sud V, Zhang H, Varley PR, Goswami J, Yazdani HO, et al. Neutrophil extracellular traps promote inflammation and development of hepatocellular carcinoma in nonalcoholic steatohepatitis. Hepatology 2018;68:1347‐1360. [DOI] [PMC free article] [PubMed] [Google Scholar]
- 10. Summart U, Thinkhamrop B, Chamadol N, Khuntikeo N, Songthamwat M, Kim CS. Gender differences in the prevalence of nonalcoholic fatty liver disease in the northeast of Thailand: a population‐based cross‐sectional study. Version 2. F1000Res 2017;6:1630. [DOI] [PMC free article] [PubMed] [Google Scholar]
- 11. Ballestri S, Nascimbeni F, Baldelli E, Marrazzo A, Romagnoli D, Lonardo A. NAFLD as a sexual dimorphic disease: role of gender and reproductive status in the development and progression of nonalcoholic fatty liver disease and inherent cardiovascular risk. Adv Ther 2017;34:1291‐1326. [DOI] [PMC free article] [PubMed] [Google Scholar]
- 12. Yang Y, Smith DL Jr, Keating KD, Allison DB, Nagy TR. Variations in body weight, food intake and body composition after long‐term high‐fat diet feeding in C57BL/6J mice. Obesity (Silver Spring) 2014;22:2147‐2155. [DOI] [PMC free article] [PubMed] [Google Scholar]
- 13. Kim HC, Nam CM, Jee SH, Han KH, Oh DK, Suh I. Normal serum aminotransferase concentration and risk of mortality from liver diseases: prospective cohort study. BMJ 2004;328:983. [DOI] [PMC free article] [PubMed] [Google Scholar]
- 14. Devaux Y, Salgado‐Somoza A, Dankiewicz J, Boileau A, Stammet P, Schritz A, et al.; TTM‐trial investigators . Incremental value of circulating MiR‐122‐5p to predict outcome after out of hospital cardiac arrest. Theranostics 2017;7:2555‐2564. [DOI] [PMC free article] [PubMed] [Google Scholar]
- 15. Idrissova L, Malhi H, Werneburg NW, LeBrasseur NK, Bronk SF, Fingas C, et al. TRAIL receptor deletion in mice suppresses the inflammation of nutrient excess. J Hepatol 2015;62:1156‐1163. [DOI] [PMC free article] [PubMed] [Google Scholar]
- 16. Yin M, Glaser KJ, Manduca A, Mounajjed T, Malhi H, Simonetto DA, et al. Distinguishing between hepatic inflammation and fibrosis with MR elastography. Radiology 2017;284:694‐705. [DOI] [PMC free article] [PubMed] [Google Scholar]
- 17. Rank A, Nieuwland R, Kohler A, Franz C, Waidhauser J, Toth B. Human bone marrow contains high levels of extracellular vesicles with a tissue‐specific subtype distribution. PLoS One 2018;13:e0207950. [DOI] [PMC free article] [PubMed] [Google Scholar]
- 18. Dong S, Hughes RC. Macrophage surface glycoproteins binding to galectin‐3 (Mac‐2‐antigen). Glycoconj J 1997;14:267‐274. [DOI] [PubMed] [Google Scholar]
- 19. Hestdal K, Ruscetti FW, Ihle JN, Jacobsen SE, Dubois CM, Kopp WC, et al. Characterization and regulation of RB6‐8C5 antigen expression on murine bone marrow cells. J Immunol 1991;147:22‐28. [PubMed] [Google Scholar]
- 20. D'Souza AA, Devarajan PV. Asialoglycoprotein receptor mediated hepatocyte targeting ‐ strategies and applications. J Control Release 2015;203:126‐139. [DOI] [PubMed] [Google Scholar]
- 21. Fagerberg L, Hallstrom BM, Oksvold P, Kampf C, Djureinovic D, Odeberg J, et al. Analysis of the human tissue‐specific expression by genome‐wide integration of transcriptomics and antibody‐based proteomics. Mol Cell Proteomics 2014;13:397‐406. [DOI] [PMC free article] [PubMed] [Google Scholar]
- 22. Stockert RJ. The asialoglycoprotein receptor: relationships between structure, function, and expression. Physiol Rev 1995;75:591‐609. [DOI] [PubMed] [Google Scholar]
- 23. Loeper J, Descatoire V, Maurice M, Beaune P, Belghiti J, Houssin D, et al. Cytochromes P‐450 in human hepatocyte plasma membrane: recognition by several autoantibodies. Gastroenterology 1993;104:203‐216. [DOI] [PubMed] [Google Scholar]
- 24. Loeper J, Descatoire V, Maurice M, Beaune P, Feldmann G, Larrey D, et al. Presence of functional cytochrome P‐450 on isolated rat hepatocyte plasma membrane. Hepatology 1990;11:850‐858. [DOI] [PubMed] [Google Scholar]
- 25. Wu D, Cederbaum AI. Presence of functionally active cytochrome P‐450IIE1 in the plasma membrane of rat hepatocytes. Hepatology 1992;15:515‐524. [DOI] [PubMed] [Google Scholar]
- 26. Povero D, Eguchi A, Li H, Johnson CD, Papouchado BG, Wree A, et al. Circulating extracellular vesicles with specific proteome and liver microRNAs are potential biomarkers for liver injury in experimental fatty liver disease. PLoS One 2014;9:e113651. [DOI] [PMC free article] [PubMed] [Google Scholar]
- 27. Povero D, Panera N, Eguchi A, Johnson CD, Papouchado BG, de Araujo HL, et al. Lipid‐induced hepatocyte‐derived extracellular vesicles regulate hepatic stellate cell via microRNAs targeting PPAR‐gamma. Cell Mol Gastroenterol Hepatol 2015;1:646‐663.e644. [DOI] [PMC free article] [PubMed] [Google Scholar]
- 28. Gomes J, Lucien F, Cooper TT, Kim Y, Williams KC, Liao X, et al. Analytical considerations in nanoscale flow cytometry of extracellular vesicles to achieve data linearity. Thromb Haemost 2018;118:1612‐1624. [DOI] [PubMed] [Google Scholar]
- 29. Kleiner DE, Brunt EM, Van Natta M, Behling C, Contos MJ, Cummings OW, et al.; Nonalcoholic Steatohepatitis Clinical Research Network . Design and validation of a histological scoring system for nonalcoholic fatty liver disease. Hepatology 2005;41:1313‐1321. [DOI] [PubMed] [Google Scholar]
- 30. Malhi H, Kropp EM, Clavo VF, Kobrossi CR, Han J, Mauer AS, et al. C/EBP homologous protein‐induced macrophage apoptosis protects mice from steatohepatitis. J Biol Chem 2013;288:18624‐18642. [DOI] [PMC free article] [PubMed] [Google Scholar]
- 31. Hirsova P, Ibrahim SH, Gores GJ, Malhi H. Lipotoxic lethal and sublethal stress signaling in hepatocytes: relevance to NASH pathogenesis. J Lipid Res 2016;57:1758‐1770. Erratum in: J Lipid Res 2017;58:299. [DOI] [PMC free article] [PubMed] [Google Scholar]
- 32. Liao CY, Song MJ, Gao Y, Mauer AS, Revzin A, Malhi H. Hepatocyte‐derived lipotoxic extracellular vesicle sphingosine 1‐phosphate induces macrophage chemotaxis. Front Immunol 2018;9:2980. [DOI] [PMC free article] [PubMed] [Google Scholar]
- 33. Amosse J, Durcin M, Malloci M, Vergori L, Fleury A, Gagnadoux F, et al. Phenotyping of circulating extracellular vesicles (EVs) in obesity identifies large EVs as functional conveyors of macrophage migration inhibitory factor. Mol Metab 2018;18:134‐142. [DOI] [PMC free article] [PubMed] [Google Scholar]
- 34. Konoshenko MY, Lekchnov EA, Vlassov AV, Laktionov PP. Isolation of extracellular vesicles: general methodologies and latest trends. Biomed Res Int 2018;2018:8545347. [DOI] [PMC free article] [PubMed] [Google Scholar]
- 35. Xu R, Greening DW, Zhu HJ, Takahashi N, Simpson RJ. Extracellular vesicle isolation and characterization: toward clinical application. J Clin Invest 2016;126:1152‐1162. [DOI] [PMC free article] [PubMed] [Google Scholar]
- 36. Xu R, Simpson RJ, Greening DW. A protocol for isolation and proteomic characterization of distinct extracellular vesicle subtypes by sequential centrifugal ultrafiltration. Methods Mol Biol 2017;1545:91‐116. [DOI] [PubMed] [Google Scholar]
- 37. Welsh JA, Holloway JA, Wilkinson JS, Englyst NA. Extracellular vesicle flow cytometry analysis and standardization. Front Cell Dev Biol 2017;5:78. [DOI] [PMC free article] [PubMed] [Google Scholar]
- 38. Kibria G, Ramos EK, Lee KE, Bedoyan S, Huang S, Samaeekia R, et al. A rapid, automated surface protein profiling of single circulating exosomes in human blood. Sci Rep 2016;6:36502. [DOI] [PMC free article] [PubMed] [Google Scholar]
- 39. Vargas A, Roux‐Dalvai F, Droit A, Lavoie JP. Neutrophil‐derived exosomes: a new mechanism contributing to airway smooth muscle remodeling. Am J Respir Cell Mol Biol 2016;55:450‐461. [DOI] [PubMed] [Google Scholar]
- 40. Rhys HI, Dell'Accio F, Pitzalis C, Moore A, Norling LV, Perretti M. Neutrophil microvesicles from healthy control and rheumatoid arthritis patients prevent the inflammatory activation of macrophages. EBioMedicine 2018;29:60‐69. [DOI] [PMC free article] [PubMed] [Google Scholar]
- 41. Ying W, Riopel M, Bandyopadhyay G, Dong Y, Birmingham A, Seo JB, et al. Adipose tissue macrophage‐derived exosomal miRNAs can modulate in vivo and in vitro insulin sensitivity. Cell 2017;171:372‐384.e312. [DOI] [PubMed] [Google Scholar]
- 42. Cai C, Koch B, Morikawa K, Suda G, Sakamoto N, Rueschenbaum S, et al. Macrophage‐derived extracellular vesicles induce long‐lasting immunity against hepatitis C virus which is blunted by polyunsaturated fatty acids. Front Immunol 2018;9:723. [DOI] [PMC free article] [PubMed] [Google Scholar]
- 43. Rice TF, Donaldson B, Bouqueau M, Kampmann B, Holder B. Macrophage‐ but not monocyte‐derived extracellular vesicles induce placental pro‐inflammatory responses. Placenta 2018;69:92‐95. [DOI] [PMC free article] [PubMed] [Google Scholar]
- 44. Mehta R, Neupane A, Wang L, Goodman Z, Baranova A, Younossi ZM. Expression of NALPs in adipose and the fibrotic progression of non‐alcoholic fatty liver disease in obese subjects. BMC Gastroenterol 2014;14:208. [DOI] [PMC free article] [PubMed] [Google Scholar]
- 45. Eguchi A, Lazic M, Armando AM, Phillips SA, Katebian R, Maraka S, et al. Circulating adipocyte‐derived extracellular vesicles are novel markers of metabolic stress. J Mol Med (Berl) 2016;94:1241‐1253. [DOI] [PMC free article] [PubMed] [Google Scholar]
- 46. Reeder SB, Cruite I, Hamilton G, Sirlin CB. Quantitative assessment of liver fat with magnetic resonance imaging and spectroscopy. J Magn Reson Imaging 2011;34:729‐749. [DOI] [PMC free article] [PubMed] [Google Scholar]
- 47. Tang A, Cloutier G, Szeverenyi NM, Sirlin CB. Ultrasound elastography and MR elastography for assessing liver fibrosis: part 2, diagnostic performance, confounders, and future directions. AJR Am J Roentgenol 2015;205:33‐40. [DOI] [PMC free article] [PubMed] [Google Scholar]
- 48. Tang A, Cloutier G, Szeverenyi NM, Sirlin CB. Ultrasound elastography and MR elastography for assessing liver fibrosis: part 1, principles and techniques. AJR Am J Roentgenol 2015;205:22‐32. [DOI] [PMC free article] [PubMed] [Google Scholar]
- 49. Corpechot C, El Naggar A, Poupon R. Gender and liver: is the liver stiffness weaker in weaker sex? Hepatology 2006;44:513‐514. [DOI] [PubMed] [Google Scholar]
- 50. Roulot D, Czernichow S, Le Clesiau H, Costes JL, Vergnaud AC, Beaugrand M. Liver stiffness values in apparently healthy subjects: influence of gender and metabolic syndrome. J Hepatol 2008;48:606‐613. [DOI] [PubMed] [Google Scholar]
Associated Data
This section collects any data citations, data availability statements, or supplementary materials included in this article.
Supplementary Materials


