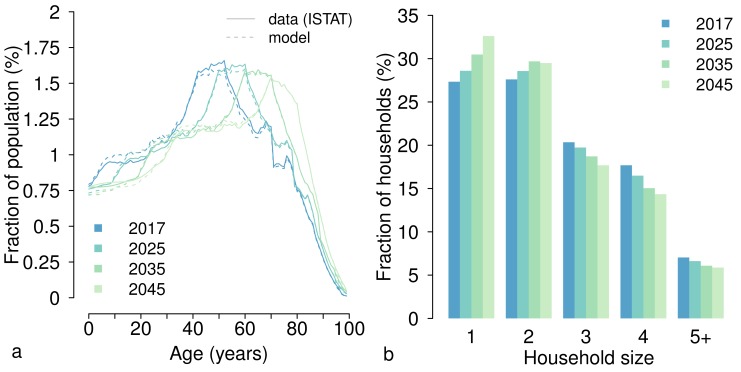
Appendix 1—figure 3. Age distribution of the Italian population and household size over the period 2017–2045.
(a) Age distribution of the Italian population in different years as estimated by the model (dotted lines) and according to the median demographic projections provided by the Italian National Institute of Statistics (Supplementary file 1) (Italian National Institute of Statistics, 2018). (b) Fraction of households by size (%) as obtained by the model for different years.

