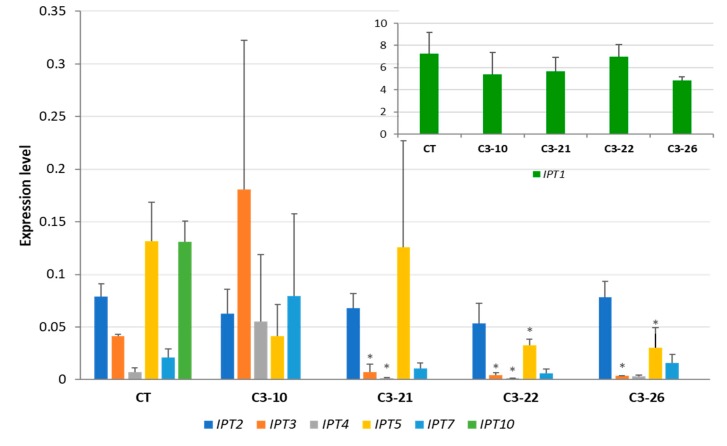
Figure 8.
Expression levels of HvIPT genes in 10-day-old roots of ckx3 mutant lines; the expression of HvIPT1 was shown on a separate graph because of the higher expression level. CT, control plants; values are mean ± SD (Table S9) * significantly different from control at p < 0.05. The expression levels were calculated from three technical replicates according to the standard curve methods using the Elongation factor 2 gene as a normalizer. The analysis was performed for three biological replicates.

