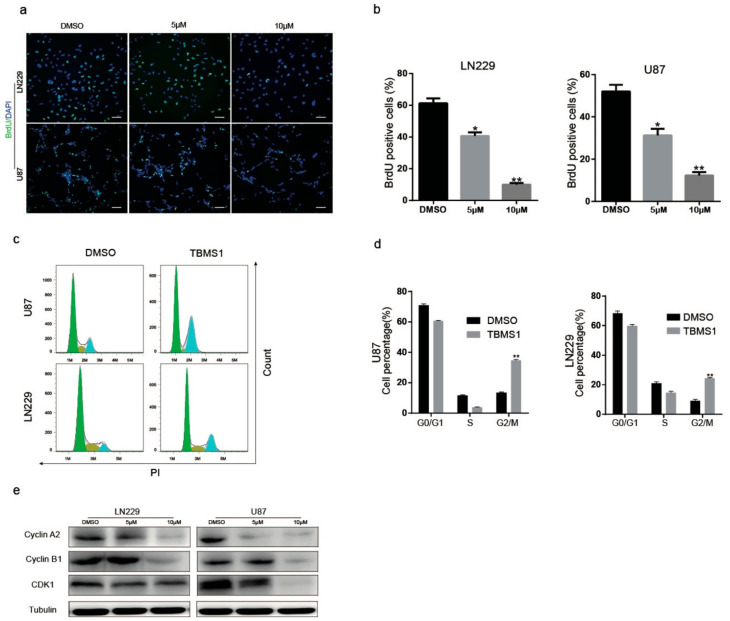
Figure 2.
TBMS1 causes glioblastoma cells cell cycle arrest at G2 phase. (a) Changes in the number of BrdU-positive cells in LN229 and U87 cells treated with different concentrations of TBMS1 for 48 h. DMSO was added as a control, scale bar was 200 μm. (b) A statistical plot of the BrdU positive cell rate in panel (a). (c) Cell cycle detection of LN229 and U87 cells supplemented with DMSO or TMBS1 was performed by flow cytometry. (d) The graph of the percentage of the results of each cycle of the cells is statistically plotted in the graph (c). (e) The protein expression levels of CDK1, Cyclin A2, Cyclin B1 and Tubulin in LN229 and U87 cells treated with different concentrations of TBMS1 for 48 h. DMSO was added as a control. * p < 0.05, ** p < 0.01, *** p < 0.001, p-values < 0.05 were considered as statistically significant

