. 2019 Sep 3;8:e46007. doi: 10.7554/eLife.46007

Figure 3. Mir-204 function is required for lymphatic development.

(a) Schematic of CRISPR/Cas9 and guide RNA targeting of mir-204–1. (b) Sequence alignment of wildtype and mir-204–1 mutant genomic DNA. The mature mir-204 sequence is noted in magenta, and the PAM sequence is highlighted in red (on the reverse strand). The mutant carries 22 bp deletion that removes 17 nucleotides of the mature mir-204 sequence. (c–g) Representative confocal images of the mid-trunk of 5 dpf wild type sibling (c), mir-204–1-/- mutant (d), MO2-injected mir-204–1-/- mutant (e), MO3-injected mir-204–1-/- mutant (f), and MO2 + MO3 co-injected mir-204–1-/- mutant (g) animals. Images are lateral views of Tg(mrc1a:eGFP)y251, Tg(kdrl:mCherry)y171 double-transgenic animals, rostral to the left. The thoracic duct is labeled with white arrows, and absence of the thoracic duct is noted with asterisks. (h) Quantification of thoracic duct formation in five dpf wild type (n = 6), mir-204–1-/- mutant (n = 9), MO2-injected mir-204–1-/- mutant (n = 23), MO2-injected mir-204–1-/- mutant (n = 19), and MO2 + MO3 co-injected mir-204–1-/- mutant animals (n = 25). The number of somitic segments with an intact thoracic duct was counted, with the same seven mid-trunk somites measured in each animal. Scale bar: 100 μm (c). All graphs are analyzed by t-test and the mean ± SD is shown.

Figure 3—source data 1. Numerical data for Figure 3 and Figure 3—figure supplement 1 and Figure 3—figure supplement 2.
DOI: 10.7554/eLife.46007.015

Figure 3.

Figure 3—figure supplement 1. Lymphatic differentiation defects in mir-204-deficient animals.

Figure 3—figure supplement 1.

(a) Quantitative TaqMan RT-PCR measurement of the relative levels of mature mir-204 in one dpf mir-204–1-/- mutants and wildtype siblings, normalized to wild type levels. (b,c) Confocal images of 2 dpf Tg(mrc1a:eGFP)y251, Tg(kdrl:mCherry)y171 mir-204–1-/- mutant (c) or MO2-injected mir-204–1-/- mutant (d) animals. (d) Quantitation of the number of PL sprouts in animals as in panels b and c. Scale bar: 100 μm (b). All graphs are analyzed by t-test and the mean ± SD is shown.
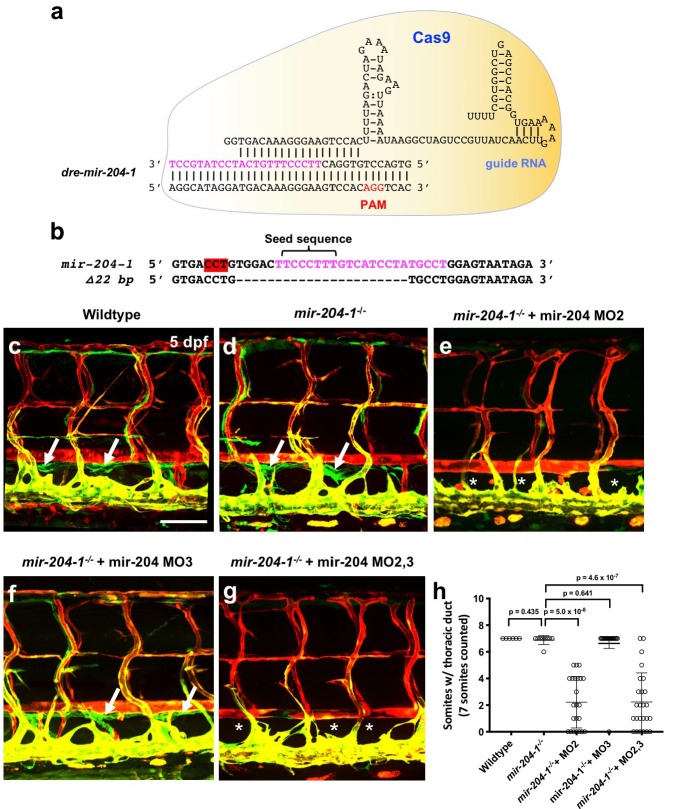
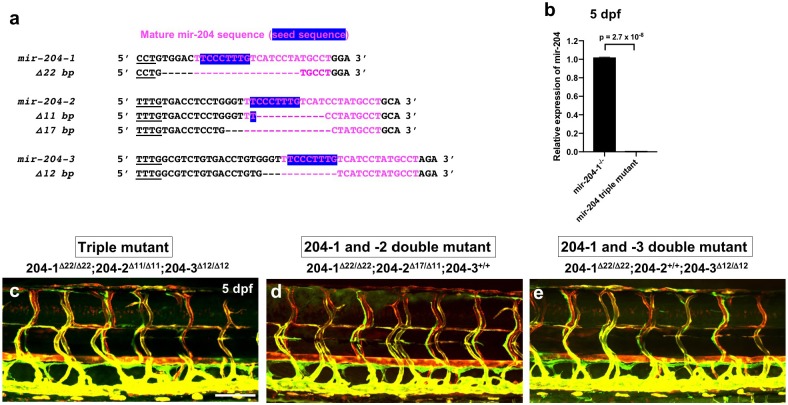
Figure 3—figure supplement 2. MicroRNA 204 mutants.

Figure 3—figure supplement 2.

(a) Sequence alignment of mir-204–1, −2, and −3 wildtype and deletion mutant. The mature mir-204 sequence are noted with magenta lettering and the seed sequence is highlighted in blue. (b) Quantitative TaqMan RT-PCR measurement of the relative levels of mature mir-204 in five dpf mir-204 triple mutants and their mir-204–1-/- siblings, normalized to mir-204–1-/- mutants. Three biological replicates were analyzed. (c–e) Confocal image of 5 dpf Tg(mrc1a:eGFP)y251, Tg(kdrl:mCherry)y171 mir-204 triple mutant (c), mir-204–1 and −2 double mutant (d), and mir-204–1 and −3 double mutant (e) animals. All images are lateral views, rostral to the left. Scale bar: 100 μm (c). All graphs are analyzed by t-test and the mean ± SD is shown.