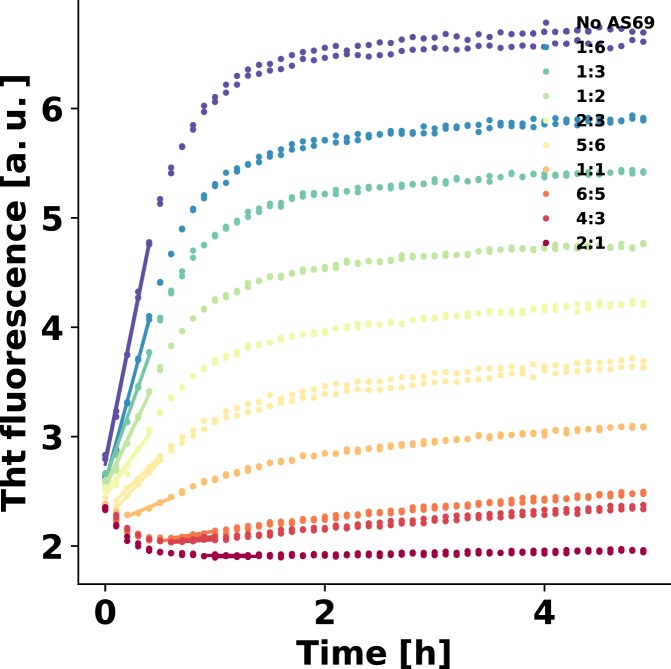
Appendix 1—figure 1. Linear fitting of the early times of strongly seeded aggregation kinetics.
Solid lines show the fits. These data were used to produce the plot in Figure 4c. At the highest inhibitor concentrations, the rates were so low that the temperature increase upon introduction of the plate into the platereader led to an initial decrease in fluorescence intensity. Therefore, the data was fitted once the fluorescence intensity had started to increase.

