

Abstract
Chromatin architecture has been implicated in cell-type-specific gene regulatory programs; yet, how chromatin remodels during development remains to be fully elucidated. Here, by interrogating chromatin reorganization during human pluripotent stem cell (PSC) differentiation, we discover a role for the primate-specific endogenous retrotransposon HERV-H in creating topologically associating domains (TAD) in human PSCs. Deleting these HERV-H elements eliminates their corresponding TAD boundaries and reduces transcription of upstream genes, while de novo insertion of HERV-Hs can introduce new TAD boundaries. HERV-H’s ability to create these TAD boundaries depends on high transcription, as transcriptional repression of HERV-H elements prevents formation of these boundaries. This ability is not limited to human PSCs, as these actively transcribed HERV-Hs and their corresponding TAD boundaries also appear in PSCs from other hominids but not in more distantly related species lacking HERV-Hs. Overall, our results provide direct evidence for retrotransposons in actively shaping cell-type- and species-specific chromatin architecture.
Introduction
The three-dimensional organization of chromosomes enables long-range interactions between enhancers and promoters that are critical for building complex gene regulatory networks in multicellular species1,2. In somatic cells, interphase chromosomes occupy separate nuclear spaces known as chromosome territories3. Each chromosome is organized into a dynamic but non-random hierarchical structure characterized by stretches of transcriptionally active, megabase-long compartments that are interspersed with stretches of transcriptionally inactive compartments4. These compartments can be further partitioned into topologically associating domains (TADs), which exhibit high levels of intra-domain interactions and relatively low levels of inter-domain interactions5–7. TAD boundaries are generally conserved between cell types and closely related species5,8, and can restrict cis-regulatory element interactions with target promoters9. At or within TAD boundaries, long-range chromatin loops are frequently observed to link regulatory elements, including binding sites for the CCCTC-binding factor (CTCF), promoters and enhancers10,11. Thus, disrupting TADs can lead to failure of proper restructuring of chromatin and subsequent changes of transcriptional landscape that may eventually lead to disease12–15.
There is mounting evidence that a large fraction of TADs are shaped by CTCF, which occupies a majority of the TAD boundaries, and by the cohesin complex that generally colocalizes with CTCF16–20. The evolution and turnover of CTCF binding sites have been suggested to underlie the evolution of genome architecture in different species21, since a subset of species-specific CTCF binding sequences are rapidly dispersed by transposable elements, in particular SINE elements22. However, how much transposable elements play a role in shaping the genome architecture during evolution has yet to be directly tested, particularly in primates.
Genome architecture is not only reshaped during evolution, but also reconfigured in a cell-type-specific manner during differentiation and somatic cell reprogramming8,23–26. By interrogating the dynamic remodeling of chromatin architecture during human cardiomyocyte differentiation, we discover a class of primate-specific endogenous retrotransposons, human endogenous retrovirus subfamily H (HERV-H), which is involved in establishing TAD boundaries in hPSCs. Deletion of these HERV-H elements eliminates corresponding TAD boundaries, while de novo insertion of HERV-Hs can introduce new chromatin domain boundaries in human PSCs. These TAD boundaries are furthermore highly dependent on HERV-H transcription, as transcriptional silencing of HERV-Hs during hPSC differentiation or by genetic manipulation weakens or eliminates the insulation of TAD boundaries. Finally, comparative analysis of chromatin architecture in primate and non-primate species supports a role for actively transcribed HERV-Hs in demarcating primarily hominid PSC-specific TADs. Overall, our results provide direct evidence for retrotransposon elements in actively shaping chromatin architecture in specific cell types during evolution.
Results
Chromatin architecture undergoes reorganization during differentiation
To characterize the dynamics of genome organization during differentiation, we utilized a transgenic human embryonic stem cell (hESC) H9 MYL2:H2B-GFP ventricular cardiomyocyte reporter line, which can be differentiated into ventricular cardiomyocytes in a highly synchronized fashion27 (Supplementary Fig. 1a). We generated and collected samples in biological duplicates at six critical time points of cardiomyocyte differentiation: hESCs (Day 0), mesodermal cells (Day 2), cardiac mesodermal cells (Day 5), cardiac progenitors (Day 7), primitive cardiomyocytes (Day 15) and ventricular cardiomyocytes (Day 80) (Fig. 1a). Flow cytometry confirmed that differentiation efficiency for D2 – D15 time point samples was at least ~80-90%, and MYL2:H2B-GFP+ ventricular cardiomyocytes were sorted at day 80 (Supplementary Fig. 1b). We performed in situ Hi-C4 experiments, and obtained on average three billion raw read pairs and one billion unique long-range cis contacts (minimum distance 10 kb, Supplementary Table 1) for each time point. Close correlation of Hi-C maps between biological replicates verified that these maps were highly reproducible at multiple scales (Supplementary Fig. 2a–d). Complementing these Hi-C contact maps, ChIP-seq and RNA-seq experiments were performed on these samples to identify CTCF and H3K27ac occupancy sites, and profile transcriptomes, respectively (Supplementary Fig. 2e–i).
Figure 1. Reorganization of TADs during human cardiomyocyte differentiation.
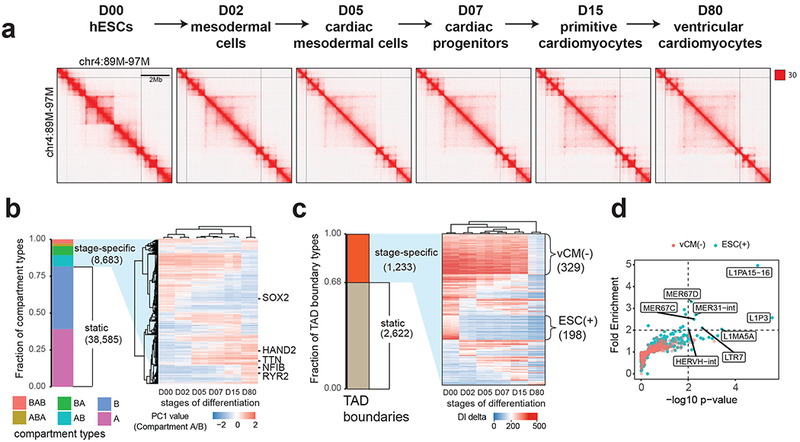
(a) Hi-C contact matrices for each stage of cardiomyocyte differentiation at mega-base resolution. (b) A heatmap showing hierarchical clustering of dynamic chromatin compartments during cardiomyocyte differentiation. The pseudo-color reflects the PC1 values (compartment A/B) of compartment bins. Negative PC1 value stands for compartment B and positive for compartment A. Representative genes located in corresponding compartment bins are annotated to the right of the heatmap. (c) A heatmap showing the DI delta scores for the stage-specific TAD boundaries, ordered by the presence of TADs at six stages. vCM(−) stands for TAD boundaries lost in purified ventricular cardiomyocytes at D80, ESC(+) stands for hESC-specific TAD boundaries. (d) Scatter plot shows the fold enrichment and −log10(P values) for various repeat element classes at ESC(+) (N = 198) and vCM(−) (N = 329) TAD boundaries relative to the static TAD boundaries (N = 2,622). P values are from two-sided proportion test.
Analyses of these Hi-C datasets showed extensive reorganization of chromatin architecture during hESC differentiation (Fig. 1a). Across the entire genome, the abundance of short-range chromatin interactions decreased while the number of long-range chromatin interactions (above 500 kb) increased (Supplementary Fig. 3a). Identification of active (A) and inactive (B) compartments at all stages showed that 81.6% of the genome maintained the same compartment state throughout cardiomyocyte differentiation (Fig. 1b). Among the 18.4% of the genome that switched compartments, a similar proportion of the genome switched from A to B and from B to A at each stage transition (Supplementary Fig. 3b), and the majority (73%) only switched once, suggesting linear nuclear architectural changes during lineage commitment (Fig. 1b). Hierarchical clustering of genomic bins that switched compartments showed stage specific dynamics (Fig. 1b), which positively correlated with gene expression (Supplementary Fig. 3c,d) as reported previously8.
Consistent with recent reports describing loss of TADs during ESC differentiation23,28, we also observed that the number of TADs decreased as hESCs differentiated into ventricular cardiomyocytes using multiple TAD-calling algorithms5,10,29 (Supplementary Fig. 4a, b, c). Clustering of stage-specific TAD boundaries using differential Directionality Index (DI) scores, which estimate the strength of the TAD boundaries, further showed that the majority of stage-specific TAD boundaries were lost or weakened during differentiation and the effect was most pronounced at early mesoderm specification (D0-D2), and ventricular cardiomyocyte differentiation/maturation (D15-D80) (Fig. 1c).
HERV-H silencing is associated with loss of TAD boundaries during differentiation
To investigate the mechanism of TAD boundary turnover, we examined the sequence features of TAD boundaries that were lost in the course of differentiation with a particular focus on D0 hESC-specific TAD boundaries [ESC(+)] and the boundaries lost during D15-D80 ventricular cardiomyocyte transition [vCM(−)] (Supplementary Table 2). While CTCF has been shown to play a critical role in defining TAD boundaries5,10,20, we observed no significant difference in CTCF occupancy across all stages examined at ESC(+), vCM(−) and stable TAD boundaries (Supplementary Fig. 4d). Thus, we explored whether other potential mechanisms might be involved in the formation of these TAD boundaries. Interestingly, we discovered that eight classes of repeat elements were over-represented specifically at ESC(+) TAD boundaries when compared to stable TAD boundaries (P value < 0.01 and fold change > 2), whereas no enrichment of these repeats was observed in vCM(−) TAD boundaries (Fig. 1d). Additionally, the ESC(+) TAD boundaries were associated with hESC-specific H3K27ac signal and mRNA transcription (Supplementary Fig. 4e, f), which was particularly enriched for HERV-H transcription (Fig. 2a and Supplementary Fig. 5a).
Figure 2. Transcriptionally active HERV-H forms human ESC-specific TAD boundaries.
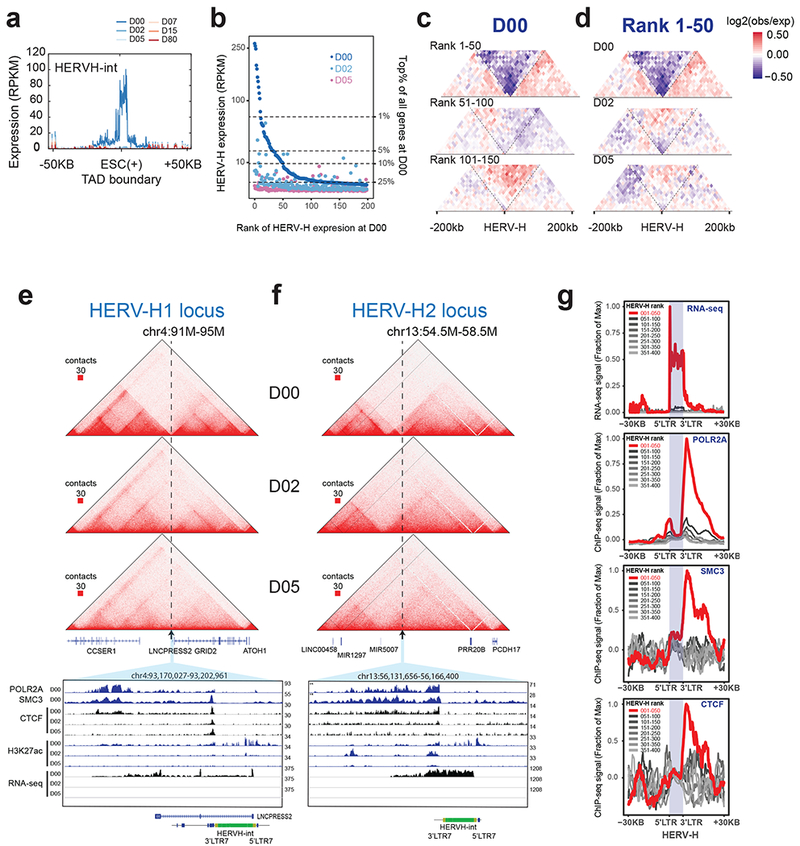
(a) Aggregated RNA-seq expression profile (RPKM normalized) at ESC(+) TAD boundaries that overlap HERV-H element. (b) Scatterplot shows the expression levels (RPKM) across different HERV-H loci (ordered by expression levels from high to low in ESC) at D0, D2 and D5 stages of differentiation. (c) Heatmap of aggregated Hi-C contact matrix [log2(observed/expected)] within 200 kb of the top 50, 51-100 and 101-150 ranked HERV-Hs, at D0. (d) Heatmap of the aggregated Hi-C matrix [log2(observed/expected)] within 200 kb of the top 50 HERV-Hs, at D0, D2 and D5. (e,f) Representative Hi-C interaction matrices of two HERV-H loci located at ESC(+) TAD boundaries at D0, D2 and D5 (top) are shown as heatmaps along with genome browser tracks of POLR2A, SMC3, CTCF, H3K27ac ChIP-seq and RNA-seq data of the expanded genomic region containing the TAD boundary (arrow). (g) Aggregated genomic profiles of RNA-seq, POLR2A, SMC3 and CTCF ChIP-seq around top 50 HERV-Hs located on the ESC(+) TAD boundaries (red) and lower ranked HERV-Hs (grey).
HERV-H is a class of primate-specific endogenous retrotransposons. It is transcriptionally active in both human preimplantation embryos and PSCs30,31, and plays a critical role in pluripotency, stem cell maintenance and somatic cell reprograming32–36. Although more than 1,000 copies of HERV-H sequences exist in the human genome, they are expressed at different levels in hESCs (Fig. 2b)32. Notably, we discovered that the top 50 highly transcribed HERV-H loci are predominantly located at TAD boundaries in hESCs (Fig. 2c, Supplementary Fig. 5b) and that these TAD boundaries are lost when HERV-Hs are transcriptionally silenced in hESCs differentiating into mesodermal cells at day 2 (Fig. 2d; specific loci in Fig. 2e, f and Supplementary Fig. 5c, d, e). In addition, we found HERV-H-associated TAD boundaries were not only present in H9 hESCs but also other hPSCs including H1 hESCs8,37 and human induced PSCs (iPSCs)38. However, similar to our H9 hESC data, these PSCs when differentiated into other lineages did not appear to exhibit HERV-H expression and associated TAD boundaries (Supplementary Fig. 6a). Given these findings, we further tested whether this correlation of TAD boundary and transcription is unique to HERV-H, or if high transcriptional activity in general correlate with boundary strength. We ranked all genes by their expression levels from high to low in hESCs, grouped every 1,000 genes into a bin, separated bins into two categories based on whether they contain CTCF peaks near their promoters, and then examined the DI scores at these corresponding promoters. We found that highly transcribed genes without CTCF peaks in their promoters displayed slightly higher boundary strength than lowly transcribed genes; however, the boundary strength was substantially lower than those observed in HERV-Hs with comparable expression levels (Supplementary Fig. 6b). Furthermore, additional genome-wide analyses revealed two genomic loci that contain a solo LTR7 sequence (HERV-H promoter), thus suggesting that HERV-H internal sequence or RNA may not be required in TAD formation (Supplementary Fig. 7). Taken together, these findings suggest that the HERV-H promoter may have a special sequence composition or transcription frequency that contributes to TAD boundary formation.
To explore how HERV-Hs might contribute to TAD boundary formation, we examined publicly available ChIP-seq data of histone modifications and transcription factors (TFs) in hESCs. Consistent with previous observations34, we found that not only RNA polymerase II subunit A (POLR2A) but also several histone modifications and transcription factors were enriched at sites for the top 50 transcribed HERV-Hs. Unexpectedly, three subunits of the cohesin complex were also enriched at these HERV-H elements (Supplementary Fig. 8). To further investigate the role of cohesin in HERV-H-mediated TAD boundary formation, we performed ChIP-seq in hESCs for the cohesin complex subunit SMC3. Analyzing this ChIP-seq data along with RNA-seq as well as CTCF and POLR2A ChIP-seq data, we observed broad enrichment of cohesin, CTCF and POLR2A specifically at the 3’ end of these highly transcribed HERV-H sequences (Fig. 2g). The enrichment of these factors was not observed at sites of less active HERV-Hs (Fig. 2g), suggesting that they might play a role in mediating the formation of TAD boundaries by HERV-Hs. Interestingly, weak but reproducible broad enrichment of CTCF binding signal was observed in these regions despite the absence of canonical CTCF binding motifs (Fig. 2g), raising the possibility that CTCF may assist in defining these HERV-H-associated TAD boundaries as it does in most other TAD boundaries. Overall, these data support that HERV-Hs form TAD boundaries by accumulating cohesin complexes at its 3’ end, likely positioned by the transcribing POL2 complex39,40.
Deletion of HERV-H elements abolishes nearby TAD boundaries and changes gene expression
To determine the role of HERV-H sequences in TAD boundary formation in hESCs, we produced two genetically engineered hESC lines, termed as HERV-H1-KO and HERV-H2-KO respectively, in which two HERV-H elements located at two of the strongest hESC TAD boundaries were deleted using CRISPR-Cas9 genome editing tools. In both cases, deletion of HERV-H resulted in elimination of TAD boundaries, as evidenced by merging of the two TADs bordering each HERV-H element (Fig. 3a). Furthermore, deletion of HERV-H resulted in reduced expression of genes in the TAD domain immediately 5’ upstream of the HERV-H sequence (Fig. 3a). These findings demonstrated that HERV-H sequences are indispensable for the TAD boundaries formed at these regions, and moreover that the presence of HERV-H increases the transcriptional activity of the neighboring genes in the same TAD domain, supporting the notion that HERV-Hs may serve as enhancers in hESCs41,42. Notably, this activating effect is only seen in the genes on the 5’ end of HERV-H and not the 3’ end, suggesting that boundaries present on the 3’ end of HERV-Hs, may insulate the effect of enhancers. Supporting this possibility, additional analyses showed that genes located within 500 kb or within the TADs upstream of boundary-associated HERV-Hs were more likely to be up-regulated in hESCs compared to differentiated cells than genes in the downstream (Fig. 3b and Supplementary Fig. 9a), respectively.
Figure 3. Deletion of two HERV-H sequences leads to merging of TADs in hESCs.
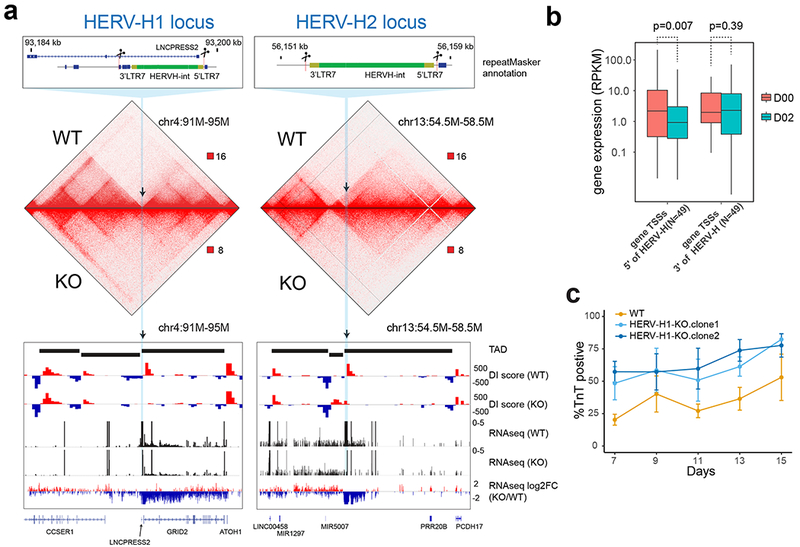
(a) Hi-C interaction matrices of the wild-type (WT) and transgenic hESC lines (HERV-H1-KO and HERV-H2-KO) are shown, along with DI scores, expression levels (RPKM) and fold changes of gene expression at the HERV-H1 and HERV-H2 loci. The loss of TAD boundary in the transgenic cells is accompanied with decrease of RNA expression of genes 5’ terminus to the HERV-H sequences. (b) Boxplots show expression levels (RPKMs) of genes whose TSSs are located from −500 kb to the 5’ LTR (N = 49) and from 3’ LTR to +500 kb (N = 49) of boundary-associated HERV-Hs. P values are from two-sided paired t test on the log-transformed expression levels. The elements of the boxplot are: center line, median; box limit, upper and lower quartiles; whiskers, 1.5× interquartile range. (c) Line chart (mean ± standard error, N = 3 cardiomyocyte differentiations) shows percentage of TNNT2 positive cells during cardiomyocyte differentiation of WT and HERV-H1-KO hESC lines (two HERV-H1-KO clones analyzed). HERV-H1-KO hESCs display increased cardiomyocyte differentiation efficiency compared to WT hESCs.
Further examination of the transcriptional profiles of both HERV-H knockout cell lines revealed that expression of 353 and 144 genes were significantly changed (Supplementary Fig. 9b, c, Supplementary Table 3), and alterations of gene expression profiles in HERV-H1-KO and HERV-H2-KO were highly concordant (Supplementary Fig. 9d, Pearson r = 0.5, P value< 1 × 10⁻¹⁵) despite both engineered cells maintaining pluripotency. Of the 43 genes down-regulated in both KOs, 10 (23%) were located within 20 kb of other HERV-H sequences (Supplementary Fig. 9e), including two well-studied chimeric transcripts SCGB3A243 and LINC0045844, which are known to be regulated by HERV-Hs (Supplementary Fig. 9f, g). Thus, these data suggest that deletion of individual HERV-H sequences could lead to down-regulation of HERV-H-related transcription at other loci.
In further analyzing genes differentially expressed in our HERV-H knockout lines, we discovered that the human-specific long-coding RNA (lncRNA), Heart Brake (HBL1), which has been reported recently to suppress cardiomyocyte differentiation45, was also significantly reduced in the HERV-H1-KO hESCs (Supplementary Fig. 9g). Thus, we hypothesized that these changes in transcriptional landscape in the HERV-H1-KO could promote cardiomyocyte differentiation. To test this hypothesis, we examined the cardiomyocyte differentiation efficiency of HERV-H1-KO hESCs compared to control hESCs under suboptimal cardiomyocyte differentiation conditions. While these conditions led to ~40% cardiomyocyte differentiation efficiency at day 15 in control hESCs, we discovered that HERV-H1-KO hESCs exhibited > 80% cardiomyocyte differentiation efficiency (Fig. 3c). Thus, our results suggest that removal of highly expressed TAD-associated HERV-Hs may alter the potential of hESCs to exit pluripotency and are consistent with recent work reporting that hyper-activation of some HERV-H LTR7s prevents hPSC lines from effectively differentiating into neuronal cells46.
Transcriptional repression removes HERV-H-driven TAD boundaries
Having established that HERV-H DNA sequences are required for TAD boundary formation, we investigated whether its transcriptional activity is also essential. To address this question, we blocked the transcription of the aforementioned HERV-H loci by employing a CRISPR-dCas9-KRAB system with sgRNAs that targeted the promoters (5’ LTR7) of these HERV-Hs (Fig. 4a). Each sgRNA specifically reduced the targeted HERV-H expression by over 70% (Fig. 4b). Accompanying the reduction of HERV-H, the TAD boundary was weakened, as evidenced by the decreased directionality index (Fig. 4c). This result indicates that HERV-H’s high transcriptional activity is required for creating TAD boundaries in hESCs. Consistent with the HERV-H KO data, the genes 5’ upstream of HERV-Hs were also down regulated when HERV-H transcription was repressed (Fig. 4c). In addition, all 10 down-regulated HERV-H loci in HERV-H KO hESCs showed down-regulation in both these lines, suggesting that modulation of individual HERV-H sequences or transcription might impact HERV-H transcription at other loci. However, trans-interactions between active HERV-Hs were not observed (Supplementary Fig. 10), suggesting such regulation might be achieved through mechanisms yet to be characterized.
Figure 4. Silencing of HERV-H sequences weakened the TAD boundaries in hESC.
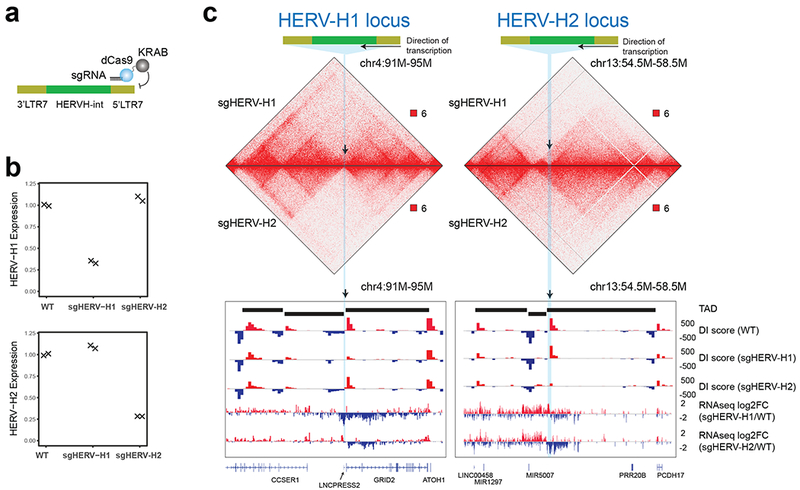
(a) Design of the CRISPR-dCas9-KRAB system to silence HERV-H expression using sgRNAs targeting 5’ LTR7. (b) Gene expression values of HERV-H1 and HERV-H2 in WT and CRISPRi-targeted hESCs. (c) Hi-C interaction matrices of the CRISPRi targeted hESC lines (sgHERV-H1 and sgHERV-H2) are shown, along with DI scores, and log2(fold-change) of gene expression in engineered cell lines over control at the HERV-H1 and HERV-H2 loci.
de novo HERV-H insertion creates new TAD boundaries in hPSCs
To investigate whether HERV-Hs can create TAD boundaries de novo, we engineered two human hESC lines in which an 8-kb sequence from the HERV-H2 locus (which includes 1 kb of additional sequences flanking of HERV-H2) was randomly inserted into multiple locations in the HERV-H2-KO hESC genome using a piggybac transposon (Fig. 5a). The exact location of 43 HERV-H2 inserts was determined by a combination of proximity location analysis using Hi-C and chimeric transcripts analysis using RNA-seq, as HERV-Hs frequently form chimeric transcripts and/or exhibit extensive read-through beyond the 3’ LTR (Supplementary Fig. 11c, Supplementary Table. 4). Out of these 43 insertions, 16 exhibited a significant increase in the local contact insulation at the place of insertion, as evidenced by the change in Hi-C contact matrix and DI score (Fig. 5b). Furthermore, out of these 16 insertions, the allele harboring the HERV-H insertion could be unambiguously identified in 15 cases, where insertion of HERV-H was accompanied with allele-specific increase in insulation (Fig. 5c, d). Thus, these results indicate that HERV-H insertions can create chromatin boundaries de novo. However, at some places of insertion, the HERV-Hs might be silenced by the genomic contexts, thus no longer capable of forming TAD boundaries. As we showed earlier, 70% reduction of HERV-H transcription is sufficient to remove its associated TAD boundaries (Fig. 4b,c).
Figure 5. HERV-H insertion creates de novo TAD boundaries.
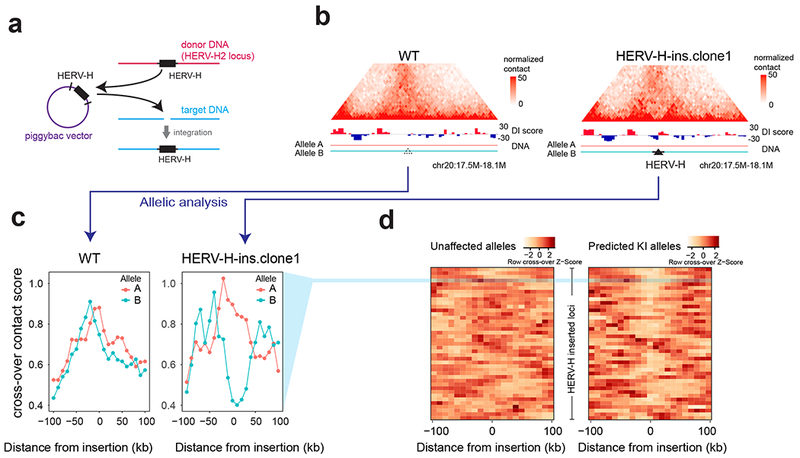
(a) Design of the piggybac vector to “transpose” HERV-H to random genomic locations in the hESC (HERV-H2-KO line). (b) Hi-C contact matrices of the parental cell line (HERV-H2-KO) and the cell line with HERV-H insertions (HERV-H-ins.clone1) are shown, along with DI scores at the locus of one HERV-H insertion. (c) Line plots showing the cross-over contact scores of both alleles in parental cell line (HERV-H2-KO) and HERV-H-ins.clone1 at the same locus as in (b). Only the allele (B) harboring HERV-H insertion shows a decrease of cross-over contact score (increase of insulation). (d) Heatmap shows the z-transformed cross-over contact scores for all predicted knock-in (KI) alleles and unaffected alleles in the HERV-H inserted cells.
HERV-H introduces new TAD boundaries during primate evolution
It is estimated that HERV-H integrated into the primate lineage 30-40 million years ago (MYA) at the time of divergence of Old and New World monkeys47,48, with the largest expansion (LTR7 and LTR7B) occurring in the Old World monkey lineage, including hominids47. Consequently, hominids, including humans, harbor over 1,000 copies of HERV-Hs, whereas New World monkeys only have 50-100 copies in their genomes. To explore whether HERV-Hs might have introduced de novo chromatin domains during primate evolution, we performed Hi-C to interrogate the chromatin architecture in iPSCs from bonobo, chimpanzee and marmoset (New World monkey). To complement these studies, we also examined Hi-C data of mouse ESC23 as a non-primate control. As we had expected because of their evolutionary distance to humans, TAD boundaries also exist in bonobo and chimpanzee iPSCs in the regions syntenic to the top 50 transcribing HERV-H loci in hESCs, which harbor similar HERV-Hs; whereas marmoset iPSCs and mouse ESCs do not contain HERV-Hs nor exhibit insulation at these syntenic regions (Fig. 6a,b and Supplementary Fig 12a). Taken together, our data suggest that HERV-H introduced de novo TAD boundaries during primate evolution in a transcription-dependent manner. Consistent with this notion, additional sequence analysis of the HERV-H LTR sequence showed that the TAD-forming HERV-Hs were predominantly flanked by a 450 bp subtype of LTR7 at both ends (Supplementary Fig. 12b,c), which display less sequence divergence between their 5’ LTRs and 3’ LTRs (Supplementary Fig. 12d), thus suggesting that these HERV-Hs likely were inserted more recently than other HERV-Hs that do not form TAD boundaries, or were impacted by gene conversion or selection49.
Figure 6. HERV-H introduces new TAD boundaries during primate evolution.
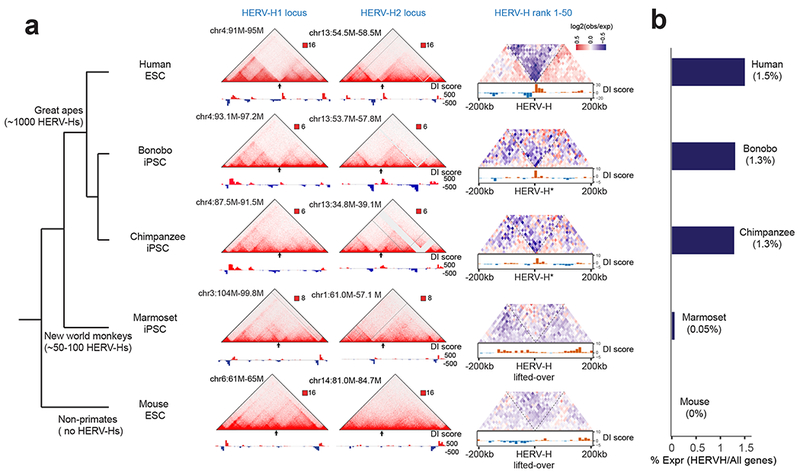
(a) A simplified tree of primate evolution with the copies of HERV-H annotated (left) and Hi-C interaction matrices of human ESCs, bonobo iPSCs, chimpanzee iPSCs, marmoset iPSCs and mouse ESCs are shown, along with DI scores at the syntenic regions to human HERV-H1 locus, HERV-H2 locus, and all top 50 transcribing HERV-Hs. The chimpanzee and bonobo syntenic regions are denoted with a star as they also contain HERV-H sequence. (b) Bar chart shows the percentage of HERV-H transcripts over all transcripts in the PSCs from each indicated species.
Discussion
Evolution of multicellular organisms is driven, in large part, by the invention of new gene regulatory circuits responsible for the fitness traits of each species. A long-standing theory holds that retroviruses may play an important role in the evolution of gene regulatory logic50,51. Over the years, many classes of endogenous retroviral elements have been found to recruit transcription factors to regulate nearby genes in a cell-type-specific manner, or initiate transcription of non-coding RNAs with regulatory functions41,52. Importantly, the expansion of SINE elements in rodents, dogs and opossums has been attributed to the rewiring of gene regulatory networks in these mammals by expanding, in each species, the repertoires of CTCF22, a DNA binding protein with a critical role in chromatin organization. Surprisingly, no evidence has been found so far for repeat-driven expansion of CTCF binding in primate genomes22, raising the question whether retrotransposon-driven chromatin re-organization indeed is a general strategy of evolution that applies also to the primate lineage.
Here, we provide multiple lines of evidence demonstrating that the primate-specific HERV-H retroviral elements can delineate TAD boundaries in the human PSCs. Previous studies suggested that HERV-Hs integrated into the human genome during primate evolution to regulate human-specific pluripotency by creating novel chimeric transcripts (ESRG32, linc-ROR36,53 and LINC0045844) and providing potential binding sites to recruit pluripotency factors (NANOG, SOX2 and POU5F1)33. However, our findings indicate that HERV-H sequences may affect gene regulatory programs by also creating new hPSC-specific TAD boundaries that shape chromatin architecture. Although the cohesin complex is involved in forming long-range chromatin loops at CTCF binding sites16,17 and most TAD boundaries are occupied by CTCF and cohesin complex in mammalian cells, these HERV-H-associated TAD boundaries appear to lack canonical CTCF binding motifs and sharp CTCF ChIP-seq peaks despite retaining cohesin complexes. From our CRISPRi and ChIP-seq studies, we discovered that HERV-H’s ability to form TAD boundaries is highly dependent on transcription and more specifically RNA Polymerase II (rather than CTCF) possibly positioning cohesin complexes (Supplementary Fig. 13). This finding is consistent with recent reports on the role of transcription and polymerase movement in positioning cohesin complexes to create insulation and reshape chromatin structure39,40. Furthermore, this HERV-H-mediated TAD-boundary forming process appears to potentially affect the regulation of gene transcription upstream but not downstream of the HERV-H loci, thus providing insight as to how HERV-Hs may impact gene regulatory networks. However, whether this observation is a general rule for all HERV-Hs will require future studies to more comprehensively interrogate these HERV-Hs.
Finally, our findings suggest the intriguing possibility that other ERV families of repeats and/or other families of repetitive elements may have similar abilities to create TADs and insulation. Thus, future studies of these repeat elements will be interesting to discover whether other distinct classes of repetitive elements may also exhibit similar capacity to influence chromatin architecture in a broad range of cell types that include not only PSCs but also more differentiated cell types. Because reactivation of various transposable elements has been implicated in mammalian aging, cancer and other diseases54–56, such future studies may also illuminate underlying mechanisms for how reactivation of these elements could contribute to disease by disrupting genome architecture and altering gene regulatory programs.
Methods
Cell culture, differentiation, and collections for large-scale cardiac molecular studies
For the large-scale genomic and transcriptomic human embryonic stem cell (hESC) cardiac studies (i.e. ChIP-seq, RNA-seq and HiC experiments), an engineered H9 hESC MLC2v:H2B-GFP reporter transgenic line, which specifically expresses H2B-GFP in differentiated ventricular cardiomyocytes (CMs), was used27. This H9 hESC MLC2v:H2B-GFP line was differentiated into cardiomyocytes and their intermediate developmental stages utilizing a well-established Wnt-based cardiomyocyte differentiation protocol57 that we have previously used to efficiently create hESC-CMs58. Specifically, the following developmental cardiac cell populations were generated and collected: Day (D)0 (hESC), D2 (mesoderm), D5 (cardiac mesoderm), D7 (cardiac progenitors), D15 (primitive CMs) and D80 (ventricular CMs). Differentiation efficiency was assessed at specific developmental cardiac stages by flow cytometry using antibodies against POU5F1 (Cell Signaling C30A3) - D0/hESC, BRACHYURY/T (R&D Systems AF2085) - D2/mesoderm, KDR/PDGFRA (R&D Systems AF357P and AF1264A, respectively) - D5/cardiac mesoderm, cTnT (ThermoFisher MA5-12960) - D15/primitive CMs. Differentiation success for collected D2-D7 samples was further confirmed by re-plating a portion of the cells dissociated for collection and then maintaining them until ~D15 when CM differentiation could be assessed using cTnT flow analysis. Collected samples that resulted in high differentiation efficiency (> 90%) were then further processed and analyzed for molecular studies (see below). For D80 ventricular CMs, we additionally sorted and purified these cells based on MLC2v:H2B-GFP prior to their processing and analyses (Supplementary Fig. 1). For RNA-seq studies, ~2 million dissociated cells were washed in PBS, lysed in Trizol and then stored at −80 °C until further processing. For ChIP-seq studies, dissociated cells were washed in PBS, fixed in 1% formaldehyde for 10 min, quenched with 0.125 M Glycine for 5 min at room temperature (RT), then 10 min on ice and finally washed twice with PBS. These fixed cell pellets were then snap-frozen and stored at −80 °C until further processing.
In situ Hi-C
In situ Hi-C was performed as described previously with minor modifications10. Cells were harvested and pelleted by centrifugation at 300 g for 10 min. Cells were resuspended in PBS and fixed with 1% formaldehyde for 10 min at RT. The reaction was quenched by incubating with 125 mM glycine for 5 min at RT before transferring onto ice. Cells were pelleted (300 g for 10 min at 4 °C) and subsequently washed twice with ice-cold PBS. After the second wash concentration was adjusted to 2 million cells/ml and 1 ml was transferred to a 1.5 ml tube (Eppendorf). Cells were pelleted (1,000 g, 5 min at 4 °C). Following supernatant removal, the pellet was flash frozen in liquid nitrogen and stored at −80 °C. Nuclei were isolated using lysis buffer (10 mM Tris-HCl (pH 8.0), 10 mM NaCl, 0.2% Igepal CA630) and incubation on ice for 15 min. Pelleted nuclei were permeabilized using 0.5% SDS and incubation for 10 min at 62 °C. SDS was quenched by adding Triton-X100. Chromatin was digested using the four base cutter restriction enzyme MboI (200 units, NEB) at 37 °C overnight. Digestion efficiency was checked by gel electrophoresis. After inactivation of MboI for 20 min at 62 °C, single-strand overhangs were filled with biotinylated-14-ATP (Life Technologies) using Klenow DNA polymerase (40 units, NEB) for 90 min at 37 °C. Next, DNA was ligated for 4 h at 16 °C using T4 ligase (2,000 units, NEB). Reverse crosslinking and protein degradation was performed using proteinase K (NEB) and incubation at 55 °C for 30 min. Finally, NaCl (500 mM) was added and the reaction was completed at 68 °C overnight. DNA was purified using ethanol precipitation and sonicated using an ultra sonicator (Covaris M220; duty cycle: 10; intensity: 4; cycles/burst: 220; duration: 55 s) to 300-700 bp small fragments. After size selection and purification using SPRI beads (Beckman Coulter), biotinylated DNA was isolated using Dynabeads MyOne T1 Streptavidin beads (Life Technologies). Sequencing libraries were prepared on magnetic beads and final PCR amplification was carried out for 6 cycles. Size distribution of bead-purified libraries was checked using a High Sensitivity D1000 ScreenTape on a Tapestation (Agilent) and quantified using Qubit (Life Technologies). Libraries were sequenced on Hiseq 4000 (100 bp PE, Illumina).
ChIP-seq
ChIP-seq experiments for all histone marks at all time points were performed as previously described59,60. The experiments were conducted according to experimental guidelines and read depth standards of the ENCODE consortium. Harvested cells were washed in PBS and fixed in 1% formaldehyde for 10 min at room temperature. Reaction was quenched with 125 mM Glycine for 5 min at room temperature followed by 10 min incubation on ice. Next, the cells were washed twice with PBS. Crosslinked cells were lysed and chromatin sheared using a Branson Sonifier 450 (20 cycles, 15 sec ON, 45 sec OFF at power 3). Detailed protocols can be found on the ENCODE homepage for immunoprecipitation (https://www.encodeproject.org/documents/89795b31-e65a-42ca-9d7bd75196f6f4b3/@@download/attachment/Ren%20Lab%20ENCODE%20Chromatin%20Immunoprecipitation%20Protocol_V2.pdf) and library preparation (https://www.encodeproject.org/documents/4f73fbc3-956e-47ae-aa2d41a7df552c81/@@download/attachment/Ren_ChIP_Library_Preparation_v060614.pdf). ChIP-seq experiments for CTCF and SMC3 were carried out on two and ten million crosslinked cells, respectively, as previously described61,62. Nuclei were isolated using hypotonic buffer and subsequently lysed in RIPA buffer (140 mM NaCl, 1 mM EDTA, 1% Triton X-100, 0.1% SDS, 0.1% sodium deoxycholate, 10 mM Tris-HCl pH 8.0 supplemented with protease inhibitor (Roche)) and chromatin was sheared using a Covaris M220. Cell lysates were precleared using Protein G beads (Sigma) and rotation for 3 h at 4 °C. For immunoprecipitation, chromatin was incubated with antibodies against CTCF overnight at 4 °C. Antibody chromatin complexes were bound by Protein G beads for 2 h at 4 °C. After eight rounds of washing using combinations of high and low salt buffers, crosslinks were reversed with Proteinase K (NEB) at 65 °C overnight. DNA was purified by phenol/chloroform/isoamyl alcohol extraction and ethanol precipitation. Sequencing libraries were generated using the Accel-NGS® 2S Plus DNA Library Kit (Swift). All ChIP-seq libraries were sequenced on HiSeq 2500/4000 (50 bp SE, Illumina). Antibody information could be found in the “Life Sciences Reporting Summary”.
RNA-seq
Total RNA from cells was extracted using Trizol (Thermo) and purified with RNA Clean & Concentrator™−5 (R1013, Zymo Research). RNA sequencing libraries were prepared from 1-2 µg total RNA using the Illumina TruSeq Stranded mRNA Library Prep Kit Set A (Illumina, RS-122-2101) or Set B (Illumina, RS-122-2102). Sequencing was carried out on HiSeq 2500/4000 (50/100 bp PE, Illumina).
HERV-H deletion study
To interrogate the functional significance of HERV-Hs, selected HERV-H sequences were genetically deleted in H9 MLC2v:H2B-GFP hESCs using CRISPR-Cas9 genome editing strategies. To this end, specific gRNA pairs with binding sites surrounding the target region were designed63 using a web-based software tool CRISPOR64, which generates gRNA sequences for optimal targeting of region of interest while minimizing potential off-target effects. These identified gRNAs were then synthesized in vitro using the GeneArt Precision gRNA Synthesis kit (Invitrogen). One day before transfection, 1 × 10⁵ H9 MLC2v:H2B-GFP hESCs were seeded in 12-well plates. When cells were 30-60% confluent, a pair of RNP complexes containing 2 µg of Cas9 protein (NEB) and 400 ng of in vitro transcribed gRNA were transfected using Lipofectamine Stem Transfection Reagent (Invitrogen)65,66. Three days after transfection, cells were diluted and clonally expanded for genotyping67. After confirmation of genome-edited clones by Sanger sequencing, at least two successfully targeted clones per deletion were selected for functional analysis. To examine the effects of deleting HERV-Hs on chromatin boundary formation and gene expression, in situ Hi-C and RNA-seq studies were respectively performed as described above. Because of the potential role of HERV-H1 in cardiac differentiation, HERV-H1-deleted H9 MLC2v:H2B-GFP hESC clones were additionally examined for their ability to differentiate into cardiomyocytes. To this end, hESC seeding density and canonical Wnt signaling levels were titrated to initially find suboptimal CM differentiation conditions that result in 50% CM differentiation by Day 15 in control H9 MLC2v:H2B-GFP hESCs. These suboptimal CM differentiation conditions were then applied to both control and HERV-H1 deleted H9 MLC2v:H2B-GFP hESC clones to further assess their ability to differentiate into CMs from Day 7-15 as detected by TNNT2 FACS analyses. The differentiation experiments were repeated three times.
HERV-H CRISPRi study
For the generation of the HERV-H1 or HERV-H2 CRISPRi lines, three CRISPRi gRNAs (Supplementary Table 5) were designed to target the DNA region from −50 to 300 bp relative to the TSS of the candidate genes68 and cloned into lenti-sgRNA (MS2)-puro plasmid (Addgene ID:73795)69. H9 MLC2v:H2B-GFP hESCs were firstly infected by Lenti-dCas9-KRAB-blast virus (Addgene ID: 89567)70 and were selected by 5 μg/ml blasticidin for 5 days. Survivor cells were then transduced with gRNA lentivirus and selected by 1 μg/ml puromycin for 5 days. All cell lines were cultured for another 10 or more days to allow sufficient time for CRISPR inactivation of the target gene before being used for further experiments. HERV-H1 clone #3 and HERV-H2 clone #1 were selected for Hi-C and RNA-seq experiments based on their silencing efficacy and specificity.
HERV-H knock-in study
Plasmid construction
The PiggyBac expression vector PB-CMV-MCS-EF1α-GreenPuro (System Biosciences, Cat. #PB513B-1) was modified to remove two core insulators and replace the original CMV promoter in the vector with EF1α promoter by Gibson assembly. Briefly, the EF1α-GreenPuro cassette and the backbone of PB-CMV-MCS-EF1α-GreenPuro were PCR amplified respectively. Two fragments were then assembled together by NEBuilder HiFi DNA assembly master mix (NEB, Cat. #E2621S). The new modified plasmid was named as PB513Re.
To construct a HERV-H2 knock-in plasmid HERV-H2-PB513Re, an 8-kb sequence from the HERV-H2 locus (which includes 1 kb of additional sequences flanking of HERV-H2) was PCR-amplified and digested by Xho I and Not I, then cloned into PB513Re vector which was digested by the same two restriction enzymes. Recombined constructs were further verified by restriction enzyme digestion and sanger sequencing. The primers used for cloning were listed in Supplementary Table 5.
Generation of HERV-H2 knock-in line:
To generate HERV-H2 knock-in line, we used PiggyBac transposon system which can efficiently integrate interested DNA into the genome at multiple sites71,72. One day before transfection, 1 × 10⁵ HERV-H2-KO hESCs were seeded in 12-well plates. Next day, 1 μg HERV-H2-PB513Re plasmid and 0.1 μg transposase were transfected into the cells using Lipofectamine Stem Transfection Reagent. Cells were selected by 1 μg/ml puromycin for 5 days, then were diluted and clonally expanded for Hi-C and other further experiments. Two knock-in cell lines were obtained, named HERV-H-ins.clone1 and HERV-H-ins.clone2, respectively.
Non-human primate iPSC cultures
Chimpanzee and bonobo iPSCs were cultured on plates pre-coated with Matrigel (BD Biosciences) in commercial mTeSR1™ medium (Stemcell technology, 85850). Cells were passaged every 5-6 days with TrypLE (Life Technologies) at a split ratio of 1:10. ROCK inhibitor Y27632 (10 µM) was added at least one hour prior to and 24 hours after passaging. Marmoset iPSCs were cultured on MEFs in CDF12 media containing DMEM/F12 (Life Technologies, 11330-032), 20% Knockout Serum Replacement (KSR, Life Technologies, 10828), 2 mM Glutamax (Life Technolgies, 35050-061), 0,1 mM NEAA (Life Technologies, 11140-050), 0.1 mM β-mercaptoethanol (Gibco, 21985) and 10 ng/ml FGF2 (Peprotech). Marmoset iPSCs were passaged every 6-7 days either using Collagenase IV (Life Technologies) at or TrypLE (Life Technologies) at 1:5 ratio. When passaged using TrypLE ROCK inhibitor Y27632 (10 µM) was added at least one hour prior to and 24 hours after passaging. Tests for mycoplasma contamination were routinely performed for all the cell lines using PCR-based approach or MycoAlert mycoplasma detection kit (Lonza) following manufacturer’s recommendation every 10 passages.
ChIP-seq data processing
Read alignment:
Reads were aligned to hg19 (GRC37) following standards of ENCODE ChIP-seq pipeline73. The full pipeline is available at https://github.com/ren-lab/chip-seq-pipeline. Briefly, the reads were mapped with bwa74. PCR duplicates were removed using Picard75. Only reads with mapping quality > 30 were kept.
ChIP-seq peak calling:
For each stage, ChIP-seq peaks were called using MACS276 for each biological replicate and pooled sample, using the pooled input sample as control. MACS2 was run with the default setting with “--nomodel –extsize 180” parameter. Peaks called in the pooled sample that also intersected with peaks in both replicates by at least 50% bases were defined as replicated peaks and were used as the final peak list for that stage. Peaks from all stages were merged into a union peak list using bedtools mergeBed77.
ChIP-seq signal visualization:
ChIP-seq bigWig files were generated using deeptools78 bamCoverage function with the RPKM (Reads Per Kilobase of transcript per Million mapped reads) normalization option. Aggregated signal profiles were generated with the deeptools computeMatrix and plotProfile functions and further modified in R.
RNA-seq data processing:
Read alignment and quantification:
RNA-seq alignment and quantification pipeline is available at https://github.com/ren-lab/rnaseq-pipeline. Briefly, reads were aligned to hg19 (GRC37) and GENCODE GTF v19 with rnaSTAR79 following “ENCODE” options outlined in the rnaSTAR manual (http://labshare.cshl.edu/shares/gingeraslab/www-data/dobin/STAR/STAR.posix/doc/STARmanual.pdf). PCR duplicates were removed using Picard. Raw reads for each gene were quantified using featureCounts80. Read per million reads and kilobases (RPKM) were calculated for each gene.
Differentiation gene expression analysis:
differentially gene expression was performed using edgeR81 with the default normalization method, tagwise dispersion estimation function and glmLRT (negative binomial generalized log-linear model).
Hi-C data processing:
The HiC data processing pipeline is available at https://github.com/ren-lab/hic-pipeline. Hi-C reads were aligned on hg19(GRC37) using BWA-MEM74 for each read separately, and then paired. For chimeric reads, only 5’ end mapped locations were kept. Duplicated read pairs mapped to the same location were removed to leave only one unique read pair. The output bam files were transformed into juicer file format and tag directories for further analysis in Juicebox 82 and HOMER83. Unless specified otherwise, we used the contact matrix in 10kb resolution and normalized using KR matrix balancing method.
Compartments A/B:
Principal component analysis was performed using HOMER83 with resolution of 50 kb. DNA segments with positive PC1 value in both biological replicates were defined as compartment A, whereas negative value for compartment B. Inconsistent PC1 signs between replicates were defined as inconsistent. For dynamic and static compartment analysis (Fig. 1b), only DNA segments with consistent compartment state at each of the six stages (which was 85% of all genomic bins) were included. A DNA segment was defined as static if it stayed compartment A or B at all six stages; Otherwise it was named dynamic. Compartment switch types were defined as “BA” if it switched from B to A, and vice versa. If the compartment bin switched from A to B, and then switched back to A, it will be defined as “ABA”, and the same rule applies to “BAB”. Bins with more than 2 switches were very rare and left out in the analysis/plot. Hierarchical clustering was performed on the PC1 values of all dynamic bins, by both rows (segments) and columns (sample replicates), using (1- Pearson correlation coefficient) as distance and average linkage method to merge branches.
Insulation score:
To quantify insulation based on KR normalized contact frequencies we used the insulation score defined in Crane et al. 2015 29, using 500 kb as the square size, and 200 kb as the delta size. Insulation TADs were called using the perl script at https://github.com/dekkerlab/crane-nature-2015.
Directionality Index:
We calculated the Directionality Index (DI) as described in Dixon et al.5. The KR normalized contact matrices were used as input to this transformation. We generated the DI score at two different resolutions: 10 kb and 40 kb. In both cases, we limited the scope of interaction to 2 Mb upstream or downstream.
Topologically associating domains (TADs)
TAD identification:
We called TADs using three different algorithms: domain caller5, Arrowhead10 and insulation score29. All methods were run with the default parameters recommended in the user manual and with the resolution at 10 kb. They produced different number of TADs because of inherent difference in their algorithms and choice of default parameters. Nevertheless, the same trend of TAD loss was observed (Supplementary Fig. 4a,b,c).
Identification of non-redundant TAD boundaries:
TAD boundaries were previously found to be conserved between cell types8. Based on this assumption, we should be able to find a set of non-redundant TAD boundaries across different cell types. To identify non-redundant boundaries across all samples, we collapsed spatially identical or close TADs across all time points and replicates. To do this, we first quantile normalized the Directionality Index (DI) scores genome-wide between all twelve samples. Then we calculated the DI delta scores for each TAD boundary. DI delta score is the average difference in DI between the 4 bins (10 kb per bin) downstream and 4 bins upstream of the boundary. We concatenated TAD boundaries from all samples (twelve) and sorted them by their DI delta scores in descending order. Then we picked one TAD boundary from the top of the list and remove any remaining boundary within 50 kb of the top TAD boundary. The number as well as the stages of removed boundaries are recorded in the kept TAD boundaries as two additional columns. Then we picked the next TAD boundary on the list and repeat the same process, until the entire list was traversed. To remove unwanted spurious calls, any TAD boundary without a redundant (duplicate) call is discarded. For each non-redundant TAD boundary, it is denoted as a boundary (TRUE) in a stage if the DI delta score is greater than 200 in both replicates in that stage, otherwise is FALSE.
Dynamic TAD boundaries across stages:
To determine dynamic TAD boundaries across stages, we first obtained the DI delta scores for each non-redundant TAD boundary. Then we log transformed the score and used the values as input to LIMMA84. LIMMA package was used to call differential boundary strength between each adjacent stage comparisons (e.g. D00 vs D02, D02 vs D05, etc.). P values were calculated with the eBayes function within LIMMA with trend parameter disabled, and were adjusted using Benjamini-Hochberg method. A TAD boundary was called dynamic if its adjusted P value was less than 0.01 in any adjacent stage comparisons. Otherwise, it was called a stable TAD boundary. However, if the delta scores of that boundary were consistently greater than 200 in all samples, regardless of its state called in LIMMA, it was denoted as stable TAD boundary. Within dynamic TAD boundaries, we denoted the ones that were only present (TRUE) at D00 as ESC(+) TAD boundaries, those that were only FALSE at D80 as vCM(−) TAD boundaries (Fig. 1c).
Overlap of TAD and TAD boundaries with CTCF and repeat elements:
Overlap of CTCF ChIP-seq peaks and repeat elements to TAD and/or TAD boundaries were performed using BEDtools intersect77. When performing intersections, the TAD boundaries were increased to ± 25 kb from the original TAD boundaries to account for algorithmic inaccuracies in calling boundaries. Repeat elements were RepeatMasker annotation downloaded directly from UCSC85. To avoid spurious results introduced by repeats with few copies in the genome, only repeats with more than 1,000 copies genome-wide were tested here. The intersections were performed against each repeat name category separately, and for ESC(+) TADs, vCM(−) TADs and all stable TADs. For each repeat element, we obtained the fraction of TAD boundaries that contained that repeat. Then we calculated the fold enrichment of each repeat element at the TAD boundaries of ESC(+) (or vCM(−) ) TADs over stable TAD boundaries. The significance of the enrichment was computed using two-sided proportion test function in R. The repeat elements with fold enrichment greater than two and P value less than 0.01 were reported as significantly enriched.
Gene expression profile at the TAD boundaries containing repeat elements (Fig. 2a and Supplementary Fig. 5a):
For each of the eight repeat elements found in Figure 1c, we kept the DNA sequences that intersected with ESC(+) TAD boundaries. Using these sequences as reference point, we generated the average RPKM normalized signal over ± 50 kb of the reference point with deeptools computeMatrix function78. Only LTR7 and HERVH-int sequences displayed high expression in hESCs.
HERV-H related analysis
Contact matrix on HERV-Hs transcribed at different levels (Fig. 2c,d):
To investigate the boundary activity of HERV-Hs that transcribed at different levels, we visualized the contact matrix at 10-kb resolution. We sorted the HERV-H loci by their expression RPKMs in hESCs (day 0) in descending order and assign every 50 loci to a bin. For each bin, we generated the median observed/expected score of each interacting pixel 200 kb surrounding the HERV-H loci. The same obs/exp matrix were computed at day 2 and day 5 for top 50 loci, and for rank51-100 and rank101-150 loci at day 0.
Directionality index profile on HERV-Hs in iPSCs and H1-derived cells and on all genes transcribed at different levels. (relating to Supplementary Fig. 6a,b):
The Hi-C data for human iPSCs were from Greenwald et al38. The Hi-C data from H1 ESC and its derived cells were from Dixon et al5,8. The data were downloaded and processed the same way as described above. Because DI scores are dependent on the sequencing depth, the H1ESC DI profile may look less pronounced comparing to the iPSC.
To investigate whether the correlation of gene expression and boundary strength also holds true for all genes, we also plotted DI score profile for human genes that express at different levels. We first sort the genes by their RPKMs in the hESC from high to low, and then group every 1,000 genes into bins, and further separate them into groups with CTCF peaks within 20 kb of TSSs or not. Aggregated median DI scores were plotted for each group of genes at 10-kb resolution up to 200 kb.
ChIP-seq enrichment analysis at TAD boundary-associating HERV-H loci (relating to Supplementary Fig. 8):
To investigate which protein(s) may be responsible for TAD boundary formation at top 50 transcribing HERV-H loci, we downloaded hESC ChIP-seq bigWig files from ENCODE (primary) and other sources in the public domain (prefixed with the SRA ID if downloaded from other than ENCODE)86. For each ChIP-seq data, we computed the average bigWig signal on the top 50 HERV-Hs with bigWigAverageOverBed command from UCSC, and the average bigWig signal on HERV-Hs ranking from 51 to 300. Then we calculated the fold change with these two averages.
HERV-H insertion analysis (relating to Fig. 5 and Supplementary Figure 11):
To identify the loci of HERV-H2 insertion, we extracted discordant read pairs from Hi-C that had one end mapped to the HERV-H2 DNA sequence. Based on Hi-C’s proximity ligation principle, we expect to see pileup of reads at genomic locations where the HERV-H2 were inserted into. Based on a naïve algorithm to detect clusters of adjacent 10-kb bins with more than 30 read pileups, we uncovered 33 and 19 insertions in HERV-H-ins.clone1 and HERV-H-ins.clone2, respectively. We further narrowed the number of reliable insertions sites for analysis to 43 total insertions by choosing insertions that had RNA-seq signal from the widespread readthrough transcription at insertion sites. Directionality Index (DI) scores were calculated as described in Methods section (Hi-C data processing: Directionality Index) with a window size of 10 kb for the HERV-H-ins.clone1 HERV-H-ins.clone2 and HERV-H2-KO (parental) Hi-C data. Delta DI scores were calculated by finding the absolute difference between the average of 2 DI scores immediately upstream of the insertion bin and 2 DI scores immediately downstream of the insertion bin.
HERV-H insertion allelic analysis (relating to Fig. 5c,d):
Reads from Hi-C of all developmental stages were used for genotyping and haplotype phasing. First, variants were called according to the GATK best practice pipeline87 using GATK 3.6-017-19. Briefly, reads were realigned, and base pair qualities were recalibrated. Variants were then called using HaplotypeCaller (GATK) with default parameters. Variants were then recalibrated based on known gold standard variants. Only variants that passed filters were used in the downstream analysis. Considering possible artifact caused by restricted enzyme ligation, variants within MboI sites were removed. Second, high quality (quality > 30) heterozygous bi-allelic SNPs were phased using HaploSeq pipeline88. Briefly, reads from Hi-C data were extracted using extractHAIRs and then used as input for HAPCUT289 to generate haplotypes.
Haplotype phasing was performed on the HERV-H2-KO, HERV-H-ins.clone1, and HERV-H-ins.clone2 Hi-C bam files using the obtained haplotype-phased VCF files. This created two bam files corresponding to “allele A” and “allele B” for each input bam file. In order to determine which phased allele contained each insertion, we calculated the number of discordant read pairs with one end mapping to HERV-H2 and the other end mapping to each predicted insertion position (within 100 kb). The phased bam with the most HERV-H discordant read pairs mapping to it was labeled as the KI allele in each case. Each phased bam file was converted to a pgl file using pgltools90 samTopgl to facilitate insulation analysis. We defined the “cross-over contact score” as the number of interactions that cross a 10-kb bin divided by the number of interactions upstream and downstream of the bin, within a 200-kb window. The “cross-over contact score” measures the level of chromatin contact insulation. Cross-over contact scores were calculated in this manner for all insertion positions in the unaffected alleles as well as the predicted KI alleles. Two insertions (at chr2:213896052 and chr1:49135920) were removed from analysis because they contained bins where there were no interactions that crossed the bin, leading to 0 scores and bins where all interactions crossed the bin, leading to infinite scores. The R heatmap.2 function from gplots was used to plot the heatmap of the row Z-score normalized cross-over contact scores for the KI alleles and the unaffected alleles for each insertion position (Fig. 5d).
HERV-H comparative analysis (relating to Fig. 6):
Mouse ESC Hi-C data from Bonev et al.23 was downloaded from SRA and aligned to mm10 with the same procedure as described above. Bonobo, chimpanzee and marmoset iPSC Hi-C data were aligned to panPan2, panTro6 and calJac3 reference genome, respectively, with the same procedure. The syntenic regions in mouse, marmoset, chimpanzee and bonobo to the human HERV-H loci (± 20 kb centered on each HERV-H sequence) were obtained using UCSC liftover tool with minimum ratio of base remap of 0.1.
HERV-H LTR type and divergence analysis (relating to Supplementary. Fig. 12):
To investigate the sequence features of the LTRs flanking TAD boundary associated HERV-Hs and non-boundary associated HERV-Hs, we examined their presence, length and sequence divergence. The LTRs for HERV-H include LTR7, LTR7A, LTR7B, LTR7C and LTR7Y. We downloaded the annotations for those LTRs from repeatMasker and assigned them to each HERV-H-int sequence by base overlap. The HERV-H loci were ordered by their expression levels and binned as described above (the top 50 were enriched at TAD boundaries).
Sequence divergence between the 5’ LTR and 3’LTR sequences was used to measure the insertion time for retrotransposons. Based on the retrotransposon insertion mechanism, at the time of insertion, 5’ and 3’ LTR sequences should be identical; the LTR sequences will each accumulate mutations over time, and thus their sequence differences could be used as a proxy to their ages. We followed the steps outlined in https://github.com/SIWLab/Lab_Info/wiki/Ageing-LTR-insertions to align each LTR pairs and calculated the sequence divergences91,92.
General data processing and plots
Most of the described data processing steps (statistical tests, clustering, plotting, etc.) were performed in python 3.4.5 (www.python.org) and statistical computing environment R 3.4.3 (www.r-project.org). Boxplots were made with ggplot2 (https://cran.r-project.org/web/packages/ggplot2). The elements of the boxplot are: center line, median; box limit, upper and lower quartiles; whiskers, 1.5× interquartile range; points, outliers.
Data availability
All sequencing datasets have been deposited on GEO with the accession number GSE116862.
Code availability
Scripts are available at https://github.com/shawnzhangyx/cvdc_scripts.
Supplementary Material
Acknowledgements
We thank S. Kuan and B. Li for sequencing and bioinformatic support. We thank E. Nostrand for RNA extraction. We would like to thank M. Daadi (University of Texas Health Science Center at San Antonio) for providing marmoset iPSCs. This project is supported by funding from the Ludwig Institute for Cancer Research (to B.R.), the NIH (1UM1HL128773 to S.M.E., N.C.C., E.D. and B.R., U54 DK107977 to B.R.). J.W. is the Virginia Murchison Linthicum Scholar in Medical Research. S.P. was supported by a postdoctoral fellowship from the Deutsche Forschungsgemeinschaft (DFG, PR 1668/1-1). E.N.F. was supported by NIH pre-doctoral training grant (5T32HL007444-35). M.A. was supported by an NIH training grant (T32GM008806-18). J.C.I.B. was supported by The Moxie Foundation and Universidad Catolica San Antonio de Murcia (UCAM).
Footnotes
Competing Interests Statement:
B.R. is a co-founder of Arima Genomics, Inc.
References
- 1.Dekker J & Mirny L The 3D Genome as Moderator of Chromosomal Communication. Cell 164, 1110–1121, doi:10.1016/j.cell.2016.02.007 (2016). [DOI] [PMC free article] [PubMed] [Google Scholar]
- 2.Yu M & Ren B The Three-Dimensional Organization of Mammalian Genomes. Annu Rev Cell Dev Biol 33, 265–289, doi:10.1146/annurev-cellbio-100616-060531 (2017). [DOI] [PMC free article] [PubMed] [Google Scholar]
- 3.Meaburn KJ & Misteli T Cell biology: chromosome territories. Nature 445, 379–781, doi:10.1038/445379a (2007). [DOI] [PubMed] [Google Scholar]
- 4.Lieberman-Aiden E et al. Comprehensive mapping of long-range interactions reveals folding principles of the human genome. Science 326, 289–293, doi:10.1126/science.1181369 (2009). [DOI] [PMC free article] [PubMed] [Google Scholar]
- 5.Dixon JR et al. Topological domains in mammalian genomes identified by analysis of chromatin interactions. Nature 485, 376–380, doi:10.1038/nature11082 (2012). [DOI] [PMC free article] [PubMed] [Google Scholar]
- 6.Sexton T et al. Three-Dimensional Folding and Functional Organization Principles of the Drosophila Genome. Cell 148, 458–472, doi:10.1016/j.cell.2012.01.010 (2012). [DOI] [PubMed] [Google Scholar]
- 7.Nora EP et al. Spatial partitioning of the regulatory landscape of the X-inactivation centre. Nature 485, 381–385, doi:10.1038/nature11049 (2012). [DOI] [PMC free article] [PubMed] [Google Scholar]
- 8.Dixon JR et al. Chromatin architecture reorganization during stem cell differentiation. Nature 518, 331–336, doi:10.1038/nature14222 (2015). [DOI] [PMC free article] [PubMed] [Google Scholar]
- 9.Dixon JR, Gorkin DU & Ren B Chromatin Domains: The Unit of Chromosome Organization. Mol Cell 62, 668–680, doi:10.1016/j.molcel.2016.05.018 (2016). [DOI] [PMC free article] [PubMed] [Google Scholar]
- 10.Rao SS et al. A 3D map of the human genome at kilobase resolution reveals principles of chromatin looping. Cell 159, 1665–1680, doi:10.1016/j.cell.2014.11.021 (2014). [DOI] [PMC free article] [PubMed] [Google Scholar]
- 11.Jin F et al. A high-resolution map of the three-dimensional chromatin interactome in human cells. Nature 503, 290–294, doi:10.1038/nature12644 (2013). [DOI] [PMC free article] [PubMed] [Google Scholar]
- 12.Lupianez DG et al. Disruptions of topological chromatin domains cause pathogenic rewiring of gene-enhancer interactions. Cell 161, 1012–1025, doi:10.1016/j.cell.2015.04.004 (2015). [DOI] [PMC free article] [PubMed] [Google Scholar]
- 13.Lupianez DG, Spielmann M & Mundlos S Breaking TADs: How Alterations of Chromatin Domains Result in Disease. Trends Genet 32, 225–237, doi:10.1016/j.tig.2016.01.003 (2016). [DOI] [PubMed] [Google Scholar]
- 14.Ibn-Salem J et al. Deletions of chromosomal regulatory boundaries are associated with congenital disease. Genome biology 15, 423, doi:10.1186/s13059-014-0423-1 (2014). [DOI] [PMC free article] [PubMed] [Google Scholar]
- 15.Franke M et al. Formation of new chromatin domains determines pathogenicity of genomic duplications. Nature 538, 265–269, doi:10.1038/nature19800 (2016). [DOI] [PubMed] [Google Scholar]
- 16.Nasmyth K Disseminating the genome: joining, resolving, and separating sister chromatids during mitosis and meiosis. Annu Rev Genet 35, 673–745, doi:10.1146/annurev.genet.35.102401.091334 (2001). [DOI] [PubMed] [Google Scholar]
- 17.Alipour E & Marko JF Self-organization of domain structures by DNA-loop-extruding enzymes. Nucleic Acids Res 40, 11202–11212, doi:10.1093/nar/gks925 (2012). [DOI] [PMC free article] [PubMed] [Google Scholar]
- 18.Rao SSP et al. Cohesin Loss Eliminates All Loop Domains. Cell 171, 305–320 e324, doi:10.1016/j.cell.2017.09.026 (2017). [DOI] [PMC free article] [PubMed] [Google Scholar]
- 19.Pombo A & Dillon N Three-dimensional genome architecture: players and mechanisms. Nat Rev Mol Cell Biol 16, 245–257, doi:10.1038/nrm3965 (2015). [DOI] [PubMed] [Google Scholar]
- 20.Nora EP et al. Targeted Degradation of CTCF Decouples Local Insulation of Chromosome Domains from Genomic Compartmentalization. Cell 169, 930–944 e922, doi:10.1016/j.cell.2017.05.004 (2017). [DOI] [PMC free article] [PubMed] [Google Scholar]
- 21.Vietri Rudan M et al. Comparative Hi-C reveals that CTCF underlies evolution of chromosomal domain architecture. Cell Rep 10, 1297–1309, doi:10.1016/j.celrep.2015.02.004 (2015). [DOI] [PMC free article] [PubMed] [Google Scholar]
- 22.Schmidt D et al. Waves of retrotransposon expansion remodel genome organization and CTCF binding in multiple mammalian lineages. Cell 148, 335–348, doi:10.1016/j.cell.2011.11.058 (2012). [DOI] [PMC free article] [PubMed] [Google Scholar]
- 23.Bonev B et al. Multiscale 3D Genome Rewiring during Mouse Neural Development. Cell 171, 557–572 e524, doi:10.1016/j.cell.2017.09.043 (2017). [DOI] [PMC free article] [PubMed] [Google Scholar]
- 24.Stadhouders R et al. Transcription factors orchestrate dynamic interplay between genome topology and gene regulation during cell reprogramming. Nat Genet 50, 238–249, doi:10.1038/s41588-017-0030-7 (2018). [DOI] [PMC free article] [PubMed] [Google Scholar]
- 25.Krijger PH et al. Cell-of-Origin-Specific 3D Genome Structure Acquired during Somatic Cell Reprogramming. Cell Stem Cell 18, 597–610, doi:10.1016/j.stem.2016.01.007 (2016). [DOI] [PMC free article] [PubMed] [Google Scholar]
- 26.Beagan JA et al. Local Genome Topology Can Exhibit an Incompletely Rewired 3D-Folding State during Somatic Cell Reprogramming. Cell Stem Cell 18, 611–624, doi:10.1016/j.stem.2016.04.004 (2016). [DOI] [PMC free article] [PubMed] [Google Scholar]
- 27.Veevers J et al. Cell-Surface Marker Signature for Enrichment of Ventricular Cardiomyocytes Derived from Human Embryonic Stem Cells. Stem cell reports, doi:10.1016/j.stemcr.2018.07.007 (2018). [DOI] [PMC free article] [PubMed] [Google Scholar]
- 28.Fields PA et al. Dynamic reorganization of nuclear architecture during human cardiogenesis. bioRxiv (2017). [Google Scholar]
- 29.Crane E et al. Condensin-driven remodelling of X chromosome topology during dosage compensation. Nature 523, 240–244, doi:10.1038/nature14450 (2015). [DOI] [PMC free article] [PubMed] [Google Scholar]
- 30.Grow EJ et al. Intrinsic retroviral reactivation in human preimplantation embryos and pluripotent cells. Nature 522, 221–225, doi:10.1038/nature14308 (2015). [DOI] [PMC free article] [PubMed] [Google Scholar]
- 31.Goke J et al. Dynamic transcription of distinct classes of endogenous retroviral elements marks specific populations of early human embryonic cells. Cell Stem Cell 16, 135–141, doi:10.1016/j.stem.2015.01.005 (2015). [DOI] [PubMed] [Google Scholar]
- 32.Lu X et al. The retrovirus HERVH is a long noncoding RNA required for human embryonic stem cell identity. Nat Struct Mol Biol 21, 423–425, doi:10.1038/nsmb.2799 (2014). [DOI] [PubMed] [Google Scholar]
- 33.Romer C, Singh M, Hurst LD & Izsvak Z How to tame an endogenous retrovirus: HERVH and the evolution of human pluripotency. Curr Opin Virol 25, 49–58, doi:10.1016/j.coviro.2017.07.001 (2017). [DOI] [PubMed] [Google Scholar]
- 34.Santoni FA, Guerra J & Luban J HERV-H RNA is abundant in human embryonic stem cells and a precise marker for pluripotency. Retrovirology 9, 111, doi:10.1186/1742-4690-9-111 (2012). [DOI] [PMC free article] [PubMed] [Google Scholar]
- 35.Ohnuki M et al. Dynamic regulation of human endogenous retroviruses mediates factor-induced reprogramming and differentiation potential. Proc Natl Acad Sci U S A 111, 12426–12431, doi:10.1073/pnas.1413299111 (2014). [DOI] [PMC free article] [PubMed] [Google Scholar]
- 36.Loewer S et al. Large intergenic non-coding RNA-RoR modulates reprogramming of human induced pluripotent stem cells. Nat Genet 42, 1113–1117, doi:10.1038/ng.710 (2010). [DOI] [PMC free article] [PubMed] [Google Scholar]
- 37.Xie W et al. Epigenomic analysis of multilineage differentiation of human embryonic stem cells. Cell 153, 1134–1148, doi:10.1016/j.cell.2013.04.022 (2013). [DOI] [PMC free article] [PubMed] [Google Scholar]
- 38.Greenwald WW et al. Subtle changes in chromatin loop contact propensity are associated with differential gene regulation and expression. Nat Commun 10, 1054, doi:10.1038/s41467-019-08940-5 (2019). [DOI] [PMC free article] [PubMed] [Google Scholar]
- 39.Lengronne A et al. Cohesin relocation from sites of chromosomal loading to places of convergent transcription. Nature 430, 573–578, doi:10.1038/nature02742 (2004). [DOI] [PMC free article] [PubMed] [Google Scholar]
- 40.Busslinger GA et al. Cohesin is positioned in mammalian genomes by transcription, CTCF and Wapl. Nature 544, 503–507, doi:10.1038/nature22063 (2017). [DOI] [PMC free article] [PubMed] [Google Scholar]
- 41.Jacques PE, Jeyakani J & Bourque G The majority of primate-specific regulatory sequences are derived from transposable elements. PLoS Genet 9, e1003504, doi:10.1371/journal.pgen.1003504 (2013). [DOI] [PMC free article] [PubMed] [Google Scholar]
- 42.Barakat TS et al. Functional Dissection of the Enhancer Repertoire in Human Embryonic Stem Cells. Cell Stem Cell 23, 276–288 e278, doi:10.1016/j.stem.2018.06.014 (2018). [DOI] [PMC free article] [PubMed] [Google Scholar]
- 43.Wang J et al. Primate-specific endogenous retrovirus-driven transcription defines naive-like stem cells. Nature 516, 405–409, doi:10.1038/nature13804 (2014). [DOI] [PubMed] [Google Scholar]
- 44.Ng SY, Johnson R & Stanton LW Human long non-coding RNAs promote pluripotency and neuronal differentiation by association with chromatin modifiers and transcription factors. EMBO J 31, 522–533, doi:10.1038/emboj.2011.459 (2012). [DOI] [PMC free article] [PubMed] [Google Scholar]
- 45.Liu J, Li Y, Lin B, Sheng Y & Yang L HBL1 Is a Human Long Noncoding RNA that Modulates Cardiomyocyte Development from Pluripotent Stem Cells by Counteracting MIR1. Dev Cell 42, 333–348 e335, doi:10.1016/j.devcel.2017.07.023 (2017). [DOI] [PMC free article] [PubMed] [Google Scholar]
- 46.Koyanagi-Aoi M et al. Differentiation-defective phenotypes revealed by large-scale analyses of human pluripotent stem cells. Proc Natl Acad Sci U S A 110, 20569–20574, doi:10.1073/pnas.1319061110 (2013). [DOI] [PMC free article] [PubMed] [Google Scholar]
- 47.Goodchild NL, Wilkinson DA & Mager DL Recent evolutionary expansion of a subfamily of RTVL-H human endogenous retrovirus-like elements. Virology 196, 778–788, doi:10.1006/viro.1993.1535 (1993). [DOI] [PubMed] [Google Scholar]
- 48.Mager DL & Freeman JD HERV-H endogenous retroviruses: presence in the New World branch but amplification in the Old World primate lineage. Virology 213, 395–404, doi:10.1006/viro.1995.0012 (1995). [DOI] [PubMed] [Google Scholar]
- 49.Kijima TE & Innan H On the estimation of the insertion time of LTR retrotransposable elements. Mol Biol Evol 27, 896–904, doi:10.1093/molbev/msp295 (2010). [DOI] [PubMed] [Google Scholar]
- 50.Britten RJ & Davidson EH Repetitive and non-repetitive DNA sequences and a speculation on the origins of evolutionary novelty. Q Rev Biol 46, 111–138 (1971). [DOI] [PubMed] [Google Scholar]
- 51.King MC & Wilson AC Evolution at two levels in humans and chimpanzees. Science 188, 107–116 (1975). [DOI] [PubMed] [Google Scholar]
- 52.Chuong EB, Elde NC & Feschotte C Regulatory evolution of innate immunity through co-option of endogenous retroviruses. Science 351, 1083–1087, doi:10.1126/science.aad5497 (2016). [DOI] [PMC free article] [PubMed] [Google Scholar]
- 53.Wang Y et al. Endogenous miRNA sponge lincRNA-RoR regulates Oct4, Nanog, and Sox2 in human embryonic stem cell self-renewal. Dev Cell 25, 69–80, doi:10.1016/j.devcel.2013.03.002 (2013). [DOI] [PubMed] [Google Scholar]
- 54.De Cecco M et al. L1 drives IFN in senescent cells and promotes age-associated inflammation. Nature 566, 73–78, doi:10.1038/s41586-018-0784-9 (2019). [DOI] [PMC free article] [PubMed] [Google Scholar]
- 55.Kong Y et al. Transposable Element Expression In Tumors Is Associated With Immune Infiltration And Increased Antigenicity. bioRxiv (2018). [DOI] [PMC free article] [PubMed] [Google Scholar]
- 56.Reilly MT, Faulkner GJ, Dubnau J, Ponomarev I & Gage FH The role of transposable elements in health and diseases of the central nervous system. J Neurosci 33, 17577–17586, doi:10.1523/JNEUROSCI.3369-13.2013 (2013). [DOI] [PMC free article] [PubMed] [Google Scholar]
Methods-only references
- 57.Lian X et al. Directed cardiomyocyte differentiation from human pluripotent stem cells by modulating Wnt/beta-catenin signaling under fully defined conditions. Nature protocols 8, 162–175, doi:10.1038/nprot.2012.150 (2013). [DOI] [PMC free article] [PubMed] [Google Scholar]
- 58.Hashem SI et al. Brief Report: Oxidative Stress Mediates Cardiomyocyte Apoptosis in a Human Model of Danon Disease and Heart Failure. Stem cells 33, 2343–2350, doi:10.1002/stem.2015 (2015). [DOI] [PMC free article] [PubMed] [Google Scholar]
- 59.Shen Y et al. A map of the cis-regulatory sequences in the mouse genome. Nature 488, 116–120, doi:10.1038/nature11243 (2012). [DOI] [PMC free article] [PubMed] [Google Scholar]
- 60.Gorkin D et al. Systematic mapping of chromatin state landscapes during mouse development. bioRxiv (2017). [Google Scholar]
- 61.Jolma A et al. DNA-binding specificities of human transcription factors. Cell 152, 327–339, doi:10.1016/j.cell.2012.12.009 (2013). [DOI] [PubMed] [Google Scholar]
- 62.Yan J et al. Transcription factor binding in human cells occurs in dense clusters formed around cohesin anchor sites. Cell 154, 801–813, doi:10.1016/j.cell.2013.07.034 (2013). [DOI] [PubMed] [Google Scholar]
- 63.Liu Z et al. Efficient CRISPR/Cas9-Mediated Versatile, Predictable, and Donor-Free Gene Knockout in Human Pluripotent Stem Cells. Stem cell reports 7, 496–507, doi:10.1016/j.stemcr.2016.07.021 (2016). [DOI] [PMC free article] [PubMed] [Google Scholar]
- 64.Haeussler M et al. Evaluation of off-target and on-target scoring algorithms and integration into the guide RNA selection tool CRISPOR. Genome biology 17, 148, doi:10.1186/s13059-016-1012-2 (2016). [DOI] [PMC free article] [PubMed] [Google Scholar]
- 65.Kim S, Kim D, Cho SW, Kim J & Kim JS Highly efficient RNA-guided genome editing in human cells via delivery of purified Cas9 ribonucleoproteins. Genome research 24, 1012–1019, doi:10.1101/gr.171322.113 (2014). [DOI] [PMC free article] [PubMed] [Google Scholar]
- 66.Zuris JA et al. Cationic lipid-mediated delivery of proteins enables efficient protein-based genome editing in vitro and in vivo. Nature biotechnology 33, 73–80, doi:10.1038/nbt.3081 (2015). [DOI] [PMC free article] [PubMed] [Google Scholar]
- 67.Santos DP, Kiskinis E, Eggan K & Merkle FT Comprehensive Protocols for CRISPR/Cas9-based Gene Editing in Human Pluripotent Stem Cells. Current protocols in stem cell biology 38, 5B 6 1–5B 6 60, doi:10.1002/cpsc.15 (2016). [DOI] [PMC free article] [PubMed] [Google Scholar]
- 68.Radzisheuskaya A, Shlyueva D, Muller I & Helin K Optimizing sgRNA position markedly improves the efficiency of CRISPR/dCas9-mediated transcriptional repression. Nucleic Acids Res 44, e141, doi:10.1093/nar/gkw583 (2016). [DOI] [PMC free article] [PubMed] [Google Scholar]
- 69.Konermann S et al. Genome-scale transcriptional activation by an engineered CRISPR-Cas9 complex. Nature 517, 583–588, doi:10.1038/nature14136 (2015). [DOI] [PMC free article] [PubMed] [Google Scholar]
- 70.Xie S, Duan J, Li B, Zhou P & Hon GC Multiplexed Engineering and Analysis of Combinatorial Enhancer Activity in Single Cells. Mol Cell 66, 285–299 e285, doi:10.1016/j.molcel.2017.03.007 (2017). [DOI] [PubMed] [Google Scholar]
- 71.Ding S et al. Efficient transposition of the piggyBac (PB) transposon in mammalian cells and mice. Cell 122, 473–483, doi:10.1016/j.cell.2005.07.013 (2005). [DOI] [PubMed] [Google Scholar]
- 72.Meir YJ et al. Genome-wide target profiling of piggyBac and Tol2 in HEK 293: pros and cons for gene discovery and gene therapy. BMC Biotechnol 11, 28, doi:10.1186/1472-6750-11-28 (2011). [DOI] [PMC free article] [PubMed] [Google Scholar]
- 73.https://github.com/ENCODE-DCC/chip-seq-pipeline, <https://github.com/ENCODE-DCC/chip-seq-pipeline>
- 74.Li H & Durbin R Fast and accurate short read alignment with Burrows-Wheeler transform. Bioinformatics 25, 1754–1760, doi:10.1093/bioinformatics/btp324 (2009). [DOI] [PMC free article] [PubMed] [Google Scholar]
- 75. http://broadinstitute.github.io/picard/.
- 76.Zhang Y et al. Model-based analysis of ChIP-Seq (MACS). Genome biology 9, R137, doi:10.1186/gb-2008-9-9-r137 (2008). [DOI] [PMC free article] [PubMed] [Google Scholar]
- 77.Quinlan AR & Hall IM BEDTools: a flexible suite of utilities for comparing genomic features. Bioinformatics 26, 841–842, doi:10.1093/bioinformatics/btq033 (2010). [DOI] [PMC free article] [PubMed] [Google Scholar]
- 78.Ramirez F, Dundar F, Diehl S, Gruning BA & Manke T deepTools: a flexible platform for exploring deep-sequencing data. Nucleic Acids Res 42, W187–191, doi:10.1093/nar/gku365 (2014). [DOI] [PMC free article] [PubMed] [Google Scholar]
- 79.Dobin A et al. STAR: ultrafast universal RNA-seq aligner. Bioinformatics 29, 15–21, doi:10.1093/bioinformatics/bts635 (2013). [DOI] [PMC free article] [PubMed] [Google Scholar]
- 80.Liao Y, Smyth GK & Shi W featureCounts: an efficient general purpose program for assigning sequence reads to genomic features. Bioinformatics 30, 923–930, doi:10.1093/bioinformatics/btt656 (2014). [DOI] [PubMed] [Google Scholar]
- 81.Robinson MD, McCarthy DJ & Smyth GK edgeR: a Bioconductor package for differential expression analysis of digital gene expression data. Bioinformatics 26, 139–140, doi:10.1093/bioinformatics/btp616 (2010). [DOI] [PMC free article] [PubMed] [Google Scholar]
- 82.Durand NC et al. Juicebox Provides a Visualization System for Hi-C Contact Maps with Unlimited Zoom. Cell Syst 3, 99–101, doi:10.1016/j.cels.2015.07.012 (2016). [DOI] [PMC free article] [PubMed] [Google Scholar]
- 83.Heinz S et al. Simple combinations of lineage-determining transcription factors prime cis-regulatory elements required for macrophage and B cell identities. Mol Cell 38, 576–589, doi:10.1016/j.molcel.2010.05.004 (2010). [DOI] [PMC free article] [PubMed] [Google Scholar]
- 84.Ritchie ME et al. limma powers differential expression analyses for RNA-sequencing and microarray studies. Nucleic Acids Res 43, e47, doi:10.1093/nar/gkv007 (2015). [DOI] [PMC free article] [PubMed] [Google Scholar]
- 85.Casper J et al. The UCSC Genome Browser database: 2018 update. Nucleic Acids Res 46, D762–D769, doi:10.1093/nar/gkx1020 (2018). [DOI] [PMC free article] [PubMed] [Google Scholar]
- 86.Xu C & Corces VG Nascent DNA methylome mapping reveals inheritance of hemimethylation at CTCF/cohesin sites. Science 359, 1166–1170, doi:10.1126/science.aan5480 (2018). [DOI] [PMC free article] [PubMed] [Google Scholar]
- 87.DePristo MA et al. A framework for variation discovery and genotyping using next-generation DNA sequencing data. Nat Genet 43, 491–498, doi:10.1038/ng.806 (2011). [DOI] [PMC free article] [PubMed] [Google Scholar]
- 88.Selvaraj S, J RD., Bansal V. & Ren B. Whole-genome haplotype reconstruction using proximity-ligation and shotgun sequencing. Nat Biotechnol 31, 1111–1118, doi:10.1038/nbt.2728 (2013). [DOI] [PMC free article] [PubMed] [Google Scholar]
- 89.Edge P, Bafna V & Bansal V HapCUT2: robust and accurate haplotype assembly for diverse sequencing technologies. Genome Res 27, 801–812, doi:10.1101/gr.213462.116 (2017). [DOI] [PMC free article] [PubMed] [Google Scholar]
- 90.Greenwald WW et al. Pgltools: a genomic arithmetic tool suite for manipulation of Hi-C peak and other chromatin interaction data. BMC Bioinformatics 18, 207, doi:10.1186/s12859-017-1621-0 (2017). [DOI] [PMC free article] [PubMed] [Google Scholar]
- 91.Hu TT et al. The Arabidopsis lyrata genome sequence and the basis of rapid genome size change. Nat Genet 43, 476–481, doi:10.1038/ng.807 (2011). [DOI] [PMC free article] [PubMed] [Google Scholar]
- 92.Slotte T et al. The Capsella rubella genome and the genomic consequences of rapid mating system evolution. Nat Genet 45, 831–835, doi:10.1038/ng.2669 (2013). [DOI] [PubMed] [Google Scholar]
Associated Data
This section collects any data citations, data availability statements, or supplementary materials included in this article.
Supplementary Materials
Data Availability Statement
All sequencing datasets have been deposited on GEO with the accession number GSE116862.