

Abstract
Proteoforms, the primary effectors of biological processes, are the different forms of proteins that arise from molecular processing events such as alternative splicing and post-translational modifications. Heart diseases exhibit changes in proteoform levels, motivating the development of a deeper understanding of the heart proteoform landscape. Our recently developed two-dimensional top-down proteomics platform coupling serial size exclusion chromatography (sSEC) to reversed-phase chromatography (RPC) expanded coverage of the human heart proteome and allowed observation of high-molecular weight proteoforms. However, most of these observed proteoforms were not identified due to the difficulty in obtaining quality tandem mass spectrometry (MS2) fragmentation data for large proteoforms from complex biological mixtures on a chromatographic timescale. Herein, we sought to identify human heart proteoforms in this dataset using an enhanced version of Proteoform Suite, which identifies proteoforms by intact mass alone. Specifically, we added a new feature to Proteoform Suite to determine candidate identifications for isotopically-unresolved proteoforms larger than 50 kDa, enabling subsequent MS2 identification of important high-molecular weight human heart proteoforms such as lamin A (72 kDa) and trifunctional enzyme subunit α (79 kDa). With this new workflow for large proteoform identification, endogenous human cardiac myosin binding protein C (140 kDa) was identified for the first time. This study demonstrates the integration of the sSEC-RPC- MS proteomics platform with intact-mass analysis through Proteoform Suite to create a catalog of human heart proteoforms and facilitate the identification of large proteoforms in complex systems.
Keywords: top-down proteomics, proteoform, proteoform family, large proteoforms, heart
Graphical Abstract

Proteoforms are the different forms of proteins, which result from sources such as genetic variation, RNA editing and splicing, and post-translational modifications (PTMs).1 A proteoform family consists of the different proteoforms from a single gene.2 The identification and quantification of proteoforms are important to understanding biological systems because different proteoforms exhibit distinct biological functions.3–7 Altered proteoforms have been observed in heart disease, the leading cause of death worldwide, suggesting the importance of proteoform analysis to understanding cardiac dysfunction. 4, 8–9 Mass spectrometry-based top-down proteomics is the most powerful available tool for identification and quantification of proteoforms. In a typical top-down proteomic analysis, precursor mass spectra (MS1) of intact proteoforms are acquired, the most abundant peaks are selected for fragmentation, and tandem mass spectra (MS2) of the fragment ions are acquired.10 Top-down proteomic analysis of the human proteome is technically challenging due to its wide dynamic range and high complexity. Analysis of high-molecular weight (MW) proteoforms is particularly difficult because there is an exponential MS signal-to-noise ratio (S/N) decrease with increasing MW.11 Signal suppression due to the co-elution of highly abundant low-MW proteoforms imparts even more challenges for the analysis of high-MW proteoforms from complex mixtures. Thus, size-based separations are critical to observing and identifying high-MW proteoforms.
The Ge laboratory recently developed serial size exclusion chromatography (sSEC), which utilizes MS-compatible solvents for high resolution size-based fractionation of complex protein mixtures.12–13 sSEC fractionation was combined with online reversed-phase chromatography (RPC) in a two-dimensional (2D) separation platform and top-down proteomic analysis of human heart tissue lysate was performed on a quadrupole-time-of-flight (Q-TOF) mass spectrometer.12 Our 2D sSEC-RPC analysis resulted in the detection of 5360 proteoforms, with 47 proteoforms larger than 60 kDa. In this previous study, mostly MS1 data was acquired in order to profile the intact human heart proteome and determine high-MW candidates for subsequent targeted MS2 analysis, and targeted broadband MS2 data was acquired for a select set of high-MW proteoforms. Despite MS2 availability for 18 unique masses over 30 kDa, only two proteoforms were identified, creatine kinase (43 kDa) and trifunctional enzyme subunit beta (47 kDa), using the top-down search algorithm, MS-Align+. It is worth noting that these two proteoforms were isotopically resolved by the Q-TOF mass spectrometer, so the monoisotopic mass could be used for database searching. No proteoforms larger than 50 kDa were identified in the previous study, despite availability of acquired targeted MS2 data12. It is a recognized challenge in online LC-MS/MS top-down proteomics to obtain sufficient fragmentation ions for identification of proteins larger than 50 kDa.10, 14 Indeed, a number of issues challenged successful top-down proteomic analysis of larger proteoforms. Though sSEC-RPC separation allowed for the MS1 detection of larger heart proteoforms, proteoforms larger than 50 kDa were not isotopically resolved by the Q-TOF mass analyzer, which prevented the use of monoisotopic mass in top-down search algorithms. Furthermore, MS2 of larger proteoforms on an LC-MS timescale often provides sparse fragmentation and low S/N for fragment ions. Co-isolation of more than one charge state of a parent ion during the targeted MS2 acquisition was used to improve the fragmentation efficiency and fragment ion S/N.15 However, this strategy also increased the MS2 spectral complexity because these spectra included fragment ions from multiple, co-eluting proteoforms. Confident identification of large proteoforms typically also requires manual validation of the fragment ions from the MS2 spectra due to the complexity of the data. However, this process requires a candidate sequence to query. These challenges combined prevented identification of the proteoforms >50 kDa in the original study.
The Smith laboratory has recently developed the freely available and open-source software program Proteoform Suite (https://smith-chem-wisc.github.io/ProteoformSuite/), which uses MS1 intact-mass measurements to identify proteoforms by comparing the observed experimental proteoform masses to theoretical masses derived from a database and to co-eluting experimental proteoform masses.16–17 Proteoform Suite has been used to analyze proteomic datasets derived from S. cerevisiae16–17, E.coli18, and murine mitochondria19 on an Orbitrap mass spectrometer. Although MS1 measurements do not provide PTM localization and the false discovery rate is typically higher than for MS2 analyses, Proteoform Suite enables MS1 intact-mass identification of proteoforms that were either not selected for or unable to be identified by MS2 analysis.17, 19 For deconvolution results, Proteoform Suite can input any .tsv file with mass, intensity, and retention time columns, making it versatile for any instrument or deconvolution method of choice. We used Proteoform Suite here to identify human heart proteoforms in the top-down proteomic dataset described above. This study, which integrated MS-compatible size-based fractionation and intact-mass analysis, identified 409 proteoforms <50 kDa, with 80 proteoform masses between 30 and 50 kDa. Notably, we devised a workflow that combines two of our freely-available software tools, Proteoform Suite and MASH Suite Pro, to identify 13 proteoforms larger than 50 kDa (Supporting Figure S-1). We implemented a new feature in Proteoform Suite that determines theoretical candidates for isotopically-unresolved proteoforms larger than 50 kDa by intact-mass analysis. We then used MASH Suite Pro to deconvolute MS2 spectra and query fragment ions against the candidate sequences determined in Proteoform Suite. This workflow enabled identification of important large human heart proteoforms that were previously unidentified.
The experimental methods are reported in Supporting Information. Briefly, proteins were extracted from human heart tissue and fractionated by size using sSEC. Fractions were analyzed by RPC-Q-TOF-MS, and MS1 data were deconvoluted to determine observed masses. Separate analyses in Proteoform Suite version 0.3.5 (https://github.com/smith-chem-wisc/ProteoformSuite/releases/tag/0.3.5) were performed for proteoforms <50 kDa (isotopically-resolved and monoisotopic mass reported) and proteoforms >50 kDa (isotopically-unresolved and apex of the charge-state deconvoluted peak reported). Proteoforms >50 kDa were not isotopically-resolved on the Q-TOF mass spectrometer; therefore, deconvolution could not provide the monoisotopic mass. Instead, the mass at the apex of the charge-state deconvoluted spectrum was reported, which is close to the average mass of the proteoform.20 The average mass for each proteoform in the theoretical database was determined from the chemical formula. We enabled Proteoform Suite to identify candidates for high-MW proteoforms by implementing a notch search21 against the theoretical database using the average mass with a 2 Da mass tolerance. The 2 Da tolerance was chosen to be wide enough to capture the apex of the observed unresolved isotopic envelopes, while rejecting most theoretical proteoform matches.
In the analysis of proteoforms <50 kDa, there were 2253 unique experimental proteoforms, 409 of which were identified by Proteoform Suite at 7.5% FDR (Supporting Table S-1 and Supporting Figure S-2). An experimental proteoform corresponds to a mass observed in the deconvoluted MS1 spectrum, after applying the intensity cutoff and aggregation described in the Supporting Information. As previously discussed16–17, 19, Proteoform Suite can currently only calculate a global FDR for intact-mass identifications because individual identifications are unable to be scored. There were also 45 ambiguous identifications, which matched to more than one proteoform identification (Supporting Table S-2). The remaining 1799 experimental proteoforms were unidentified, meaning they either did not form an accepted experimental-theoretical relation or did not match identification criteria16. The 409 identified experimental proteoforms were derived from 268 unique proteins (the number of unique accessions, see Supporting Table S-1). Proteoform families were constructed in Proteoform Suite from accepted mass differences between theoretical and experimental proteoforms (Supporting Figure S-3) as described previously.2, 16–17 A summary of the experimental proteoforms and proteoform families from the <50 kDa analysis is shown in Supporting Figure S-2. Examples of proteoform families and the charge-state deconvoluted MS1 spectra for heart proteoforms derived from the genes LASP1, CRIP2, HMGN1, and HSPB1 are shown in Supporting Figure S-3.
Previously published Proteoform Suite analyses were performed on samples separated by size using gel-eluted liquid fraction entrapment electrophoresis (GELFrEE) prior to RPC-MS analysis with an Orbitrap mass spectrometer, and the largest proteoform identified by intact-mass analysis was 31 kDa.17 Here, we used Proteoform Suite to analyze sSEC-fractionated data acquired using a Q-TOF mass spectrometer, and identified 80 proteoforms between 30 and 50 kDa. A histogram of identified experimental proteoform masses is shown in Supporting Figure S-4. The <50 kDa intact-mass analysis identified many heart proteoform families >30 kDa that are critical to heart function, including creatine kinases and actin isoforms (see Supporting Information and Supporting Figure S-5).
In the >50 kDa analysis, Proteoform Suite found at least one theoretical proteoform candidate for 36 experimental proteoforms (Supporting Table S-3), 30 of which had more than one theoretical match. The FDR obtained for the >50 kDa analysis was quite large, 82.7%, due to the wide 2 Da search tolerance, which results in a high chance of matching with a decoy proteoform mass. Given this high FDR, we do not consider these experimental proteoforms to have been identified, but rather to be candidates for subsequent analysis of the available targeted MS2 data.
The proteoform candidates determined in this manner were used to guide MS2 data analysis in order to identify proteoforms. For example, a co-eluting group of 65 kDa and 72 kDa proteoforms (Figure 1A) had previously been targeted by broadband co-isolation and collisionally activated dissociation but were not able to be identified with a typical database search in MS-Align+, likely due to the use of average precursor mass in place of monoisotopic mass and the MS2 spectral complexity due to daughter ions originating from multiple parent ions. By intact-mass analysis, Proteoform Suite determined the theoretical candidate for the group of 72 kDa proteoforms to be acetylated lamin A (gene LMNA), including both mono- and bis- phosphorylated proteoforms. Proteoforms in the LMNA gene family are intermediate filament proteins, which make up the nuclear lamina.22 Since changes to LMNA phosphorylation have been linked to cardiomyopathies, it is important that we can detect and quantify these specific proteoforms in the heart.22–23 We used MASH Suite Pro to query the MS2 fragments against the LMNA sequence determined by Proteoform Suite, and we confirmed the identity of the acetylated lamin A proteoform with both N-terminal and C-terminal sequence tags that were manually validated in the raw data, as previously described24 (Figure 1B). The lamin A identifications led us to hypothesize that the three co-eluting 65 kDa proteoforms were three proteoforms from the lamin C isoform from gene LMNA: acetylated, acetylated and mono-phosphorylated, and acetylated and bis-phosphorylated. Likewise, we used the same MS2 spectrum to confirm the identification of the lamin C isoform with a C-terminal sequence tag (Figure 1C, Supporting Figure S-6 ). Lamin C had not been identified as a candidate for the 65 kDa proteoforms in Proteoform Suite because it was absent in the theoretical database downloaded from UniProt, which contained only canonical protein sequences. This study demonstrates how intact-mass analysis in Proteoform Suite can guide MS2 analysis to enable the identification of isotopically-unresolved proteoforms >50 kDa. A full list of validated MS2 fragment ions for lamin A and lamin C can be found in Supporting Tables S-4.1 – S-4.4.
Figure 1.

A) Charge-state deconvoluted MS1 spectra for lamin A and lamin C isoforms of LMNA (fraction 5, 28–29.3 min). Proteoform Suite identified three candidate proteoforms from the lamin A isoform: with acetylation alone, with both acetylation and mono-phosphorylation, and with both acetylation and bis-phosphorylation. Three additional co-eluting masses were also observed in the same retention window. Data from two MS2 experiments (15 eV and 20 eV CAD energies) were combined to generate sequence tables shown in panels B) and C). B) Lamin A isoform sequence with matching MS2 fragments and highlighted C-terminal sequence tag (pink). Zoom-in of a representative MS2 spectrum (15 eV CAD) from 910–970 m/z shows y-ions corresponding to the lamin A C-terminal sequence tag. C) Lamin C isoform sequence with matching MS2 fragments and highlighted C-terminal sequence tag (blue). Zoom-in of a representative MS2 spectrum (15 eV CAD) from 870–910 m/z shows y-ions corresponding to the lamin C C-terminal sequence tag. Additional zoom-in of the MS2 spectrum for the highlighted fragment ions are found in Supporting Figure S-6.
Proteoform Suite determined that two observed 79 kDa proteoforms closely matched the unmodified and succinylated trifunctional enzyme subunit α (gene HADHA). Similarly, we used a previously acquired targeted MS2 spectrum to confirm this candidate identification (Supporting Figure S-7B and S-7D). Proteoform Suite also identified trifunctional enzyme subunit β in the <50 kDa analysis (47 kDa, gene HADHB), which was validated with targeted MS2 analysis in our previous study (Supporting Figure S-7A and S-7C, Supporting Tables S-4.5 and S-4.6).12 Upon inspection of the charge-state deconvoluted MS1 spectrum for trifunctional enzyme subunit β, we observed a peak shifted by +100 Da from the unmodified proteoform, which likely corresponds to its succinylated proteoform.
Proteoform Suite identified candidate proteoforms for cardiac myosin binding protein C (cMyBP-C, 140 kDa) encoded by MYBPC3 gene, and myosin heavy chain (MHC, 223 kDa) encoded by MYH7 gene, two major constituents of the cardiac sarcomere. Examination of previously acquired MS2 data against the full-length cMyBP-C sequence (aa 1–1274) determined by Proteoform Suite revealed matching y-ions from the C-terminus. Proteoform Suite also identified a proteoform candidate as bis-phosphorylated cMyBP-C with methionine cleaved (aa 2–1274). Matching the MS2 data against the methionine-cleaved cMyBP-C sequence revealed matching b-ions and an N-terminal sequence tag (Figure 2, Supporting Table S4.7). Other co-eluting intact masses indicate mono-phosphorylated full-length, mono-phosphorylated methionine-cleaved, and tris-phosphorylated methionine-cleaved cMyBP-C proteoforms. The recombinant cMyBP-C had previously been studied by Ge et al25, however we report for the first time the identification of the endogenous proteoform from human heart tissue. This proteoform identification is highly relevant to the study of heart function and dysfunction because phosphorylation of cMyBP-C plays a key role in regulating heart contraction and relaxation.26 While MS2 data was not available for the verification of the candidate 223 kDa proteoform, MHC is a known major constituent of the cardiac sarcomere and has been previously identified in mouse heart tissue lysate by bottom-up MS/MS data.27
Figure 2.
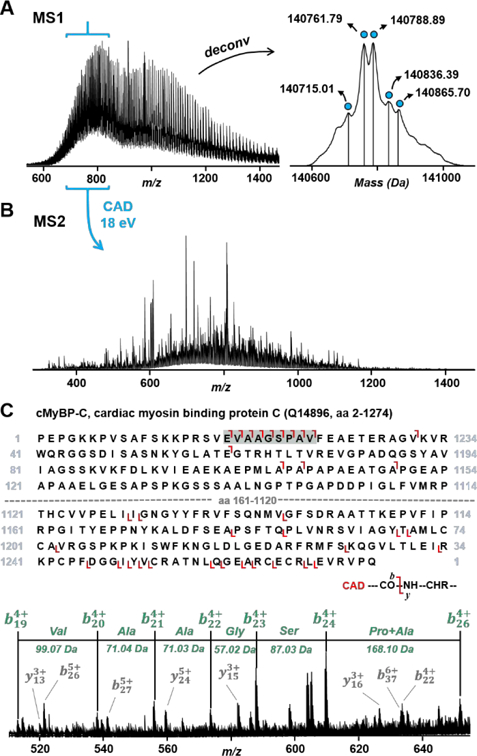
A) Original and charge-state deconvoluted MS1 spectra for the cMyBP-C proteoforms (fraction 4, RT 33–35 min). B) MS2 spectrum acquired by co-isolating all charge states in the 700–800 m/z range over the protein elution window (CAD energy 18 eV). C) Sequence for cMyBP-C with methionine cleaved with matching b- and y- fragment ions and highlighted (green) N-terminal sequence tag. Zoom-in of the MS2 spectrum between 520–650 m/z shows b-ions corresponding to the highlighted N-terminal sequence tag (green) and other ions in the zoom-in spectrum that match to the proteoform sequence (grey).
There are top-down search software programs available that allow precursor mass searches with average mass instead of the monoisotopic mass, such as ProsightPC and ProsightPTM28, which was also able to identify the full-length cMyBP-C proteoform when the precursor and fragment masses were input manually. Another approach to identify high-MW proteoforms uses ultra-high-resolution mass spectrometers, such as the FT-ICR mass spectrometers4, 9, 13, 25, 29–32, to isotopically resolve high-MW proteoforms and thereby facilitate their identification by monoisotopic mass analysis. The intact-mass analysis method we present here makes top-down analysis of larger proteoforms in complex samples accessible to laboratories with access to more widely available instrument platforms. Due to the difficulty in obtaining high-quality MS2 spectra of large proteoforms, particularly on an LC-MS time scale, both the acquisition and analysis of MS2 data performed in MASH Suite Pro are targeted techniques. In this study, we only reported >50 kDa proteoform identifications if a manually-validated sequence tag was obtained. Analysis in Proteoform Suite is more automated and amenable to large-scale analyses, but intact-mass analysis does not provide identifications with as much confidence as MS2 data, particularly in isotopically unresolved data and in complex systems such as human heart tissue. 12 However, as identified proteoforms are increasingly catalogued in repositories such as the Consortium for Top-Down Proteomics Proteoform Atlas (http://atlas.topdownproteomics.org/), the ability to automatically match intact masses with candidate theoretical proteoforms will facilitate both qualitative and quantitative proteoform analyses. We also note a major benefit of intact-mass analysis and proteoform family construction is its potential use for guided targeted MS2 data acquisition. If an intact mass is matched to a candidate proteoform with biologically interesting PTMs or from a gene of interest, subsequent targeted MS2 analysis can be performed on the sample. Additionally, the experimental-experimental comparison can reveal unidentified proteoform families of interest (e.g., those with multiple phosphorylation events), that can be followed-up with targeted MS2 analysis.
CONCLUSIONS
We used the open-source and freely available software program Proteoform Suite to identify proteoforms by intact mass in a dataset of serial size exclusion chromatography-separated fractions of human heart tissue lysate. Proteoform Suite identified 409 unique proteoforms <50 kDa, with 80 identified proteoforms of 30–50 kDa, whereas the largest proteoform identified by intact mass in previous Proteoform Suite analyses was 31 kDa. While sSEC fractionation had enabled 45 unique experimental proteoforms >50 kDa to be observed in a previous top-down study, the high-MW candidates which were targeted for MS2 in that work were left unidentified by a conventional top-down search algorithm due to either excessive spectral complexity or inefficient fragmentation. Proteoform Suite determined theoretical candidates for many of these proteoforms, some of which were subsequently confirmed with previously acquired targeted MS2 data. The integration of the MS-compatible sSEC proteomics platform with intact-mass analysis through Proteoform Suite enabled identification of many important human heart proteoforms and proteoform families. Proteoform Suite can identify proteoform candidates for subsequent targeted MS2 analysis and proteoform quantification, making it a valuable tool for top-down proteomics.
Supplementary Material
ACKNOWLEDGMENTS
This work was supported by the National Institute of General Medical Sciences of the National Institutes of Health (NIH) under Award Number R35GM126914 to LMS and R01HL109810, R01HL096971, R01 GM125085, S10 OD018475 to YG. LVS was supported by the NIH Biotechnology Training Program, T32GM008349. TT was supported by the NIH Chemistry Biology Interface Training Program, T32GM008505. We thank Yunxiang Dai and Emma Schaffer for contributing to our table of contents graphic.
Footnotes
SUPPORTING INFORMATION. Experimental Methods; Proteoform Suite Identifications <50 kDa; Supporting Figure S-1: of Workflow developed for identification of isotopically-unresolved large proteoforms >50 kDa;: Supporting Figure S-2: Summary of Proteoforms and Proteoform Families; Supporting Figure S-3: Human heart proteoform families <50 kDa; Supporting Figure S-4: Molecular Weight Distribution for Identified Proteoforms <50 kDa; Supporting Figure S-5: Deconvoluted MS1 Spectra Creatine Kinase Isoforms identified by Proteoform Suite; Supporting Figure S-6: C-terminal fragment ions for LMNA proteoforms; Supporting Figure S-7: MS2 Validation of Trifunctional Enzyme Subunits α and β; Supporting Figure S-8: Experimental-Experimental Delta Mass Histograms; Table S-1: Identified Experimental Proteoforms <50 kDa; Table S-2: Ambiguous Experimental Proteoforms <50 kDa; Table S-3: Candidates for Experimental Proteoforms >50 kDa; Table S-4: eTHRASH Extracted MS2 Ions for >50 kDa Proteoform Identifications; Table S-5: Theoretical Proteoform Database; Table S-6: Accepted Experimental-Theoretical and Experimental-Experimental Peaks.
The authors declare no competing financial interests.
REFERENCES
- 1.Smith LM; Kelleher NL; Consortium for Top Down Proteomics, Proteoform: a single term describing protein complexity. Nat Methods 2013, 10 (3), 186–7. [DOI] [PMC free article] [PubMed] [Google Scholar]
- 2.Shortreed MR; Frey BL; Scalf M; Knoener RA; Cesnik AJ; Smith LM, Elucidating Proteoform Families from Proteoform Intact-Mass and Lysine-Count Measurements. J Proteome Res 2016, 15 (4), 1213–21. [DOI] [PMC free article] [PubMed] [Google Scholar]
- 3.Jin Y; Peng Y; Lin Z; Chen YC; Wei L; Hacker TA; Larsson L; Ge Y, Comprehensive analysis of tropomyosin isoforms in skeletal muscles by top-down proteomics. J Muscle Res Cell Motil 2016, 37 (1–2), 41–52. [DOI] [PMC free article] [PubMed] [Google Scholar]
- 4.Zhang J; Guy MJ; Norman HS; Chen YC; Xu Q; Dong X; Guner H; Wang S; Kohmoto T; Young KH; Moss RL; Ge Y, Top-down quantitative proteomics identified phosphorylation of cardiac troponin I as a candidate biomarker for chronic heart failure. J Proteome Res 2011, 10 (9), 4054–65. [DOI] [PMC free article] [PubMed] [Google Scholar]
- 5.Tvardovskiy A; Wrzesinski K; Sidoli S; Fey SJ; Rogowska-Wrzesinska A; Jensen ON, Top-down and Middle-down Protein Analysis Reveals that Intact and Clipped Human Histones Differ in Post-translational Modification Patterns. Mol Cell Proteomics 2015, 14 (12), 3142–53. [DOI] [PMC free article] [PubMed] [Google Scholar]
- 6.Mylona A; Theillet FX; Foster C; Cheng TM; Miralles F; Bates PA; Selenko P; Treisman R, Opposing effects of Elk-1 multisite phosphorylation shape its response to ERK activation. Science 2016, 354 (6309), 233–237. [DOI] [PMC free article] [PubMed] [Google Scholar]
- 7.Yang X; Coulombe-Huntington J; Kang S; Sheynkman GM; Hao T; Richardson A; Sun S; Yang F; Shen YA; Murray RR; Spirohn K; Begg BE; Duran-Frigola M; MacWilliams A; Pevzner SJ; Zhong Q; Trigg SA; Tam S; Ghamsari L; Sahni N; Yi S; Rodriguez MD; Balcha D; Tan G; Costanzo M; Andrews B; Boone C; Zhou XJ; Salehi-Ashtiani K; Charloteaux B; Chen AA; Calderwood MA; Aloy P; Roth FP; Hill DE; Iakoucheva LM; Xia Y; Vidal M, Widespread Expansion of Protein Interaction Capabilities by Alternative Splicing. Cell 2016, 164 (4), 805–17. [DOI] [PMC free article] [PubMed] [Google Scholar]
- 8.Cai W; Tucholski TM; Gregorich ZR; Ge Y, Top-down Proteomics: Technology Advancements and Applications to Heart Diseases. Expert Rev Proteomics 2016, 13 (8), 717–30. [DOI] [PMC free article] [PubMed] [Google Scholar]
- 9.Peng Y; Gregorich ZR; Valeja SG; Zhang H; Cai W; Chen YC; Guner H; Chen AJ; Schwahn DJ; Hacker TA; Liu X; Ge Y, Top-down proteomics reveals concerted reductions in myofilament and Z-disc protein phosphorylation after acute myocardial infarction. Mol Cell Proteomics 2014, 13 (10), 2752–64. [DOI] [PMC free article] [PubMed] [Google Scholar]
- 10.Schaffer LV; Millikin RJ; Miller RM; Anderson LC; Fellers RT; Ge Y; Kelleher NL; LeDuc RD; Liu X; Payne SH; Sun L; Thomas PM; Tucholski T; Wang Z; Wu S; Wu Z; Yu D; Shortreed MR; Smith LM, Identification and Quantification of Proteoforms by Mass Spectrometry. Proteomics 2019, e1800361. [DOI] [PMC free article] [PubMed]
- 11.Compton PD; Zamdborg L; Thomas PM; Kelleher NL, On the scalability and requirements of whole protein mass spectrometry. Analytical chemistry 2011, 83 (17), 6868–74. [DOI] [PMC free article] [PubMed] [Google Scholar]
- 12.Cai W; Tucholski T; Chen B; Alpert AJ; McIlwain S; Kohmoto T; Jin S; Ge Y, Top-Down Proteomics of Large Proteins up to 223 kDa Enabled by Serial Size Exclusion Chromatography Strategy. Analytical chemistry 2017, 89 (10), 5467–5475. [DOI] [PMC free article] [PubMed] [Google Scholar]
- 13.Tucholski T; Knott SJ; Chen B; Pistono P; Lin Z; Ge Y, A Top-Down Proteomics Platform Coupling Serial Size Exclusion Chromatography and Fourier Transform Ion Cyclotron Resonance Mass Spectrometry. Analytical chemistry 2019, 91 (6), 3835–3844. [DOI] [PMC free article] [PubMed] [Google Scholar]
- 14.Chen B; Brown KA; Lin Z; Ge Y, Top-Down Proteomics: Ready for Prime Time? Analytical chemistry 2018, 90 (1), 110–127. [DOI] [PMC free article] [PubMed] [Google Scholar]
- 15.Chanthamontri C; Liu J; McLuckey SA, Charge State Dependent Fragmentation of Gaseous alpha-Synuclein Cations via Ion Trap and Beam-Type Collisional Activation. Int J Mass Spectrom 2009, 283 (1–3), 9–16. [DOI] [PMC free article] [PubMed] [Google Scholar]
- 16.Cesnik AJ; Shortreed MR; Schaffer LV; Knoener RA; Frey BL; Scalf M; Solntsev SK; Dai Y; Gasch AP; Smith LM, Proteoform Suite: Software for Constructing, Quantifying, and Visualizing Proteoform Families. J Proteome Res 2018, 17 (1), 568–578. [DOI] [PMC free article] [PubMed] [Google Scholar]
- 17.Schaffer LV; Shortreed MR; Cesnik AJ; Frey BL; Solntsev SK; Scalf M; Smith LM, Expanding Proteoform Identifications in Top-Down Proteomic Analyses by Constructing Proteoform Families. Analytical chemistry 2018, 90 (2), 1325–1333. [DOI] [PMC free article] [PubMed] [Google Scholar]
- 18.Dai Y; Shortreed MR; Scalf M; Frey BL; Cesnik AJ; Solntsev S; Schaffer LV; Smith LM, Elucidating Escherichia coli Proteoform Families Using Intact-Mass Proteomics and a Global PTM Discovery Database. J Proteome Res 2017, 16 (11), 4156–4165. [DOI] [PMC free article] [PubMed] [Google Scholar]
- 19.Schaffer LV; Rensvold JW; Shortreed MR; Cesnik AJ; Jochem A; Scalf M; Frey BL; Pagliarini DJ; Smith LM, Identification and Quantification of Murine Mitochondrial Proteoforms Using an Integrated Top-Down and Intact-Mass Strategy. J Proteome Res 2018, 17 (10), 3526–3536. [DOI] [PMC free article] [PubMed] [Google Scholar]
- 20.Covey TR; Bonner RF; Shushan BI; Henion J, The determination of protein, oligonucleotide and peptide molecular weights by ion-spray mass spectrometry. Rapid Commun Mass Spectrom 1988, 2 (11), 249–56. [DOI] [PubMed] [Google Scholar]
- 21.Solntsev SK; Shortreed MR; Frey BL; Smith LM, Enhanced Global Post-translational Modification Discovery with MetaMorpheus. J Proteome Res 2018, 17 (5), 1844–1851. [DOI] [PubMed] [Google Scholar]
- 22.Snider NT; Omary MB, Post-translational modifications of intermediate filament proteins: mechanisms and functions. Nat Rev Mol Cell Biol 2014, 15 (3), 163–77. [DOI] [PMC free article] [PubMed] [Google Scholar]
- 23.Mitsuhashi H; Hayashi YK; Matsuda C; Noguchi S; Wakatsuki S; Araki T; Nishino I, Specific phosphorylation of Ser458 of A-type lamins in LMNA-associated myopathy patients. J Cell Sci 2010, 123 (Pt 22), 3893–900. [DOI] [PubMed] [Google Scholar]
- 24.Cai W; Guner H; Gregorich ZR; Chen AJ; Ayaz-Guner S; Peng Y; Valeja SG; Liu X; Ge Y, MASH Suite Pro: A Comprehensive Software Tool for Top-Down Proteomics. Mol Cell Proteomics 2016, 15 (2), 703–14. [DOI] [PMC free article] [PubMed] [Google Scholar]
- 25.Ge Y; Rybakova IN; Xu Q; Moss RL, Top-down high-resolution mass spectrometry of cardiac myosin binding protein C revealed that truncation alters protein phosphorylation state. Proc Natl Acad Sci U S A 2009, 106 (31), 12658–63. [DOI] [PMC free article] [PubMed] [Google Scholar]
- 26.Flashman E; Redwood C; Moolman-Smook J; Watkins H, Cardiac myosin binding protein C: its role in physiology and disease. Circ Res 2004, 94 (10), 1279–89. [DOI] [PubMed] [Google Scholar]
- 27.Zhang J; Roth MJ; Chang AN; Plymire DA; Corbett JR; Greenberg BM; Patrie SM, Top-down mass spectrometry on tissue extracts and biofluids with isoelectric focusing and superficially porous silica liquid chromatography 2013, 85. [DOI] [PubMed] [Google Scholar]
- 28.Zamdborg L; LeDuc RD; Glowacz KJ; Kim YB; Viswanathan V; Spaulding IT; Early BP; Bluhm EJ; Babai S; Kelleher NL, ProSight PTM 2.0: improved protein identification and characterization for top down mass spectrometry. Nucleic Acids Res 2007, 35 (Web Server issue), W701–6. [DOI] [PMC free article] [PubMed] [Google Scholar]
- 29.Anderson LC; DeHart CJ; Kaiser NK; Fellers RT; Smith DF; Greer JB; LeDuc RD; Blakney GT; Thomas PM; Kelleher NL; Hendrickson CL, Identification and Characterization of Human Proteoforms by Top-Down LC-21 Tesla FT-ICR Mass Spectrometry. J Proteome Res 2017, 16 (2), 1087–1096. [DOI] [PMC free article] [PubMed] [Google Scholar]
- 30.Hendrickson CL; Quinn JP; Kaiser NK; Smith DF; Blakney GT; Chen T; Marshall AG; Weisbrod CR; Beu SC, 21 Tesla Fourier Transform Ion Cyclotron Resonance Mass Spectrometer: A National Resource for Ultrahigh Resolution Mass Analysis. J Am Soc Mass Spectrom 2015, 26 (9), 1626–32. [DOI] [PubMed] [Google Scholar]
- 31.Tran JC; Zamdborg L; Ahlf DR; Lee JE; Catherman AD; Durbin KR; Tipton JD; Vellaichamy A; Kellie JF; Li M; Wu C; Sweet SM; Early BP; Siuti N; LeDuc RD; Compton PD; Thomas PM; Kelleher NL, Mapping intact protein isoforms in discovery mode using top-down proteomics. Nature 2011, 480 (7376), 254–8. [DOI] [PMC free article] [PubMed] [Google Scholar]
- 32.Chen YC; Ayaz-Guner S; Peng Y; Lane NM; Locher M; Kohmoto T; Larsson L; Moss RL; Ge Y, Effective top-down LC/MS+ method for assessing actin isoforms as a potential cardiac disease marker. Analytical chemistry 2015, 87 (16), 8399–8406. [DOI] [PMC free article] [PubMed] [Google Scholar]
Associated Data
This section collects any data citations, data availability statements, or supplementary materials included in this article.