

Abstract
Sarcomeric proteins, including myofilament and Z-disc proteins, play critical roles in regulating muscle contractile properties. A variety of isoforms and post-translational modifications (PTMs) of sarcomeric proteins have been shown to be associated with modulation of muscle functions and the occurrence of muscle diseases. Non-human primates (NHPs) are excellent research models for sarcopenia, a disease associated with alterations in sarcomeric proteins, due to their marked similarities to humans. However, the sarcomeric proteins in NHP skeletal muscle have not been well characterized. To gain a deeper understanding of sarcomeric proteins in NHP skeletal muscle, we employed top-down mass spectrometry (MS) to conduct a comprehensive analysis on isoforms and PTMs of sarcomeric proteins in rhesus macaque skeletal muscle. We identified 23 protein isoforms with 46 proteoforms of sarcomeric proteins, including 6 isoforms with 18 proteoforms from fast skeletal troponin T. Particularly, for the first time, a novel PDZ/LIM domain protein isoform, PDLIM7, was characterized with a newly identified protein sequence. Moreover, we also identified multiple PTMs on these proteins, including deamidation, methylation, acetylation, tri-methylation, phosphorylation and S-glutathionylation. Most PTM sites were localized, including Asn13 deamidation on MLC-2S, His73 methylation on αactin, N-terminal acetylation on most identified proteins, N-terminal tri-methylation on MLC-1S, MLC-1F, MLC-2S and MLC-2F, Ser14 phosphorylation on MLC-2S, Ser15 and Ser16 phosphorylation on MLC-2F. In summary, a comprehensive characterization of sarcomeric proteins including multiple isoforms and PTMs in NHP skeletal muscle was achieved by analyzing intact proteins in the top-down MS approach.
Keywords: Post-translational modifications, Top-down mass spectrometry, Sarcomeric proteins
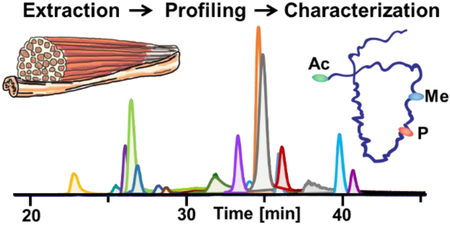
Graphical Abstract
Introduction
The sarcomere is the basic contractile unit of striated muscle, consisting of interdigitating thick and thin myofilaments that extend between successive Z-discs to convert chemical energy into mechanical energy for muscle contraction and relaxation [1-3]. Myofilaments and Z-discs contain a variety of sarcomeric proteins. The thin filament consists primarily of actin along with regulatory protein complexes, tropomyosin (Tpm) and troponin complex (TnT, TnI, and TnC). The thick filament is mainly composed of myosin heavy chains and light chains (MLCs), along with myosin binding protein C [4]. In Z-disc, apart from the primary α-actinin and cap-Z, PDZ domain proteins, LIM domain proteins, and PDZ/LIM domain proteins have also been discovered [5, 6]. These sarcomeric proteins are expressed in highly homologous isoforms arising from multiple genes, in the presence of various proteoforms [7] produced by the same gene via alternative RNA splicing and post-translational modifications (PTMs) [8, 9]. The protein isoforms and PTMs are associated with muscle contractile properties and thus the whole muscle performance [10, 11]. Both slow- and fast-twitch skeletal muscles express different isoforms of sarcomeric proteins [12]. Recently, Gregorich el al. found that a decrease in MLC2 phosphorylation in rat skeletal muscle results in sarcopenic muscle dysfunction [13]. Moreover, the phosphorylation level change of some Z-disc proteins was reported to be related to sarcopenia in rat fast- and slow-twitch skeletal muscle [14].
Non-human primates (NHPs) are excellent research models for sarcopenia, a disease associated with alterations in sarcomeric proteins [13, 14]. due to their marked similarities to humans [15-17]. However, the isoforms and PTMs of NHP sarcomeric proteins are still not well characterized. Conventionally, bottom-up mass spectrometry (MS) has been employed in the analysis of sarcomeric proteins in skeletal muscles [18-20]. However, the identification and characterization of protein isoforms and PTMs remain challenging owing to high amino acid sequence homology of protein isoforms and complex PTM patterns. Herein, to gain a comprehensive characterization of protein isoforms and PTMs, we used top-down MS to analyze the sarcomeric proteins in NHP skeletal muscle. Different from traditional bottom-up MS that analyzes peptides resulting from digestion, top-down MS [21] analyzes intact proteins without digestion, which provides a comprehensive view of all the isoforms and proteoforms and avoids the potential protein isoform/PTM-specific information loss that commonly occurs with the bottom-up approach [22, 23]. The subsequent tandem MS (MS/MS) analysis allows further detailed characterization of protein sequences and localization of PTM sites.
In our study, we identified 23 protein isoforms with 46 proteoforms of sarcomeric proteins in NHP skeletal muscle. Among them, 6 isoforms with 18 proteoforms were identified as fast-skeletal TnT (fsTnT). In particular, we identified a novel PDLIM7 protein isoform and comprehensively characterized its sequence for the first time. Importantly, PTMs including deamidation, methylation, acetylation, tri-methylation, phosphorylation and S-glutathionylation have been detected for various skeletal muscle sarcomeric proteins. Most PTMs were further characterized by MS/MS for site localization, including Asn13 deamidation on MLC-2S, His73 methylation on αactin, N-terminal acetylation on most identified proteins, N-terminal tri-methylation on MLC-1S, MLC-1F, MLC-2S and MLC-2F, Ser14 phosphorylation on MLC-2S, Ser15 and Ser16 phosphorylation on MLC-2F.
Materials and Methods
Chemical and Reagents
All reagents were purchased from MilliporeSigma (St Louis, MO, USA) and Fisher Scientific (Fair Lawn, NJ, USA) unless noted otherwise. All solutions were prepared with HPLC grade water (Fisher Scientific, Fair Lawn, NJ, USA).
Skeletal Muscle Tissue Samples
Biopsy samples of skeletal muscle vastus lateralis (VL) tissue were collected from rhesus macaques at the Wisconsin National Primate Research Center according to the protocols approved by the Institutional Animal Care and Use Committee of the University of Wisconsin-Madison. The muscle tissues were flash frozen immediately in liquid nitrogen after dissection and stored at −80 °C.
Sarcomeric Protein Extraction
Approximately 5 mg of rhesus macaque skeletal muscle tissue was homogenized in 50 μL of HEPES extraction buffer (25 mM HEPES pH 7.4, 2.5 mM EDTA, 50 mM NaF, 2 mM Na3VO4, 1 mM PMSF in isopropanol) using a Teflon pestle (1.5 mL microcentrifuge tube, flat tip, Thomas Scientific, Swedesboro, NJ, USA) to extract cytosolic proteins. The homogenate was centrifuged for 20 min at 16,100 rcf, 4 °C (Sorvall Legend Micro 21R, Thermo Fisher Scientific, Am Kalkbarg, Germany) and the supernatant was discarded. The pellet left was then resuspended and further homogenized in 50 μL of TFA extraction solution (1% TFA, 10 mM TCEP) to extract sarcomeric proteins. The homogenate was centrifuged for 20 min at 16,100 rcf, 4 °C. The resulting supernatant was saved and then centrifuged for an additional 20 min at 16,100 rcf, 4 °C to completely remove pellet prior to liquid chromatography (LC)/MS analysis.
Online LC/MS for Protein Profiling
The sarcomeric protein mixture extracted from VL muscle tissue was separated by reverse phase chromatography (RPC) using a home-packed reversed-phased column (PLRP-S, 200 mm length × 500 μm id, 10 μm particle size, 1,000 Å pore size, Agilent). The RPC separation was performed in a 60 min gradient with mobile phase B increases from 5% to 95% (Mobile phase A: 0.1% formic acid (FA) in water, Mobile phase B: 0.1% FA in 1:1 ethanol:acetonitrile) in a nanoACQUITY UPLC system (Waters, Milford, MA, USA). The nanoACQUITY UPLC system was coupled to an impact II quadrupole-time-of-flight (q-TOF) mass spectrometer (Bruker, Bremen, Germany) for online LC/MS analysis. Mass spectra were collected at 1 Hz over a 500–3000 m/z range.
High-resolution MS/MS for Protein Characterization
In addition to online LC/MS analysis, the eluates of some sarcomeric proteins from RPC separation were also collected for offline MS/MS analysis to achieve a comprehensive characterization of the protein sequences and PTMs. The collected protein fractions were analyzed by a 12 T solariX Fourier transform ion cyclotron resonance (FTICR) mass spectrometer (Bruker, Bremen, Germany) equipped with an automated chip-based nano-electrospray ionization source (Triversa NanoMate; Advion Bioscience, Ithaca, NY, USA). The samples were introduced into the mass spectrometer via NanoMate using 1.3-1.5 kV spray voltage and 0.3 psi gas pressure. All the mass spectra were collected over a 200-3000 m/z range with 2 M transient size (1.2 s transient length) and 28-30% excitation power. In MS/MS analysis, precursor ions were first isolated with an isolation window of 2-3 m/z. In electron capture dissociation (ECD), low-energy electrons were captured by multiply charged precursor ions to yield cleavages of amine bonds to produce c and z˙ ions [24, 25]. ECD pulse length was set to 15-25 ms. ECD bias was set from 0.5 to 1.0 V, and ECD lens was 10 V for ECD fragmentation. In collisionally activated dissociation (CAD), precursor ions were accelerated by an electrical potential to increase their kinetic energies and then collided with neutral gas molecules to introduce fragmentation to form b and y ions [26, 27]. The collision direct current (DC) bias for CAD was set from 8 to 20 V (Argon as collision gas). Typically, 100-500 transients were averaged for MS/MS experiments to ensure the collection of high quality tandem mass spectra for protein characterization.
Data Analysis
Mass spectra collected from online LC/MS were analyzed by DataAnalysis software from Bruker Daltonics. The Maximum Entropy algorithm embedded in DataAnalysis software was used for the deconvolution of protein spectra. The monoisotopic mass of individual proteoform was obtained from deconvoluted mass spectra using the incorporated MassList function in DataAnalysis.
Tandem mass spectra collected from offline MS/MS analysis were analyzed with in-house developed MASH Suite Pro software [28]. Fragment ion lists from MS/MS analysis were generated for manually validation and localization of PTM sites. All the reported masses are monoisotopic masses.
More experimental details about online LC/MS analysis, high-resolution MS/MS for protein characterization and data analysis are provided in Supplemental Information.
Results and Discussion
Online LC/MS profiling of myofilament protein isoforms and PTMs
Online LC/MS analysis of protein mixture from TFA extraction identified 23 sarcomeric protein isoforms with a total of 46 proteoforms (Table 1) based on their intact protein mass with a mass error tolerance of 10 ppm. The extracted ion chromatograms (EICs) of identified sarcomeric protein isoforms are shown in Figure 1(a). Myofilament proteins including TnT, TnC, TnI, Tpm, actin, and MLC and Z-disc proteins including LIM domain binding proteins and PDZ/LIM domain proteins, were identified with multiple isoforms and PTMs. Figure 1(b) shows the isoforms and PTMs of selected sarcomeric proteins. Three isoforms of Tpm, αTpm, βTpm, and γTpm, were identified, which is consistent with our findings on Tpm isoforms in human VL skeletal muscle [29]. Previous studies suggest that Tpm isoforms are functionally distinct and alteration in the Tpm composition may affect the muscle physiology [30]. For example, a switching of Tpm isoforms from βTpm and γTpm to αTpm was noticed in rat soleus skeletal muscle during hindlimb unloading by Yu et al. using the hindlimb suspension rat model [31]. Apart from Tpm isoforms, we also observed a variety of MLC isoforms, including MLC-1S, MLC-2S, MLC-1F, MLC-2F, and MLC-3F. MLC isoforms are known to be associated with muscle types and contractile properties [32]. A previous study in rat skeletal muscle by our group detected MLC-1F, MLC-2F, and MLC-3F in fast-twitch muscle and MLC-1S and MLC-2S in slow-twitch muscle, respectively [14]. Furthermore, a fast-to-slow isoform transition of MLC was detected during muscle aging [33]. All of these results suggest the correlation between MLC isoforms and skeletal physiological properties. In addition to Tpm and MLC, fast- and slow-skeletal isoforms of TnT, TnI, and TnC were also detected. The observation of both fast and slow protein isoforms indicates that VL is a mixture of fast- and slow-twitch muscle fibers, which is consistent with previous studies [34].
Table 1.
Summary of myofilament protein proteoforms assigned based on either their accurate mass measurements or MS/MS analysis results (annotated with asterisk).
| Protein # |
Protein ID |
Accession Number |
Modifications | Expt’l Mr (Da) |
Calc’d Mr (Da) |
Error (ppm) |
|---|---|---|---|---|---|---|
| 1 | fsTnT1 | A0A2K5WPG3 | +Ac1-Met2 −98 Da from pfsTnT1 | 29014.07 | 29014.22 | 5.2 |
| +Ac-Met | 29032.11 | 29032.23 | 4.1 | |||
| +P3+Ac-Met | 29112.05 | 29112.08 | 1.0 | |||
| 2 | fsTnT2 | A0A2K5WPF7 | +Ac-Met-98 Da from pfsTnT2 | 29628.41 | 29628.48 | 2.4 |
| +Ac-Met | 29646.40 | 29646.49 | 3.0 | |||
| +P+Ac-Met | 29726.35 | 29726.45 | 3.4 | |||
| 3 | fsTnT3 | XM_015113340# | +Ac-Met-98 Da from pfsTnT3 | 29771.51 | 29771.62 | 3.7 |
| +Ac-Met | 29789.50 | 29789.63 | 4.4 | |||
| +P+Ac-Met | 29869.51 | 29869.59 | 2.7 | |||
| 4 | fsTnT4 | NA§ | −98 Da from pfsTnT4 | 29894.38 | NA | NA |
| 29912.39 | NA | NA | ||||
| +P | 29992.38 | NA | NA | |||
| 5 | fsTnT5 | A0A2K5WPH1 | +Ac-Met-98 Da from pfsTnT5 | 30578.80 | 30578.91 | 3.6 |
| +Ac-Met | 30596.80 | 30596.92 | 3.9 | |||
| +P+Ac-Met* | 30676.75 | 30676.89 | 4.6 | |||
| 6 | fsTnT6 | F6U551 | +Ac-Met-98 Da from pfsTnT6 | 31193.01 | 31193.17 | 5.1 |
| +Ac-Met | 31211.12 | 31211.18 | 1.9 | |||
| +P+Ac-Met | 31291.00 | 31291.14 | 4.5 | |||
| 7 | ssTnT | F7HR10 | +Ac-Met-98 Da from pssTnT | 31013.92 | 31014.02 | 3.2 |
| +Ac-Met | 31031.91 | 31032.03 | 3.9 | |||
| +P+Ac-Met* | 31111.87 | 31111.99 | 3.9 | |||
| 8 | ssTnI | I2CW22 | −Met* | 21547.44 | 21547.52 | 3.7 |
| 9 | fsTnI | A0A1D5QTK6 | +Ac-Met* | 21209.77 | 21209.84 | 3.3 |
| +SSG4+Ac-Met | 21514.83 | 21514.91 | 3.7 | |||
| 10 | PDLIM5 | F6Z147 | +Ac-Met* | 23703.41 | 23703.44 | 1.3 |
| +Me5+Ac-Met | 23717.42 | 23717.45 | 1.3 | |||
| 11 | PDLIM7 | NA | +Ac* | 21106.86 | 21106.93 | 3.3 |
| +P+Ac | 21186.82 | 21186.90 | 3.8 | |||
| 12 | LDB3 | 075112-6 | +Ac-Met* | 30890.74 | 30890.78 | 1.3 |
| +P+Ac-Met | 30970.69 | 30970.75 | 1.9 | |||
| 13 | αTpm | P04692 | +Ac* | 32702.63 | 32702.69 | 1.8 |
| +P+Ac | 32782.58 | 32782.65 | 2.1 | |||
| 14 | γTpm | P06753 | +Ac-Met* | 32840.68 | 32840.75 | 2.1 |
| 15 | βTpm | P07951 | +Ac* | 32872.52 | 32872.58 | 1.8 |
| 16 | MLC-1S | A0A1D5RAU6 | +(Me)36-Met* | 21855.91 | 21855.97 | 2.7 |
| 17 | MLC-1F | G7N8T7 | +(Me)3-Met* | 20858.58 | 20858.64 | 2.9 |
| 18 | MLC-2F | F7EI96 | +(Me)3-Met* | 18838.36 | 18838.38 | 1.1 |
| +P+(Me)3-Met* | 18918.33 | 18918.35 | 1.1 | |||
| +2P+(Me)3-Met* | 18998.29 | 18998.31 | 1.1 | |||
| 19 | MLC-2S | A0A1D5RDY5 | +Dea8+(Me)3-Met* | 18759.38 | 18759.38 | 0.0 |
| +P+Dea+(Me)3-Met* | 18839.35 | 18839.34 | 0.5 | |||
| +2P+Dea+(Me)3-Met | 18919.32 | 18919.31 | 0.5 | |||
| 20 | MLC-3F | F7B2B7 | +Ac-Met* | 16570.11 | 16570.17 | 3.6 |
| 21 | αactin | F7HM15 | +Ac+Me-Met-Cys*7 | 41845.56 | 41845.83 | 6.5 |
| 22 | fsTnC | F7HGA7 | +Ac-Met* | 18021.21 | 18021.32 | 6.1 |
| 23 | ssTnC | G7MV95 | +Ac* | 18450.41 | 18450.51 | 5.4 |
Accession number of transcript variant X4 from NCBI nucleotide database. Protein accession number was not found.
Protein sequence was not found based on monoisotopic mass of the intact protein.
Proteoforms identified by MS/MS analysis.
Acetylation
Methionine
Phosphorylation
Gluthathionylation
Methylation
Tri-methylation
Cysteine
Deamidation
Figure 1.

LC/MS analysis of myofilament proteins. (a) LC/MS extracted ion chromatograms of myofilament proteins from rhesus macaque vastus lateralis (VL) tissue extract. (b) Deconvoluted mass spectra showing proteoforms of selected myofilament proteins, Tpm, MLC-2F, MLC-2S, MLC-1S, PDLIM7, LDB3, TnI, TnC and αactin. Red italic p, phosphorylation; Red italic SSG, S-gluthathionylation.
The largest number of isoforms identified here was from TnT. In addition to the primary fast- and slow-skeletal TnT (ssTnT) isoforms, fsTnT5 and ssTnT, we observed five additional fsTnT isoforms, fsTnT1, fsTnT2, fsTnT3, fsTnT4, and fsTnT6, in the mass range of 29,000-31,500 Da (Figure 2). Figure 2(a) shows the deconvoluted mass spectrum of all the six fsTnT isoforms. The zoomed-in mass spectra of proteoforms from each isoform are shown in Figure 2(b). Each isoform contains three predominant proteoforms, loss of H3PO4 (−98 Da) from mono-phosphorylated fsTnT (pfsTnT), unmodified fsTnT, and pfsTnT. The protein sequences of fsTnT isoforms except for fsTnT4 were identified by matching the experimental intact protein mass to the theoretical mass within 10 ppm mass error (Table 1). The theoretical protein mass was calculated based on protein sequences from either UniProt database or NCBI nucleotide database. A sequence alignment was carried out among the five fsTnT isoforms with known sequences. The result showed a high sequence homology of 89.4% among these five isoforms (Figure S1). As shown in Figure S1, the sequence differences are all from variable length or amino acid sequences in the N-terminal region, whereas the middle and C-terminal region are conserved, which is in good agreement with a previous report [35]. The hypervariable N-terminal region may alter the contractile functions of myofilaments [35]. For example, TnT isoforms with different N-terminal charge showed altered Ca2+ sensitivity of contractile apparatus [36]. Moreover, N-terminal structural change of TnT induced the conformation change of other domains of this protein and vary its binding affinity to TnI and Tpm [37]. In this study, the intact protein analysis in top-down MS approach allows the identification of different TnT isoforms with very high amino acid sequence homology, which is limited in the bottom-up MS analysis.
Figure 2.

LC/MS analysis of fsTnT proteoforms. (a) Deconvoluted mass spectrum showing six isoforms of fsTnT detected in rhesus macaque VL tissue. (b) Zoomed-in deconvoluted mass spectra showing selected fsTnT proteoforms. Red italic p, phosphorylation; Red dot, −98 Da from pfsTnT. Expt’l, experimental monoisotopic mass based on data from MS experiments; Calc’d, calculated monoisotopic mass based on amino acid sequences.
Besides isoforms, we also identified a variety of protein PTMs based on specific mass shift of each PTM (Figure 1 (b), Table 1). N-terminal acetylation was identified for TnT, TnI, TnC, Tpm, PDLIM isoforms, LDB3, MLC-3F and αactin by 42.01 Da mass discrepancy between experimental mass and calculated mass based on protein sequence. The 79.97 Da mass difference between two proteoforms indicates phosphorylation on αTpm, MLC-2F, MLC-2S, PDLIM7, and LDB3. S-gluthathionylation on fsTnI was determined based on the mass shift of 305.07 Da from unmodified fsTnI.
Identification of a novel PDZ/LIM domain protein isoform PDLIM7
We first identified protein isoforms and PTMs based on highly accurate protein mass, and subsequently characterized some of the isoforms and PTMs by MS/MS analysis to gain a comprehensive characterization of protein sequences and PTM sites of these proteoforms. The protein isoforms and PTMs further characterized by MS/MS analysis were annotated with asterisk in Table 1. In online LC/MS analysis, a protein with mass of 21,106.92 Da was detected in the retention time of 28-29 min, which was later identified as a PDZ/LIM domain protein isoform, macaca mulatta PDLIM7 (transcript variant X1, XM_015141524), by searching MS/MS data against rhesus macaque database using MS-Align+ software [38]. However, a mass discrepancy was noticed from the putative sequence. Since none of PDLIM7 isoform sequences of rhesus macaque in UniProtKB/Swiss-Prot database and NCBI nucleotide database match well with our results and considering the high genetic similarity of NHPs to humans, we checked human PDLIM7 isoforms as references. Two human PDLIM7 isoforms (UniProtKB, Q9NR12), isoform 5 and isoform 6, have the monoisotopic protein mass closest to our experimental mass, 21,106.92 Da. Compared to the canonical sequence of human PDLIM7, the isoform 5 lacks amino acid residues Q[192-457]V, and the isoform 6 lacks amino acid residues P[223-457]V. The isoform 6 also differs from the canonical sequence in amino acid residues R[191-222]S which is S[191-222]P in the canonical sequence. Since the canonical sequence of human PDLIM7 and the putative macaca mulatta PDLIM7 sequence are highly homologous, we adapted the same amino acid residues on the putative macaca mulatta PDLIM7 sequence following the changes on human PDLIM7 isoform 5 and 6 to see if the resulting mass matches our experimental mass. We first removed amino acid residues Q[158-423]V from the putative macaca mulatta PDLIM7 sequence following the change on human PDLIM7 isoform 5. However, the resulting mass does not match our experimental mass even with the consideration of N-terminal acetylation. Then we adapted the same amino acid residues on the putative macaca mulatta PDLIM7 sequence following the change on human PDLIM7 isoform 6. After removing amino acid residues P[189-423]V, changing the S[157-188]P amino acid residues of the macaca mulatta PDLIM7 sequence to R[157-188]S and considering the N-terminal acetylation, an intact protein mass of 21,106.93 Da was given, which matches exactly with our experimental result of 21,106.92 Da with 0.5 ppm error. We further verified this sequence using our ECD and CAD results. A total of 223 fragment ions including 92 c ions, 72 z˙ ions from ECD and 35 b ions, 24 y ions from CAD were assigned to the new sequence with consideration of N-terminal acetylation. Representative fragment ions and sequence map are shown in Figure 3(b) and (c). The fragment ions b6 and c5 confirmed acetylation at N-terminus. z˙32 and c156 ions confirmed the removal of amino acid residues P[189-423]V and change of amino acid residues R[157-188]S compared to the putative macaca mulatta PDLIM7 sequence.
Figure 3.

(a) Precursor ion of PDLIM7 at charge state of 19+, (b) representative ECD and CAD fragment ions and (c) sequence map of PDLIM7. z˙32 and c156 confirmed the amino acid residues R[157-188]S. The amino acid residues changed based on human PDLIM7 isoform6 is highlighted in yellow. N-terminal acetylation is highlighted in green.
It is common that PDZ/LIM domain proteins have variable isoforms from alternative pre-mRNA splicing. Previous study by our group also identified a novel isoform of PDZ/LIM domain protein in rat gastrocnemius muscle [14]. It was shown previously that PDZ/LIM domain protein family is responsible for heart and skeletal muscle formation and maintenance [39]. For example, knockdown of PDLIM7 in zebrafish results in the absence of valve tissue formation and produces a linear non-lopped, string-like heart [40]. Nonetheless, the precise function of PDLIM7 in rhesus macaque skeletal muscle remains to be further explored.
Characterization of protein PTMs by high-resolution MS/MS analysis
In addition to protein isoforms, we characterized multiple PTMs on myofilament and Z-disc proteins by performing both ECD and CAD fragmentation on each proteoform with PTMs. The combination of ECD and CAD allows the comprehensive characterization of PTMs. Even though ECD contributed more to locate the site of PTMs, CAD has made contribution to the sequence characterization of proteoforms by providing unique bond cleavages. Figure 4 shows the characterization of (a) mono-phosphorylated and (b) bis-phosphorylated MLC-2F by high-resolution MS/MS analysis. As shown in Figure 4(a), a tri-methylated c4ion was detected with mass shift of 42.05 Da from theoretical c4ion mass, indicating the presence of tri-methylation on the first four N-terminal amino acids. Then an unmodified z˙166 ion narrows down the tri-methylation site at the N-terminal Ala. In the characterization of phosphorylation site, both c14 and z˙153 ions are un-phosphorylated without any detectable mono-phosphorylated counterparts and c15 ion is 100% mono-phosphorylated, which unambiguously localized the mono-phosphorylation site at Ser15. Figure 4(b) shows the characterization of bis-phosphorylated MLC-2F. Apart from the first phosphorylation site at Ser15, the second phosphorylation site was identified as Ser16 based on mono-phosphorylated c15 ion, bis-phosphorylated c16 ion and mono-phosphorylated z˙153 ion. In ECD fragmentation of mono-phosphorylated and bis-phosphorylated MLC-2F, we observed some peaks with −1 Da loss from c ions, which are annotated with blue circles in Figure 4. These c-1 Da ions are presumably c˙ ions resulting from hydrogen transfer between c and z˙ fragments that usually occurs in ECD fragmentation [41].
Figure 4.

Offline MS/MS analysis localizing the PTM sites, tri-methylation at Ala1, phosphorylation at Ser15 and Ser16 for rhesus macaque MLC-2F. Representative ECD and CAD fragment ions and sequence maps of (a) mono-phosphorylated MLC-2F and (b) bis-phosphorylated MLC-2F. P, phosphorylation; (Me)3, tri-methylation; N.D., not detected; Red circles, theoretical isotopic abundance distribution of the isotopomer peaks of c and z˙ ions; Blue circle, loss of 1 Da from the c ions presumably resulting from H rearrangement [41].
The N-terminal tri-methylation was previously detected in MLCs in rabbit fast-twitch skeletal muscle [42]. It preserves the positive charge at N-terminus independent of pH and removes the nucleophilicity of the α-amino nitrogen [43]. Unfortunately, the function of this modification on skeletal MLC2 remains unrevealed. Unlike tri-methylation, the role of MLC-2F phosphorylation on modulating skeletal muscle mechanical properties has been well investigated. An age-related decrease in phosphorylation level of MLC-2F was detected in our earlier study in fast skeletal myosin regulatory light chain (fsRLC, also known as MLC-2F) in rat skeletal muscle [13]. Bowslaugh et al. showed that deficiency of RLC phosphorylation reduces peak power output of mouse fast-twitch skeletal muscle [44]. Overall, MLC-2F phosphorylation modulates striated skeletal muscle contractile properties by altering myosin motor structure to increase the Ca2+-sensitivity of the contractile apparatus [45].
Mono-phosphorylated and bis-phosphorylated proteoforms were also observed in another MLC isoform, MLC-2S. As shown in Figure 5(a), tri-methylation at N-terminus was confirmed by c6 and z˙162 ions as tri-methylated c6 and unmodified z˙162 ions were observed without any detectable unmodified c6 or tri-methylated z˙162 ions. Apart from N-terminal tri-methylation, we characterized deamidation at Asn13. Deamidated c13 and z˙153 were detected in our MS/MS analysis without any non-deamidated c12 and z˙152 ions. The mass difference of 115.03 Da between c12 and c13 and 202.06 Da between z˙151 and z˙153 suggest the presence of deamidation on Asn13 by considering 114.04 Da Asn and 87.03 Da Ser. The phosphorylation site was identified at Ser14 based on unphosphorylated c13 and z˙151 ions and phosphorylated c14 and z˙154 ions (Figure 5(b)). However, due to the low signal intensity of the bis-phosphorylated MLC-2S proteoform, only the mono-phosphorylation site was characterized.
Figure 5.

Offline MS/MS analysis for localizing the PTM sites, tri-methylation at Ala1, deamidation at Asn13, phosphorylation at Ser14 for rhesus macaque MLC-2S. Representative ECD and CAD fragment ions and sequence maps of (a) un-phosphorylated MLC-2S and (b) mono-phosphorylated MLC-2S. P, phosphorylation; (Me)3, tri-methylation; Dea, deamidation; N.D., not detected; Red circles, theoretical isotopic abundance distribution of the isotopomer peaks of c and z˙ ions; Blue circle, loss of 1 Da from the c ions presumably resulting from H rearrangement [41].
Previously, White et al. identified Asn13 deamidation in MLC-2 in rabbit cardiac tissue [46]. In their study, an N-terminal cleavage between Asn/Asp13 and Ser14 of non-phosphorylated MLC-2 was detected in stunned myocardium, implying that the proteolytic truncation might contribute to contractile dysfuntion. As deamidated proteins are preferentially degraded [47], it is possible that the deamidation of Asn13 provides a potential site for the cleavage between Asn13 and Ser14 [46]. We also characterized phosphorylation on MLC-2S, which is the slow isoform of RLC. RLC phosphorylation in both slow-twitch and fast-twitch muscle fibers has been found to alter muscle contractile properties, such as decreasing the amplitude of stretch activation [48].
Besides PTMs on MLC-2F and MLC-2S, our high-resolution MS/MS analysis also characterized methylation at His73 on αactin (Figure S2), phosphorylation at Ser1 on fsTnT and ssTnT (Figure S3-S4), N-terminal tri-methylation on MLC-1S and MLC-1F (Figure S5-S6), and N-terminal acetylation on all identified TnT, TnI, TnC, Tpm, PDLIM isoforms, LDB3, MLC-3F and αactin (Figure S7-S16). The methylation at His73 is commonly found in actin from many species [49]. It was reported that His73 methylation modulates the inter-domain stability and flexibility partially by slowing the phosphate release after ATP hydrolysis and leads to F-actin stabilization [49]. The phosphorylation site on fsTnT and ssTnT was identified at Ser1. However, the precise function of TnT phosphorylation at Ser1 is still unclear. It might have a role in controlling the turnover rate of TnT or regulating the interaction between TnT and Tpm [50]. We also observed a −98 Da proteoform from mono-phosphorylated TnT, which might be a H3PO4 loss from phosphorylated form. The same −98 Da mass difference was also observed in our previous study of TnT in rat skeletal muscle [14], however, the effect of this −98 Da mass loss remains unclear. The most common PTM characterized here is N-terminal acetylation. N-terminal acetylation has been found to be involved in multiple protein activities, including protein degradation, protein folding, protein complex formation, and membrane targeting [51].
Even though the sites of some PTMs identified in LC/MS analysis could not be localized due to the low signal intensity in MS analysis, they still have significant functions in regulating muscle contractile properties. For example, S-glutathionylation in fsTnI was found to protect the protein from oxidative stress and increase the Ca2+ sensitivity and force response of contractile apparatus [52]. The phosphorylation on Tpm straightens the head-to-tail overlap domain in Tpm, resulting in better fit on the thin filament to enhance actin filament activation [53, 54]. To enable the characterization of PTM sites on these low-abundance proteins, either protein enrichment before LC/MS analysis or improvement of instrument sensitivity should be carried out to increase the signal intensity of these proteins.
Conclusions
This study utilized top-down MS to completely analyze sarcomeric proteins from NHP skeletal muscle. A total of 23 protein isoforms with 46 proteoforms of sarcomeric proteins were identified based on online LC/MS analysis. The following high-resolution MS/MS analysis further verified the protein sequences of the isoforms and localized the sites of PTMs. PTMs including deamidation, methylation, acetylation, tri-methylation, phosphorylation, and S-glutathionylation were identified and most PTM sites were localized. Previous studies showed that these PTMs play critical roles in modulating muscle physiological properties. The wealth of isoforms and novel PTMs detected among structural proteins of the sarcomere raises the possibility that targets such as these might directly impact muscle biology and subsequently muscle function. An important next step will be to determine the extent to which individual protein isoforms and PTMs or the combinations of protein isoforms and PTMs are responsive to adaptive processes in skeletal muscle, including the beneficial effects of exercise or the deleterious effects of aging. In conclusion, analysis of intact proteins by top-down MS provides a global view of all detectable sarcomeric protein isoforms and PTMs in NHP skeletal muscle. We envision the application of this study to be a powerful tool in characterization of other proteins with significant biological functions.
Supplementary Material
Acknowledgements
This work is dedicated to Professor Benjamin A. Garcia, the recipient of the 2018 Biemann Medal for his outstanding achievements in the field of mass spectrometry in the elucidation of the “histone code”, the set of PTMs to histone proteins that are thought to regulate gene expression. We would like to thank Hannah Karp for her critical reading of this manuscript. We would also like to acknowledge the NIH R01 grants HL096971 (to Y.G.), GM125085 (to Y.G.) and AG040178 (to R.J.C. and R.M.A.), and the high-end instrument grant S10OD018475 (to Y.G.). This publication was made possible in part by ORIP grant P51OD011106 to the Wisconsin National Primate Research Center.
References
- 1.Schiaffino S, Reggiani C: Molecular diversity of myofibrillar proteins: gene regulation and functional significance. Physiol Rev. 76, 371–423 (1996) [DOI] [PubMed] [Google Scholar]
- 2.Frontera WR, Ochala J: Skeletal Muscle: A Brief Review of Structure and Function. Calcified Tissue Int. 96, 183–195 (2015) [DOI] [PubMed] [Google Scholar]
- 3.Yuan C, Solaro RJ: Myofilament proteins: From cardiac disorders to proteomic changes. Proteom Clin Appl. 2, 788–799 (2008) [DOI] [PubMed] [Google Scholar]
- 4.Peng Y, Ayaz-Guner S, Yu DY, Ge Y: Top-down mass spectrometry of cardiac myofilament proteins in health and disease. Proteom Clin Appl. 8, 554–568 (2014) [DOI] [PMC free article] [PubMed] [Google Scholar]
- 5.Faulkner G, Lanfranchi G, Valle G: Telethonin and other new proteins of the Z-disc of skeletal muscle. IUBMB Life. 51, 275–282 (2001) [DOI] [PubMed] [Google Scholar]
- 6.Sanger JM, Sanger JW: The Dynamic Z Bands of Striated Muscle Cells. Sci Signal. 1, (2008) [DOI] [PubMed] [Google Scholar]
- 7.Smith LM, Kelleher NL, Proteomics CTD: Proteoform: a single term describing protein complexity. Nat Methods. 10, 186–187 (2013) [DOI] [PMC free article] [PubMed] [Google Scholar]
- 8.Cai W, Tucholski TM, Gregorich ZR, Ge Y: Top-down Proteomics: Technology Advancements and Applications to Heart Diseases. Expert Rev Proteomics. 13, 717–730 (2016) [DOI] [PMC free article] [PubMed] [Google Scholar]
- 9.Peng Y, Ayaz-Guner S, Yu D, Ge Y: Top-down mass spectrometry of cardiac myofilament proteins in health and disease. Proteomics Clin Appl. 8, 554–568 (2014) [DOI] [PMC free article] [PubMed] [Google Scholar]
- 10.Miller MS, Callahan DM, Toth MJ: Skeletal muscle myofilament adaptations to aging, disease, and disuse and their effects on whole muscle performance in older adult humans. Front Physiol. 5, (2014) [DOI] [PMC free article] [PubMed] [Google Scholar]
- 11.Miller MS, Toth MJ: Myofilament Protein Alterations Promote Physical Disability in Aging and Disease. Exerc Sport Sci Rev. 41, 93–99 (2013) [DOI] [PMC free article] [PubMed] [Google Scholar]
- 12.Okumura N, Hashida-Okumura A, Kita K, Matsubae M, Matsubara T, Takao T, Nagai K: Proteomic analysis of slow- and fast-twitch skeletal muscles. Proteomics. 5, 2896–2906 (2005) [DOI] [PubMed] [Google Scholar]
- 13.Gregorich ZR, Peng Y, Cai WX, Jin YT, Wei LM, Chen AJ, McKiernan SH, Aiken JM, Moss RL, Diffee GM, Ge Y: Top-Down Targeted Proteomics Reveals Decrease in Myosin Regulatory Light-Chain Phosphorylation That Contributes to Sarcopenic Muscle Dysfunction. J Proteome Res. 15, 2706–2716 (2016) [DOI] [PMC free article] [PubMed] [Google Scholar]
- 14.Wei LM, Gregorich ZR, Lin ZQ, Cai WX, Jin YT, McKiernan SH, McIlwain S, Aiken JM, Moss RL, Diffee GM, Ge Y: Novel Sarcopenia-related Alterations in Sarcomeric Protein Post-translational Modifications (PTMs) in Skeletal Muscles Identified by Top-down Proteomics. Mol Cell Proteomics. 17, 148–159 (2018) [DOI] [PMC free article] [PubMed] [Google Scholar]
- 15.Anderson RM, Colman RJ: Prospects and Perspectives in Primate Aging Research. Antioxid Redox Sign. 14, 203–205 (2011) [DOI] [PMC free article] [PubMed] [Google Scholar]
- 16.Colman RJ, McKiernan SH, Aiken JM, Weindruch R: Muscle mass loss in Rhesus monkeys: Age of onset. Exp Gerontol. 40, 573–581 (2005) [DOI] [PubMed] [Google Scholar]
- 17.Colman RJ, Anderson RM, Johnson SC, Kastman EK, Kosmatka KJ, Beasley TM, Allison DB, Cruzen C, Simmons HA, Kemnitz JW, Weindruch R: Caloric Restriction Delays Disease Onset and Mortality in Rhesus Monkeys. Science. 325, 201–204 (2009) [DOI] [PMC free article] [PubMed] [Google Scholar]
- 18.Ohlendieck K: Skeletal muscle proteomics: current approaches, technical challenges and emerging techniques. Skelet Muscle. 1, (2011) [DOI] [PMC free article] [PubMed] [Google Scholar]
- 19.Deshmukh AS, Murgia M, Nagaraj N, Treebak JT, Cox J, Mann M: Deep proteomics of mouse skeletal muscle enables quantitation of protein isoforms, metabolic pathways, and transcription factors. Mol Cell Proteomics. 14, 841–853 (2015) [DOI] [PMC free article] [PubMed] [Google Scholar]
- 20.Parker KC, Walsh RJ, Salajegheh M, Amato AA, Krastins B, Sarracino DA, Greenberg SA: Characterization of Human Skeletal Muscle Biopsy Samples Using Shotgun Proteomics. J Proteome Res. 8, 3265–3277 (2009) [DOI] [PubMed] [Google Scholar]
- 21.Chen B, Brown KA, Lin Z, Ge Y: Top-Down Proteomics: Ready for Prime Time? Anal Chem. 90, 110–127 (2018) [DOI] [PMC free article] [PubMed] [Google Scholar]
- 22.Gregorich ZR, Ge Y: Top-down proteomics in health and disease: challenges and opportunities. Proteomics. 14, 1195–1210 (2014) [DOI] [PMC free article] [PubMed] [Google Scholar]
- 23.Aebersold R, Agar JN, Amster IJ, Baker MS, Bertozzi CR, Boja ES, Costello CE, Cravatt BF, Fenselau C, Garcia BA, Ge Y, Gunawardena J, Hendrickson RC, Hergenrother PJ, Huber CG, Ivanov AR, Jensen ON, Jewett MC, Kelleher NL, Kiessling LL, Krogan NJ, Larsen MR, Loo JA, Loo RRO, Lundberg E, MacCoss MJ, Mallick P, Mootha VK, Mrksich M, Muir TW, Patrie SM, Pesavento JJ, Pitteri SJ, Rodriguez H, Saghatelian A, Sandoval W, Schluter H, Sechi S, Slavoff SA, Smith LM, Snyder MP, Thomas PM, Uhlen M, Van Eyk JE, Vidal M, Walt DR, White FM, Williams ER, Wohlschlager T, Wysocki VH, Yates NA, Young NL, Zhang B: How many human proteoforms are there? Nat Chem Biol. 14, 206–214 (2018) [DOI] [PMC free article] [PubMed] [Google Scholar]
- 24.Zubarev RA, Kelleher NL, McLafferty FW: Electron capture dissociation of multiply charged protein cations. A nonergodic process. J Am Chem Soc. 120, 3265–3266(1998) [Google Scholar]
- 25.Chen BF, Guo X, Tucholski T, Lin ZQ, McIlwain S, Ge Y: The Impact of Phosphorylation on Electron Capture Dissociation of Proteins: A Top-Down Perspective. J Am Soc Mass Spectr. 28, 1805–1814 (2017) [DOI] [PMC free article] [PubMed] [Google Scholar]
- 26.Cody RB, Burnier RC, Freiser BS: Collision-Induced Dissociation with Fourier-Transform Mass-Spectrometry. Analytical Chemistry. 54, 96–101 (1982) [Google Scholar]
- 27.Lin ZQ, Guo F, Gregorich ZR, Sun RX, Zhang H, Hu Y, Shanmuganayagam D, Ge Y: Comprehensive Characterization of Swine Cardiac Troponin T Proteoforms by Top-Down Mass Spectrometry. J Am Soc Mass Spectr. 29, 1284–1294 (2018) [DOI] [PMC free article] [PubMed] [Google Scholar]
- 28.Cai WX, Guner H, Gregorich ZR, Chen AJ, Ayaz-Guner S, Peng Y, Valeja SG, Liu XW, Ge Y: MASH Suite Pro: A Comprehensive Software Tool for Top-Down Proteomics. Mol Cell Proteomics. 15, 703–714 (2016) [DOI] [PMC free article] [PubMed] [Google Scholar]
- 29.Jin YT, Peng Y, Lin ZQ, Chen YC, Wei LM, Hacker TA, Larsson L, Ge Y: Comprehensive analysis of tropomyosin isoforms in skeletal muscles by top-down proteomics. J Muscle Res Cell M. 37, 41–52 (2016) [DOI] [PMC free article] [PubMed] [Google Scholar]
- 30.Gunning PW, Schevzov G, Kee AJ, Hardeman EC: Tropomyosin isoforms: divining rods for actin cytoskeleton function. Trends Cell Biol. 15, 333–341 (2005) [DOI] [PubMed] [Google Scholar]
- 31.Yu ZB, Gao F, Feng HZ, Jin JP: Differential regulation of myofilament protein isoforms underlying the contractility changes in skeletal muscle unloading. Am J Physiol-Cell Ph. 292, C1192–C1203 (2007) [DOI] [PMC free article] [PubMed] [Google Scholar]
- 32.Greaser ML, Moss RL, Reiser PJ: Variations in contractile properties of rabbit single muscle fibres in relation to troponin T isoforms and myosin light chains. J Physiol. 406, 85–98 (1988) [DOI] [PMC free article] [PubMed] [Google Scholar]
- 33.Gannon J, Doran P, Kirwan A, Ohlendieck K: Drastic increase of myosin light chain MLC-2 in senescent skeletal muscle indicates fast-to-slow fibre transition in sarcopenia of old age. Eur J Cell Biol. 88, 685–700 (2009) [DOI] [PubMed] [Google Scholar]
- 34.Staron RS, Hagerman FC, Hikida RS, Murray TF, Hostler DP, Crill MT, Ragg KE, Toma K: Fiber type composition of the vastus lateralis muscle of young men and women. J Histochem Cytochem. 48, 623–629 (2000) [DOI] [PubMed] [Google Scholar]
- 35.Wei B, Jin JP: Troponin T isoforms and posttranscriptional modifications: Evolution, regulation and function. Arch Biochem Biophys. 505, 144–154 (2011) [DOI] [PMC free article] [PubMed] [Google Scholar]
- 36.Ogut O, Granzier H, Jin JP: Acidic and basic troponin T isoforms in mature fast- twitch skeletal muscle and effect on contractility. Am J Physiol-Cell Ph. 276, C1162–C1170 (1999) [DOI] [PubMed] [Google Scholar]
- 37.Jin JP, Root DD: Modulation of troponin T molecular conformation and flexibility by metal ion binding to the NH2-terminal variable region. Biochemistry. 39, 11702–11713 (2000) [DOI] [PubMed] [Google Scholar]
- 38.Liu XW, Sirotkin Y, Shen YF, Anderson G, Tsai YS, Ting YS, Goodlett DR, Smith RD, Bafna V, Pevzner PA: Protein Identification Using Top-Down. Mol Cell Proteomics. 11, (2012) [DOI] [PMC free article] [PubMed] [Google Scholar]
- 39.Krcmery J, Camarata T, Kulisz A, Simon HG: Nucleocytoplasmic functions of the PDZ-LIM protein family: new insights into organ development. Bioessays. 32, 100–108 (2010) [DOI] [PMC free article] [PubMed] [Google Scholar]
- 40.Camarata T, Krcmery J, Snyder D, Park S, Topczewski J, Simon HG: Pdlim7 (LMP4) regulation of Tbx5 specifies zebrafish heart atrio-ventricular boundary and valve formation. Dev Biol. 337, 233–245 (2010) [DOI] [PMC free article] [PubMed] [Google Scholar]
- 41.Savitski MM, Kjeldsen F, Nielsen ML, Zubarev RA: Hydrogen rearrangement to and from radical z fragments in electron capture dissociation of peptides. J Am Soc Mass Spectrom. 18, 113–120 (2007) [DOI] [PubMed] [Google Scholar]
- 42.Henry GD, Dalgarno DC, Marcus G, Scott M, Levine BA, Trayer IP: The Occurrence of Alpha-N-Trimethylalanine as the N-Terminal Amino-Acid of Some Myosin Light-Chains. Febs Lett. 144, 11–15 (1982) [DOI] [PubMed] [Google Scholar]
- 43.Stock A, Clarke S, Clarke C, Stock J: N-Terminal Methylation of Proteins - Structure, Function and Specificity. Febs Lett. 220, 8–14 (1987) [DOI] [PubMed] [Google Scholar]
- 44.Bowslaugh J, Gittings W, Vandenboom R: Myosin light chain phosphorylation is required for peak power output of mouse fast skeletal muscle in vitro. Pflug Arch Eur J Phy. 468, 2007–2016 (2016) [DOI] [PubMed] [Google Scholar]
- 45.Stull JT, Kamm KE, Vandenboom R: Myosin light chain kinase and the role of myosin light chain phosphorylation in skeletal muscle. Archives of Biochemistry and Biophysics. 510, 120–128 (2011) [DOI] [PMC free article] [PubMed] [Google Scholar]
- 46.White MY, Cordwell SJ, McCarron HCK, Tchen AS, Hambly BD, Jeremy RW: Modifications of myosin-regulatory light chain correlate with function of stunned myocardium. J Mol Cell Cardiol. 35, 833–840 (2003) [DOI] [PubMed] [Google Scholar]
- 47.Robinson NE: Protein deamidation. P Natl Acad Sci USA. 99, 5283–5288 (2002) [DOI] [PMC free article] [PubMed] [Google Scholar]
- 48.Davis JS, Satorius CL, Epstein ND: Kinetic effects of myosin regulatory light chain phosphorylation on skeletal muscle contraction. Biophys J. 83, 359–370 (2002) [DOI] [PMC free article] [PubMed] [Google Scholar]
- 49.Terman JR, Kashina A: Post-translational modification and regulation of actin. Curr Opin Cell Biol. 25, 30–38 (2013) [DOI] [PMC free article] [PubMed] [Google Scholar]
- 50.Filatov VL, Katrukha AG, Bulargina TV, Gusev NB: Troponin: Structure, properties, and mechanism of functioning. Biochemistry-Moscow+. 64, 969–985 (1999) [PubMed] [Google Scholar]
- 51.Ree R, Varland S, Arnesen T: Spotlight on protein N-terminal acetylation. Exp Mol Med. 50, (2018) [DOI] [PMC free article] [PubMed] [Google Scholar]
- 52.Mollica JP, Dutka TL, Merry TL, Lamboley CR, McConell GK, McKenna MJ, Murphy RM, Lamb GD: S-Glutathionylation of troponin I (fast) increases contractile apparatus Ca2+ sensitivity in fast-twitch muscle fibres of rats and humans. J Physiol-London. 590, 1443–1463 (2012) [DOI] [PMC free article] [PubMed] [Google Scholar]
- 53.Lehman W, Medlock G, Li XC, Suphamungmee W, Tu AY, Schmidtmann A, Ujfalusi Z, Fischer S, Moore JR, Geeves MA, Regnier M: Phosphorylation of Ser283 enhances the stiffness of the tropomyosin head-to-tail overlap domain. Archives of Biochemistry and Biophysics. 571, 10–15 (2015) [DOI] [PMC free article] [PubMed] [Google Scholar]
- 54.Mak A, Smillie LB, Barany M: Specific phosphorylation at serine-283 of alpha tropomyosin from frog skeletal and rabbit skeletal and cardiac muscle. Proc Natl Acad Sci U S A. 75, 3588–3592 (1978) [DOI] [PMC free article] [PubMed] [Google Scholar]
Associated Data
This section collects any data citations, data availability statements, or supplementary materials included in this article.