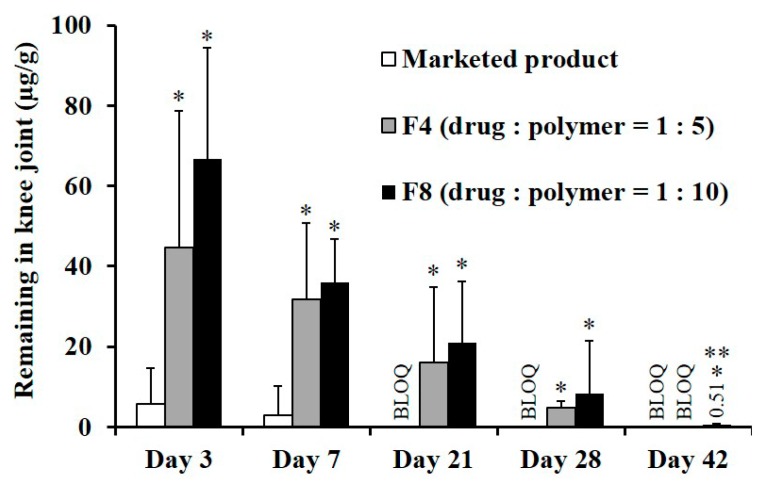
Figure 6.
TA remains in rat joint tissue following IA administration of the marketed product, F4, and F8 at a dose of 125 μg of TA per knee; Notes: Vertical bars represent mean ± SD (n = 6). Statistical analysis was performed using the one-way ANOVA test; * significantly different from the marketed product (p < 0.05), ** significantly different from F4 (p < 0.05). BLOQ value of LC-MS/MS analysis was determined to 0.2 ng/mL.

