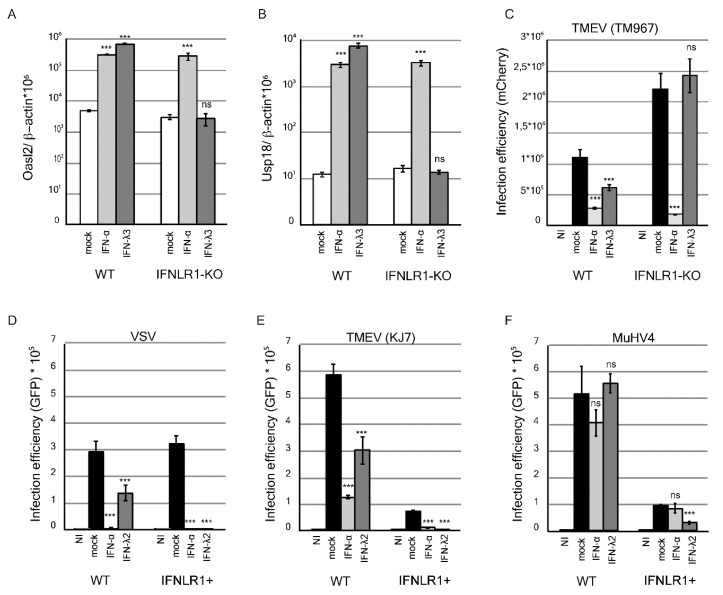
Figure 1.
Interferon-stimulated gene (ISG) expression and antiviral activity in response to IFN-λ treatment in WT and IFNLR1-overexpressing LKR10 cells. (A,B) Amounts of Oasl2 (A) and Usp18 (B) per 106 β-actin cDNA copies detected in wild-type (WT) and IFNLR1-KO LKR10 cells 24 h after treatment with mouse IFN-αA, IFN-λ3, or control medium (mock). (C) Infection efficiency in WT and IFNLR1-KO LKR10 cells measured by flow cytometry 24 h post-infection with 0.5 PFU/cell of TM967. Cells were pretreated with mouse IFN-αA, IFN-λ3, or mock for 7 h prior to infection. (D–F) Infection efficiency in WT and IFNLR1-overexpressing (IFNLR1+) LKR10 cells measured by flow cytometry 8 h post-infection with 0.25 PFU/cell vesicular stomatitis virus (VSV)–GFP (D); or 24 h post-infection with 2.5 PFU/cell KJ7 (E) or 1 PFU/cell murid herpesvirus-4 (MuHV-4)–GFP (F). Cells were pretreated with mouse IFN-αA, IFN-λ2 or control medium for 7 h prior to infection. (A–F) 100 U/mL IFN-αA, 700 pg/mL IFN-λ3, and 1 ng/mL IFN-λ2 were used for treatment. *** p < 0.001. ns: non-significant in one-way ANOVA (Dunnett’s test) comparing each group to the mock-treated group.

