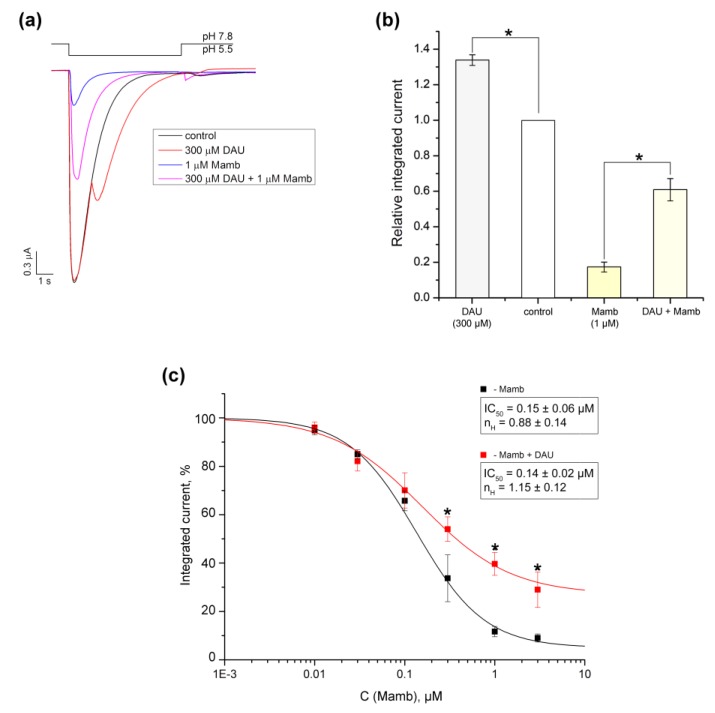
Figure 7.
Comparison of the effects that DAU and Mamb-2 have on ASIC1a. (a) Representative traces of pH 5.5-evoked currents of ASIC1a alone (black trace) and of ASIC1a with a 15 s pre-incubation of 300 μM DAU (red trace), 1 μM mambalgine-2 peptide (Mamb-2) (blue trace), or a mixture of 300 μM DAU and 1 μM Mamb-2 (magenta trace). (b) Integrated currents measured for ASIC1a (alone and in the presence of each of the following: 300 μM DAU, 1 μM Mamb-2, and a mixture of 300 μM DAU and 1 μMMamb-2) generated by dropping the pH from 7.8 to 5.5. Data are presented as mean ± SEM; n = 5. *P < 0.05, significantly different from the integrated current at pH 7.8; Kruskal–Wallis ANOVA. (c) Dose–response ASIC1a inhibitory curves for Mamb-2 alone (black line) and for Mamb-2 in concurrence with 300 μM DAU (red line). Data were fitted by the logistic equation. The calculated permanent current for Mamb-2 was 5.3 ± 2.3%, and the maximal integrated current increased to 26.7 ± 7.8% in the presence of DAU. Data are presented as mean ± SEM (n = 5); * P < 0.05.

