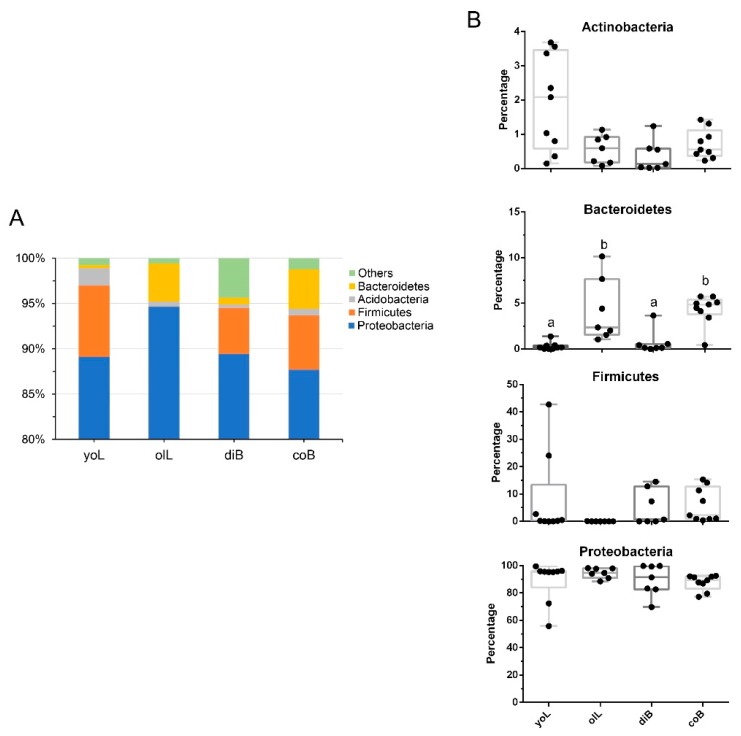
Figure 2.
Phylum level composition. (A) Color-coded bar plot showing the average bacterial phylum distribution of the different groups sampled from gut communities of D. valens at different life stages (yoL, young larvae; olL, old larvae; diB, dispersal adults; coB, colonized adults). (B) The box shows the interquartile range of the relative abundance of the four main bacterial phyla from four groups: Proteobacteria, Firmicutes, Bacteroidetes, and Actinobacteria. Boxes represent the 25th and 75th percentiles. The solid line inside the box represents the median. Boxes with a different letter above are significantly different at p < 0.05.

