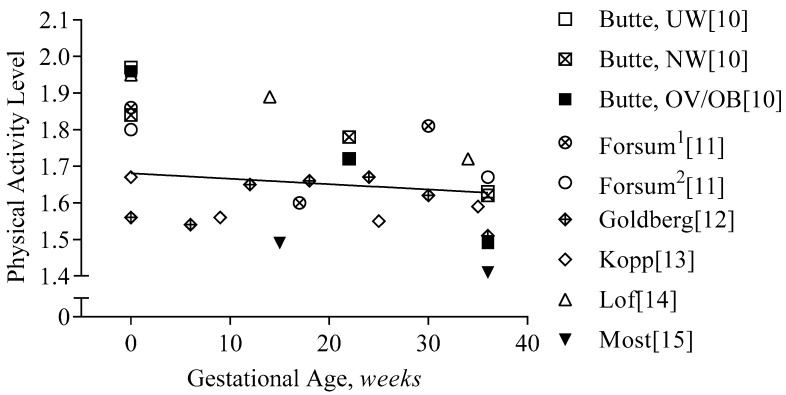
Figure 4.
Physical activity level during gestation. Physical activity level is presented per study and gestational age (GA). The regression line represents the average decline in the physical activity level during gestation (PAL = 1.68 − 0.0015 × GA[weeks], R2 = 0.02). Forsum1 and Forsum2 indicate the two different cohorts in the study: both measured before pregnancy, but at different times during gestation; Butte reported the changes in PAL per BMI class: ‘UW’ indicates underweight: BMI ≤ 19.8 kg/m2, ‘NW’ indicates normal weight: BMI 19.8–26 kg/m2, and ‘OV/OB’ indicates overweight/obesity: BMI ≥ 26 kg/m2.

