Abstract
Background
Long term alcohol abuse is associated with change in behavior, brain structure, and brain function. However, the nature of these changes is not well understood. In this study we used network science to analyze a nonhuman primate (NHP) model of ethanol (EtOH) self-administration to evaluate functional differences between animals with chronic alcohol use and animals with no exposure to alcohol. Of particular interest was how chronic alcohol exposure may affect the resting state network.
Methods
Baseline resting state functional MRI (fMRI) was acquired in a cohort of vervet monkeys. Animals underwent an induction period where they were exposed to an isocaloric maltose dextrin solution (control) or EtOH in escalating doses over three 30-day epochs. Following induction, animals were given ad libitum access to water and a maltose dextrin solution (control) or water and EtOH for 22 hr/day over 12 months. Cross-sectional analyses examined ROIs in hubs and community structure across animals to determine differences between drinking and non-drinking animals after the 12-month free access period.
Results
Animals were classified as lighter (<2.0 g/kg/day) or heavier drinkers (≥2.0 g/kg/day) based on a median split of their intake pattern during the 12-month EtOH free access period. Statistical analysis of hub connectivity showed significant differences in heavier drinkers for hubs in the precuneus, posterior parietal cortices, superior temporal gyrus, subgenual cingulate, and sensorimotor cortex. Heavier drinkers were also shown to have less consistent communities across the brain compared to lighter drinkers. The different level of consumption between the lighter and heavier drinking monkeys suggests that differences in connectivity may be intake dependent.
Conclusion
Animals that consume alcohol show topological differences in brain network organization, particularly in animals that drink heavily. Differences in the resting state network were linked to areas that are associated with spatial association, working memory and visuomotor processing.
Introduction
Alcohol has a profound effect on the brain, and heavy consumption can lead to alcohol dependence and alcoholism. Structural magnetic resonance imaging studies in patients with chronic alcoholism show reduced volume in gray matter and white matter in the cerebral cortex (Pfefferbaum et al., 1992, Pfefferbaum et al., 1998, Fein et al., 2002), and functional MRI (fMRI) studies have shown reduced blood oxygen level-dependent (BOLD) response in active drinkers during working memory tasks (Levin et al., 1998, Trim et al., 2010). While long-term alcohol use clearly results in structural and functional changes to the brain, the onset of these changes and the effect these changes may have on brain network topology remains unclear. This is at least partially because studies on the effects of alcohol on the brain are typically conducted on individuals who have consumed alcohol over long periods of time, often decades. Consequently, the results from these studies may not accurately reflect the initial effects of alcohol on the brain. Even studies in young adults who become dependent between the ages 18 and 24 (Dawson et al., 2005) can be still confounded by factors such as polydrug abuse and psychological disorders, that make interpretation of results difficult (Boden and Fergusson, 2011, Frye and Salloum, 2006, Grant and Harford, 1995).
Nonhuman primates (NHPs) provide a unique translational resource to address these concerns because their use allows for complete control over experimental conditions (e.g., nutritional status, housing conditions, medical history, etc.). Additionally, animal models of substance abuse have face validity and, like humans, individuals differ in the amount and pattern of alcohol they consume. NHPs in a well-characterized model of chronic ethanol self-administration (Vivian et al., 2001, Grant et al., 2008), consume ethanol in doses that range from <1 g/kg (4 drink equivalent) to >3 g/kg (12 drink equivalent) daily. Furthermore, this model can predict which animals will subsequently become heavy drinkers (Grant et al., 2008). An important aspect of this model is that it permits longitudinal tracking of ethanol effects beginning in the naïve state to the onset of divergent drinking patterns (light and heavy drinking), making it uniquely valuable in the study of early-stage alcohol effects.
Neuroimaging studies focusing on resting state networks have proven useful for understanding the effects of alcohol on the brain. One such network, the default mode network, represents neurocorrelates of brain activity when the brain is at “rest” and no external demanding task is being performed (Raichle et al., 2001). In humans, this network includes the medial prefrontal cortex, the lateral parietal lobe, the posterior cingulate cortex and precuneus. It is hypothesized to interact with sensory, motor, and emotional systems, and disruption of or alterations to this network is thought to play a role in cognitive disorders and such disease states as depression and schizophrenia (Buckner et al., 2008, Anticevic et al., 2012). A functional connectivity study of the default mode network in chronic alcohol users found increased connectivity between the precuneus and specific regions within the cerebellum (Chanraud et al., 2011). In another study on resting state networks, acute alcohol consumption was associated with changes to the subcallosal anterior cingulate cortex, left temporal fusiform gyrus and the left inferior temporal gyrus (Spagnolli et al., 2013). Previous work has characterized the default mode network in NHPs. While many of these studies have identified various regions, several regions have appeared across different NHP species, including the precuneus, cingulate cortex, medial prefrontal cortex, and superior temporal gyrus (Rilling et al., 2007, Vincent et al., 2007, Margulies et al., 2009, Hutchison et al., 2011, Mantini et al., 2011, Telesford et al., 2013, Miranda-Dominguez et al., 2014). Our earlier work characterized brain network topology of NHPs under anesthesia describing hubs and communities consistent with the default mode network. That study also demonstrated the effects of acute ethanol exposure on brain networks (Telesford et al., 2013). However, the alcohol challenge study was performed in a single animal and did not characterize individual regions that were affected by exposure to ethanol. To our knowledge, this is the first study of brain networks to characterize the effects of chronic alcohol consumption on brain network topology in NHPs.
The purpose of the current study was to determine whether there were differences in resting state network organization in NHPs that chronically self-administer ethanol compared to animals that have no exposure to alcohol. Of particular interest was whether chronic ethanol exposure affected the organization of the brain network, and if so, to what degree these differences might correlate with alcohol intake. To this end, we used network science, a method used to investigate whole-brain connectivity. Network science utilizes the concepts of graph theory, which treats regions (or voxels) in the brain as an array of nodes that are associated by physical or functional connections called edges. This model is appealing to neuroscientists as the brain is often viewed as a system containing multiple regions with specialized functions that rapidly interact to produce various behaviors (Watts and Strogatz, 1998, Bullmore and Sporns, 2009). One of the great benefits of network science is that it emphasizes the brain as a complex system, as opposed to concentrating on an individual brain region or neural subsystem. With this approach, investigators are able to see how different brain regions interact, which may not be apparent in a seed based analysis like functional connectivity or activity based measures like statistical parametric mapping (Telesford et al., 2011).
In our previous investigations, acute exposure to ethanol was found to significantly impact hubs in the rhesus macaque (Telesford et al., 2013). One of the regions that showed the greatest change was the precuneus, an area considered part of the default mode network in humans, as well as the medial frontal cortex. Given the observed changes to the default mode network in humans and the known effects of long-term alcohol use on cognition, we hypothesized that chronic alcohol consumption would be associated with significant connectivity differences in the precuneus and the anterior cingulate gyrus, both of which participate in working memory. In this study, we evaluated connectivity differences in these two brain areas, as well as, areas considered part of the default mode network in NHPs (Vincent et al., 2007, Margulies et al., 2009, Mantini et al., 2011, Telesford et al., 2013).
Methods
Animals
Male vervet monkeys (Chlorocebus aethiops) (n=19) from an ongoing study examining the neurobiological consequences of chronic ethanol self-administration were used for this study. The animals were run in two separate cohorts, with each cohort consisting of controls and drinkers. Animals in both cohorts were drawn from the same colony, had similar ages (5.36 ± 0.51SD) and characteristics. All animals self-administered either maltose dextrin (control) or ethanol (drinkers) using a well-characterized model of ethanol self-administration (Vivian et al., 2001, Grant et al., 2008). The first cohort consisted of four controls and five ethanol drinkers. The second cohort consisted of three controls and seven ethanol drinkers. The second cohort began the study two years after the first cohort started. The final study population contained 7 animals in the control group and 12 animals in the ethanol drinking group.
Animals were scanned twice during this study: a baseline scan, prior to ethanol exposure, which provided a qualitative baseline to understand brain network organization; and a 12-month scan, occurring after a 3-month induction and 12-month free access period, which was used in statistical analysis to determine differences between the drinking and non-drinking cohorts. During the induction period, animals were induced to consume ethanol (4% w/v; EtOH group) or an isocaloric maltose dextrin solution (control group). Following induction, animals had free access to consume EtOH and/or water or maltose dextrin and/or water for 22h/day for 12 months. Although animals in both cohorts received the same experimental paradigm, the first cohort did not receive baseline fMRI scans as these animals had already begun the free access phase of the study when resting state fMRI was implemented into this drinking model. Accordingly, statistical analyses were designed to compare differences between drinking and non-drinking animals after the 12-month free access period. Baseline scans in this study served as a qualitative comparison for changes observed in the NHP population after 12 months (See Table 1 for details on grouping of cohorts).
Table 1. Breakdown of vervet monkey cohort and scans received.
Animals were divided into two cohorts. The animals in Cohort 1 only received a scan at 12 months, while the animals in cohort 2 received scans in the treatment naïve state and after 12 months of chronic ethanol self-administration.
| Cohort | Cohort 1 | Cohort 2 | ||
|---|---|---|---|---|
| Group | Control | Drinking | Control | Drinking |
| # of Animals | 4 | 5 | 3 | 7 |
| Scan Received | 12 Month | 12 Month | Baseline 12 Month | Baseline 12 Month |
Scanning protocol
Animals were sedated and anesthetized prior to scanning and maintained under anesthesia during scans. Resting state fMRI scan was acquired at each time point with a gradient echo EPI sequence using an 8-channel receive only RF head coil with a form factor designed specifically for the nonhuman primate (Dr. Cecil Hayes, University of Washington). In addition, a T1-weighted 3D-SPGR anatomic scan was collected for each animal. All scans were conducted at Wake Forest School of Medicine, Winston-Salem, NC. All procedures were approved by the Institutional Animal Care and Use Committee and the National Institute of Health Guide for the Care and Use of Laboratory Animals (NIH Publications No. 80–23).
Network analysis
A correlation matrix was produced by computing the Pearson correlation between all possible pairs of voxels within the fMRI time series. A threshold was applied to the correlation matrix, whereby voxel pairs above the threshold were considered functionally connected and assigned a value of 1 and voxel pairs below the threshold were considered not connected and assigned a value of 0. The discretization of the correlation matrix produces a binary adjacency matrix (for information on network construction, see (Telesford et al., 2011)). The threshold was defined such that the relationship between the number of nodes and average number of connections between nodes was consistent across subjects. Specifically, the relationship S=log(N)/log(K) was the same across subjects, where N is the number of nodes in the entire network, K is the average degree of the network. For this paper, the threshold S=2.25 was used to define networks, but network properties have been demonstrated to be robust for different S values (Hayasaka and Laurienti, 2010).
Graph metric analysis
From the adjacency matrix, the following graph metrics were calculated at each node and averaged to yield average graph metrics for the entire network: degree (K), local efficiency (Eloc), and global efficiency (Eglob) (for more details on specific metrics, see (Rubinov and Sporns, 2010)). Degree for each voxel was mapped to anatomic space to determine the most connected regions, or hubs, within the brain. Hub maps were generated with degree comprising the top 15% of the most connected nodes.
Hubs in the network may represent differences in node distribution; however, this does not imply that the level of connectivity within these regions is similar.
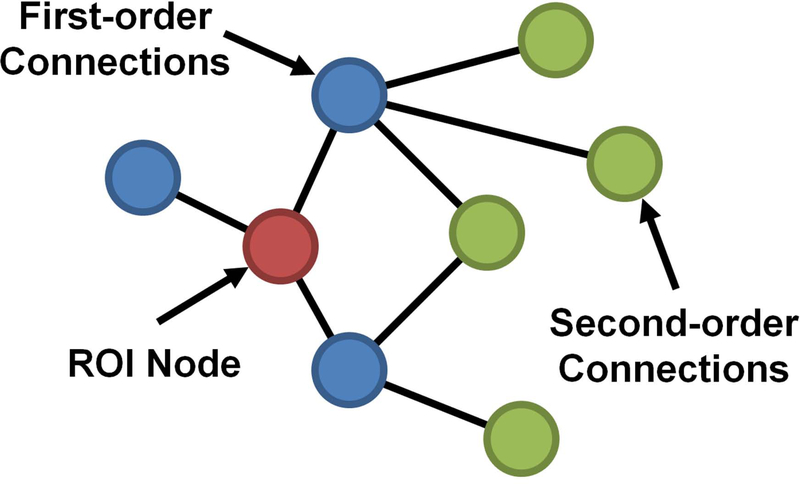
To test if the observed differences in hub structure also reflected differences in level of connectivity, a one-way ANOVA was tested on a 4.5mm×4.5mm×4.5mm region of interest (ROI). ROIs were placed in areas showing distinct differences in hub structure, as well as regions considered part of the default mode network in NHPs. In addition, to assess network organization, regional connectivity maps were generated for select ROIs. Connections to the ROI were classified as first-order (direct) or second-order (indirect). First-order connections are the immediate network neighbors of the ROI and are classified as such because they share direct connections. Second-order connections share direct connections with the immediate network neighbors, and thus share indirect connections to the ROI (Figure 1). In this investigation, regional connectivity maps of the second-order connections were evaluated for ROIs in the precuneus and anterior cingulate; connectivity maps show the average degree of second-order connections across a group.
Figure 1. Regional connectivity map schematic.
To assess network organization, network connections are classified by first-order and second-order connections of the ROI node. First-order connections denote the immediate neighbors of the ROI node and are considered direct connections. Second-order connections share direct connections with the first-order connections and are consider indirection connections of the ROI node.
Community structure analysis
Community structure analysis detects the level of interconnectedness of “subnetworks” in the network. Nodes more interconnected with each other than with the rest of the network form communities or modules. These modules segregate the network into small compartments that highlight the functional organization across the whole brain (Fortunato, 2010, Girvan and Newman, 2002, Meunier et al., 2009). Community structure was determined using Qcut, an algorithm that uses spectral graph partitioning and local optimization to determine the community structure (Ruan and Zhang, 2008). To assess the consistency of modular organization, scaled inclusivity (SI) was used to find the most consistent modules in the control and drinking group. SI values are calculated by measuring the overlap of modules across a group while concurrently penalizing any non-overlapping modules (Steen et al., 2011). To test for significance, the most consistent modules were identified from baseline scans. Treating these modules as ROIs, the SI values within the ROI were averaged for the 12-month scan in all animals. Afterward a one-way ANOVA was used to test for differences between control and drinking animals.
Results
Average graph metric analysis after chronic alcohol self-administration
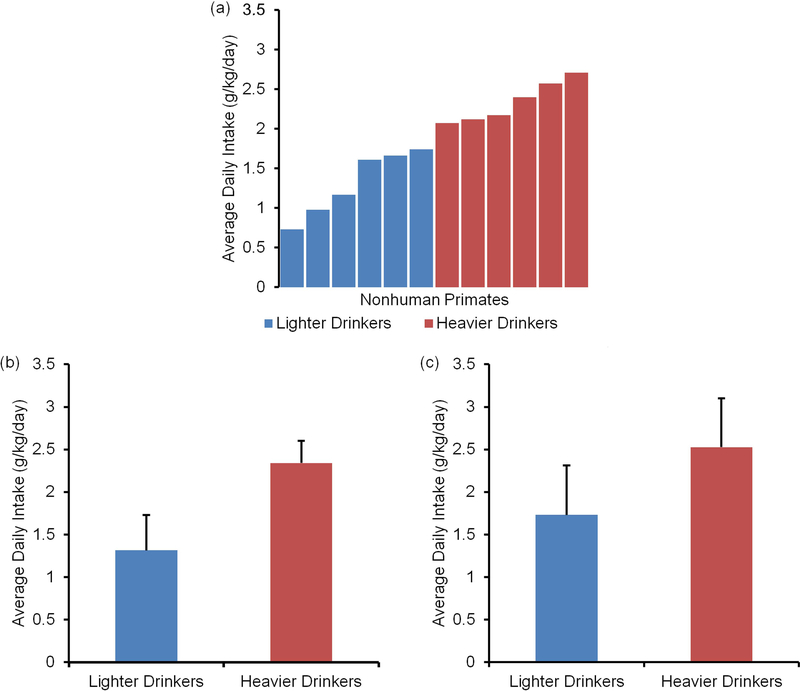
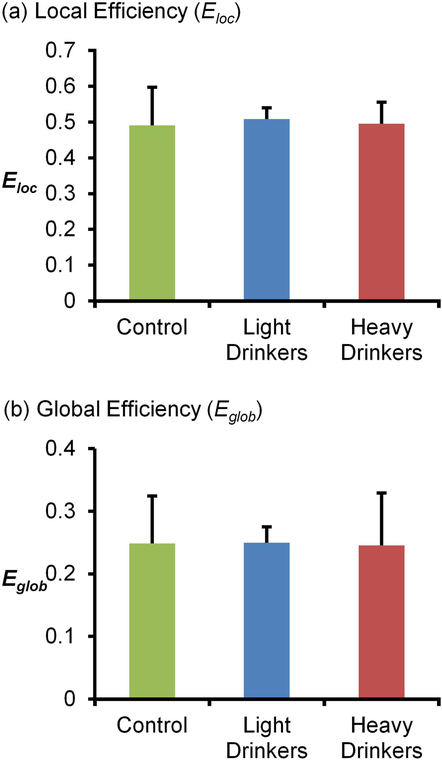
Animals from both cohorts were used to investigate group differences after 12 months of ethanol self-administration. The analysis contained animals from the ethanol drinking group (n=12) and control group (n=7). As seen in Figure 2, animals had a daily intake that varied from 0.73g/kg/day to 2.71 g/kg/day. Using a median split analysis (median=1.91 g/kg/day), animals were classified as heavier drinkers (n=6) if their alcohol intake was >2 g/kg/day while animals with alcohol intake ≤2 g/kg/day were classified as lighter drinkers (n=6). Blood samples were collected every fifth day beginning 7 hr after the start of the self-administration session in order to determine blood ethanol concentration (BEC). BEC ranged between 20–70 mg/dL, depending on average daily intake. Vervet monkeys metabolize EtOH at a rate of ~20 mg/dL/hr which is similar to metabolism in macaques and humans. Alcohol intake for heavier drinkers (2.34 ± 0.26 g/kg/day) was significantly higher than that for lighter drinkers (1.32 ± 0.42 g/kg/day, t=5.11, df=10, p<0.001). A drink is considered to be equivalent to 0.25 g/kg, therefore, the heavier drinkers consumed on average 9 drinks/day. Lighter drinkers consumed an average of 4–5 drinks/day. This intake pattern was preserved in the final three months of the self-administration period with heavier drinkers (2.52 ± 0.57 g/kg/day) drinking significantly more than lighter drinkers (1.73 ± 0.58g/kg/day, t=2.38, df=10, p<0.05). A one-way ANOVA comparing average graph metrics for heavier and lighter drinkers showed no significant group differences for Eloc and Eglob (Figure 3; Eloc, F(2,16)=0.1, p=0.91 and Eglob, F(2,16)=0.01, p=0.99). These results suggest that despite a significant difference in drinking pattern, this behavior was not associated with differences in global network metrics.
Figure 2. Ethanol intake pattern of drinking cohort of vervet monkeys.
(a) Animals had a daily intake that varied from 0.73 g/kg/day to 2.71 g/kg/day. (b) After 12 months of free access to alcohol, animals fell into subgroups: heavier drinkers (>2 g/kg/day) and lighter drinkers (<2 g/kg/day). The drinking pattern of the heavier drinkers was significantly higher than the lighter drinkers (p<0.0001). (c) An investigation of the drinking pattern in the last three months demonstrates the preservation of this intake pattern within the drinking cohort (p<0.01).
Figure 3. Comparison of average graph metrics after 12 months of chronic ethanol self-administration.
(a) Comparison of average graph metrics for local efficiency show no significant differences between control (0.49 ± 0.11SD), lighter drinkers (0.51 ± 0.03SD), and heavier drinkers (0.50 ± 0.06SD). (b) Similar results were found for global efficiency, with no significant differences between control (0.25 ± 0.08SD), lighter drinkers (0.25 ± 0.03SD), and heavier drinkers (0.25 ± 0.08SD).
Hub map analysis after 12 months of ethanol self-administration
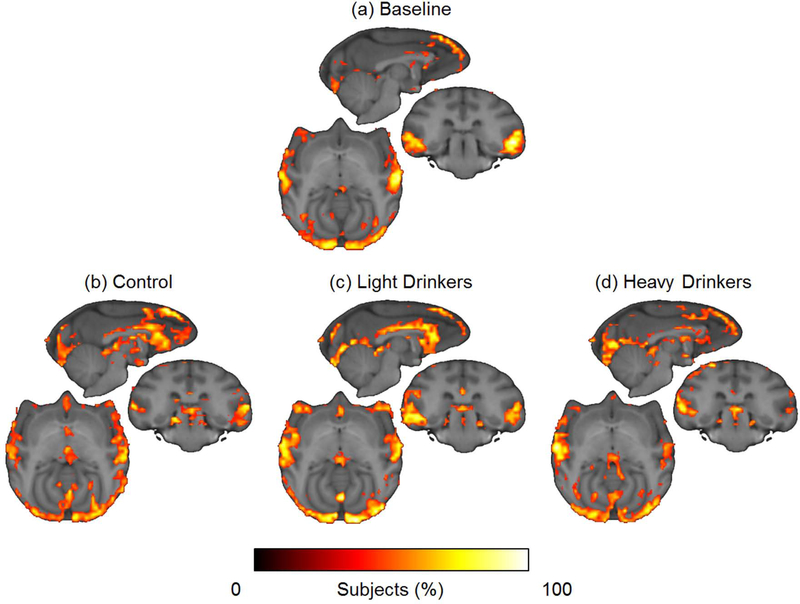
The network hubs were consistently located in the superior frontal cortex, ventrocaudal visual cortex, and superior temporal gyrus in the treatment naïve state (Figure 4a). After 12 months of self-administration behavior, the location of the hubs was consistent in both the controls and lighter drinkers (Figure 4b–c). In both these groups, however, the appearance of high degree hubs also occurred along the rostrocaudal extent of the anterior cingulate gyrus, most prominently in the anterior cingulate cortex. The hub structure in the heavier drinkers was similar (Figure 4d), except for apparent lower connectivity in the right superior temporal gyrus and a lack of hubs in the cingulate cortex.
Figure 4. Hub maps of top 15% of highest degree nodes in drinking/non-drinking vervet cohorts.
(a) Hub maps for baseline scans of animals in the second cohort reveal hub maps in the medial prefrontal cortex, anterior cingulate, cingulate cortex, visual cortex, parietal lobe, temporal lobe, and superior temporal gyrus. (b-c) After 12 months of ethanol self-administration, hub maps for animals in both cohorts appear similar for control and lighter drinkers. (d) However, heavier drinkers appear to lose hubs in the cingulate cortex and right superior temporal gyrus.
Region of interest analysis of altered brain regions
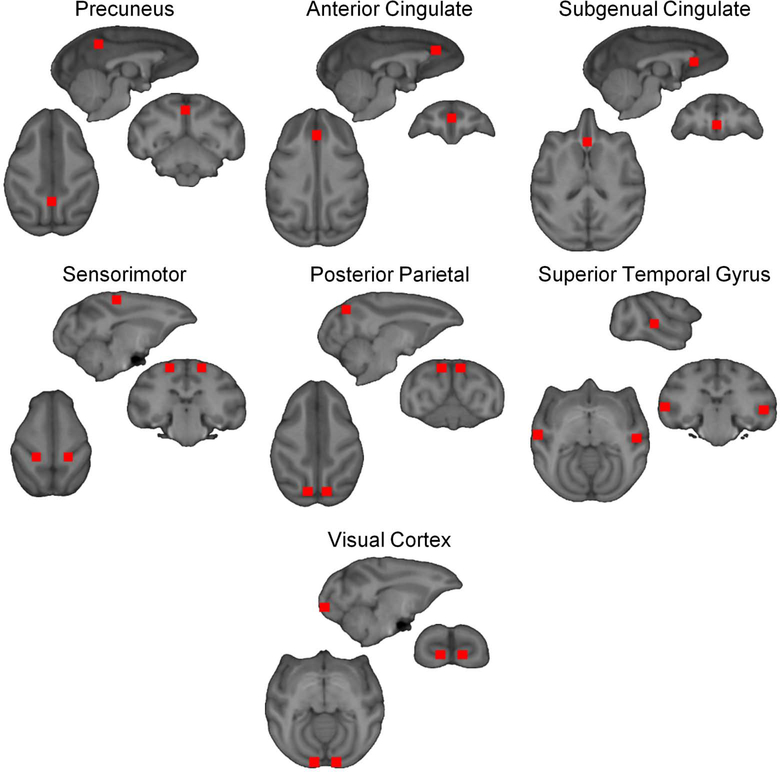
To test if the observed contrast in network topology reflected differences in node connectivity after 12 months of self-administration, ROI analysis was conducted in all three groups. ROIs were placed in the superior temporal gyri, anterior cingulate, subgenual cingulate, precuneus, posterior parietal cortex, and visual cortex (see Figure 5 for ROI locations); a one-way ANOVA comparing the control, lighter drinkers and heavier drinkers was used to test for significant differences between the groups. Post hoc comparisons were performed between each of the groups and a Bonferroni correction was applied with β=0.017. As shown in Table 2, connectivity in the left superior temporal gyrus and left visual cortex was not significantly different between all groups. Connectivity within the right superior temporal gyrus, precuneus, subgenual cingulate, posterior parietal and sensorimotor ROIs was significantly different between the groups. Post hoc comparison in all these groups revealed no significant differences between the control and lighter drinkers, but significant differences were found when the heavier drinkers were compared to the control and lighter drinkers. Significant differences were also found in the anterior cingulate, F(2,78)=13.06, p=1.28×10⁻⁵, and right occipital cortex, F(2,78)=5.31, p=6.88×10⁻³. Post hoc comparisons showed that connectivity in the anterior cingulate was significantly higher in the control group compared to the lighter drinking (p=4.09×10⁻⁵) and heavier drinking group (p=8.74×10⁻⁴). Post hoc comparisons for right occipital cortex only showed significant differences in connectivity between the control and heavier drinking group (p=2.74×10⁻⁴). After 12 months of self-administration, the heavier drinking group was significantly different in 7 of the 11 selected ROIs, which suggest that the observed differences in connectivity are intake dependent.
Figure 5. ROI locations for ANOVA analysis.
ROIs (4.5mm×4.5mm×4.5mm) were placed in seven (for a total of 11) regions in the brain for ANOVA analysis. Regions include the precuneus, anterior cingulate, subgenual cingulate, sensorimotor cortex, posterior parietal cortex, superior temporal gyrus, and visual cortex.
Table 2. ANOVA results of ROI average degree connectivity.
An ANOVA analysis was performed in ROIs for 12-month scans of animals in both cohorts. Significant differences in connectivity were found in all ROIs except for the left superior temporal gyrus and left visual cortex. The average degree was calculated in several ROIs across the brain. A single asterisk denotes p<0.05 between heavier drinkers and control. A double asterisk denotes p<0.05 between heavier drinkers compared to lighter drinkers and control. A triple asterisk denotes p<0.05 between control and drinkers (heavier and lighter).
| Region of interest | F | p | |
|---|---|---|---|
| precuneus | 50.85 | 7.31×10⁻¹⁵ | ** |
| superior temporal gyrus L | 0.21 | 0.81 | |
| superior temporal gyrus R | 19.35 | 1.50×10⁻⁷ | ** |
| anterior cingulate | 13.06 | 1.28×10⁻⁵ | *** |
| subgenual cingulate | 10.13 | 1.23×10⁻⁴ | ** |
| posterior parietal L | 7.23 | 1.32×10⁻³ | ** |
| posterior parietal R | 9.67 | 1.77×10⁻⁴ | ** |
| sensorimotor L | 13.39 | 1.00×10⁻⁵ | ** |
| sensorimotor R | 13.37 | 1.02×10⁻⁵ | ** |
| visual cortex L | 1.52 | 0.23 | |
| visual cortex R | 5.31 | 6.88×10⁻³ | * |
Regional connectivity analysis
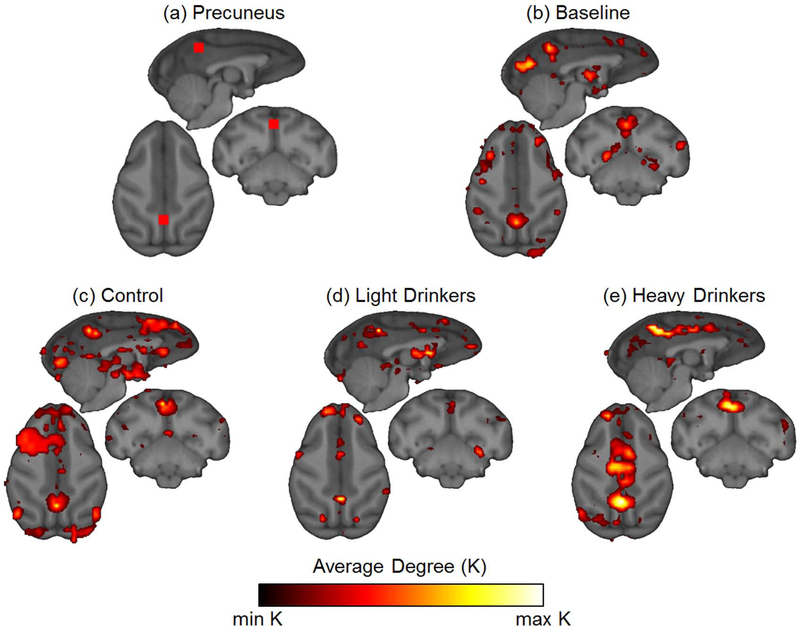
Comparison of connectivity maps between groups showed little difference in the location of highly connected nodes except when ROIs were placed in the precuneus (Figure 6a) and the anterior cingulate gyrus (Figure 7a). At baseline, all animals showed secondary connections from the precuneus to the thalamus, superior frontal gyrus, and multiple regions of visual cortex (Figure 6b). At 12 months, this same connectivity pattern was evident in the control group (Figure 6c) with additional connectivity to the left superior frontal and the subgenual cingulate gyri. This connectivity pattern was also evident in the lighter drinking group, except high degree connections were less prevalent. Nonetheless, secondary connections were present with the superior frontal gyrus and the thalamus, but were less extensive in the visual cortex (Figure 6d). Unlike the controls, the lighter drinking group also displayed secondary connections between the precuneus and the subgenual cingulate gyrus. The heavier drinking group showed similar secondary connections to the lighter drinkers and controls in the left superior frontal gyrus. However, the heavier drinking group exhibited the greatest deviation from baseline with secondary connections appearing along a large portion of the anterior cingulate gyrus (Figure 6e).
Figure 6. Neighborhood maps of precuneus ROI.
(a) Nodes connections were mapped to the neighbors of nodes in precuneus ROI. (b) Using the baseline scans of animals in the second cohort, neighborhood connections of nodes in the precuneus were connected to the visual cortex, thalamus, and superior frontal gyrus. (c) Control animals from both cohorts at 12 months had similar connectivity to the baseline scans. (d-e) The drinking group from both cohorts at 12 months showed greater connectivity in the cingulate cortex, but most pronounced in the anterior cingulate cortex of the heavy drinking group.
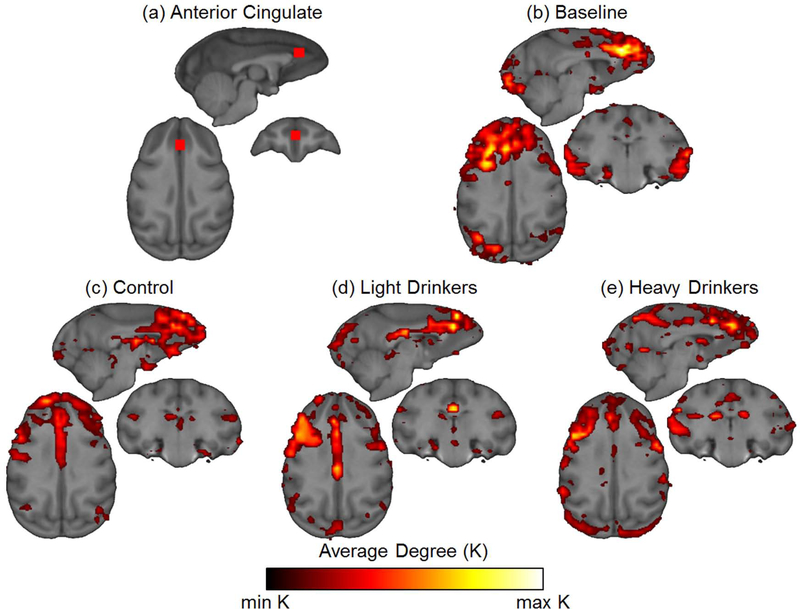
Figure 7. Neighborhood maps of anterior cingulate ROI.
(a) Nodes connections were mapped to the neighbors of nodes in anterior cingulate ROI. (b) Using the baseline scans of animals in the second cohort, neighborhood connections were found in the superior frontal gyrus, superior temporal gyrus and visual cortex at baseline (c) Control animals from both cohorts at 12 months show connectivity was localized to the superior frontal gyrus and subgenual cingulate. (d-e) 12 month scans from both cohorts of the drinking group also showed connectivity in the frontal gyrus, but there was also increased connectivity across the cingulate cortex.
Connectivity maps from the anterior cingulate ROI showed secondary connections across a large portion of superior and middle frontal gyri, visual cortex, and superior temporal gyri at baseline (Figure 7b). At 12 months, the control group exhibited similar spatial patterns of connectivity, although connections were considerably reduced in number in all locations (Figure 7c). Within both drinking groups, there were more connections from the anterior cingulate ROI to other portions of the anterior cingulate gyrus (Figure 7d–e). However, in the heavier drinking group, secondary connections were also present in the precuneate gyrus. These results indicate that there are significant connectivity differences across the brain, which are most pronounced in the regions associated with the precuneus and anterior cingulate. In addition, many of these differences are intake dependent as connectivity maps of the heavier drinking group showed a greater divergence from baseline than the control and lighter drinking groups.
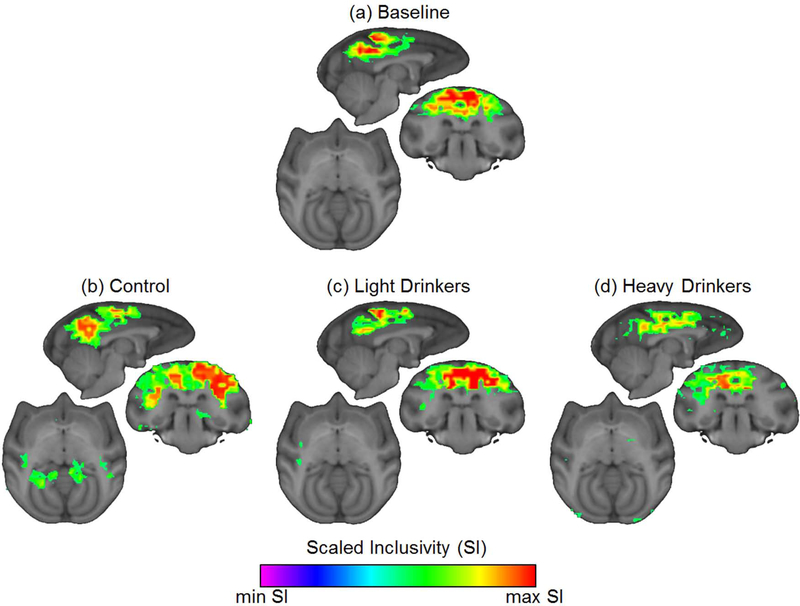
Community structure analysis
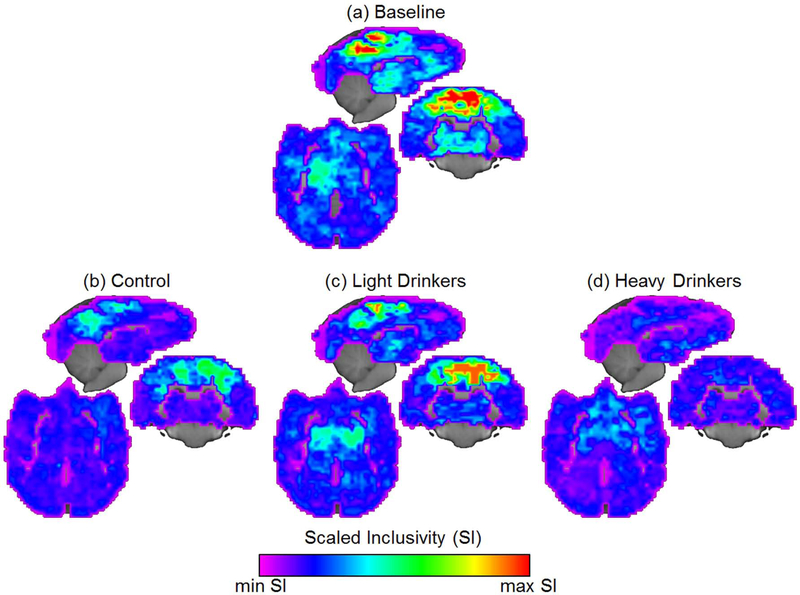
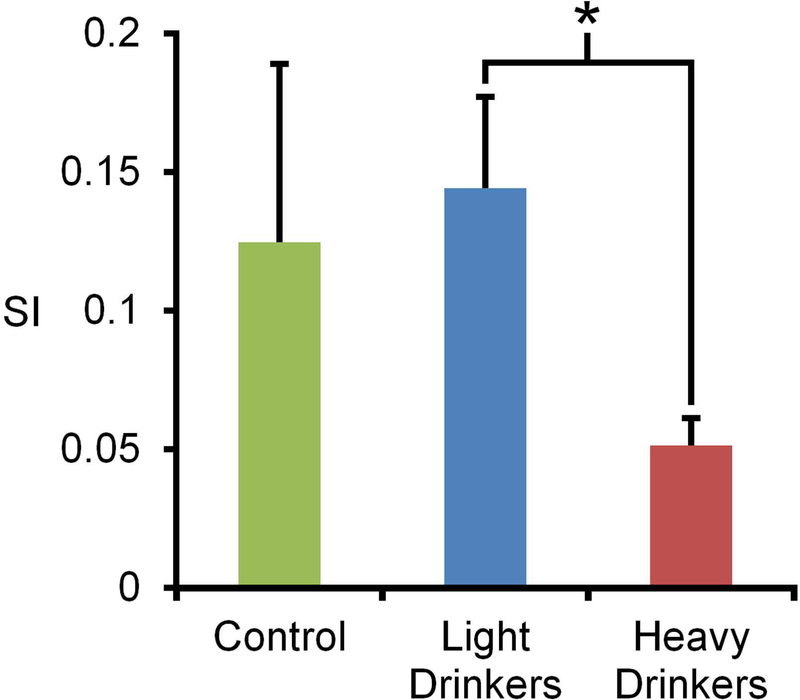
A one-way ANOVA analysis of community structure indicated that there were no significant differences in the overall modularity for the control (0.57 ± 0.03SD), lighter drinkers (0.61 ± 0.07SD) and heavier drinkers (0.63 ± 0.06SD) F(2,16)=2.81, p=0.09. Scaled inclusivity (SI) analysis was performed to identify regional differences in community organization. At baseline, there were prominent areas of consistent community structure in the precuneus and somatosensory regions. After 12 months of self-administration, this pattern remained in the control and lighter drinking groups, but was virtually absent in the heavier drinking group (Figure 8). Further exploration of this finding was focused on the actual network community that encompassed the precuneus and somatomotor cortices. A single consistent community was found to encompass both the precuneus and the somatomotor cortex in the treatment naïve, control, and lighter drinking group. In contrast, the heavier drinking group showed an overall reduction of consistency and the inclusion of the cingulate cortex (Figure 9). Focusing on the precuneus module, a one-way ANOVA found a significant difference in consistency between the groups F(2,16)=5.35, p=1.66×10⁻². Post hoc comparisons found a significant difference between the lighter drinkers and heavier drinkers (p=7.82×10⁻⁴) (Figure 10). These results highlight that the differences seen in the community structure are consistent with those seen in the connectivity maps.
Figure 8. Community structure consistency in vervet groups.
(a) The precuneus/posterior cingulate and somatosensory regions were the most consistent regions in the baseline scans of animals in the second cohort. (b-c) These regions appear to remain consistent in the control and lighter drinkers after 12 months of ethanol self-administration. (d) However, in the heavier drinkers, these regions are not highly consistent.
Figure 9. Consistency of precuneus module.
Scaled inclusivity of the module comprising the precuneus was evaluated across all groups. (a) Animals at baseline reveal that the module is strongly interconnected with itself along with the motor and somatosensory cortex. (b-c) This pattern holds after 12-months of self-administration in the control and lighter drinking group. (d) However, in the heavier drinking group there is stronger interconnectivity with the precuneus and the cingulate cortex.
Figure 10. Mean SI values for precuneus module in vervet groups.
The average SI values for control (0.12 ± 0.06SD), lighter drinkers (0.14 ± 0.03SD), and heavier drinkers (0.05 ± 0.01SD). A one-way ANOVA found a significant difference between the groups; post hoc comparisons found a significant difference between lighter drinkers and heavier drinkers, F(2,16)=5.35, p=1.66×10⁻². An asterisk indicates significance between the groups.
Discussion
Differences in brain network organization due to chronic alcohol use
One of the main findings in this study is that chronic ethanol self-administration appears to alter the functional organization of the brain as evidenced by differences in network topology and significant connectivity differences found in areas associated with the default mode network. Moreover, these differences are dependent on level of ethanol intake with heavier intake demonstrating more divergent connectivity. While average, or whole-brain, graph metrics did not show any significant differences, there were specific regional differences in connectivity between the drinking and non-drinking groups. The number of connections in the right superior temporal gyrus was significantly lower in the heavier drinking group. In addition, the drinking group (heavier and lighter drinkers) showed lower connectivity in the anterior cingulate and subgenual cingulate gyrus compared to controls. Significant connectivity differences were also found in the posterior parietal, sensorimotor and visual cortices. Although significant differences were only found in the right visual cortex between the control and heavier drinking group, the heavier drinking group was found to be significantly different from both the controls and lighter drinkers in posterior parietal and sensorimotor cortices.
Connectivity differences in the anterior cingulate and subgenual cingulate ROIs appear to reflect those observed in the precuneus. The number of connections in the precuneus significantly increased in the heavier drinking group. These differences were associated with increased connectivity between the precuneus and the cingulate cortex as demonstrated by connectivity maps and the decrease of consistency in the precuneus module for the heavier drinkers (Figure 8d and Figure 9d). When looking at connections across the entire cingulate, there is a noteworthy shift in hub distribution as evidenced by the appearance of hubs in the cingulate after 12 months in the controls and lighter drinkers. This shift in hub structure may reflect a training effect; however, given the low sample size of control animals that received both scans (n=3), it is difficult to determine the reason for increased connectivity in the cingulate.
Group comparisons of the precuneus module found a significant difference between the lighter and heavier drinking groups. This finding is notable because it further demonstrates that ethanol-associated differences in network structure are intake dependent.
Impact of ethanol on functional systems
Connectivity differences observed in the posterior parietal ROIs are noteworthy because damage to the posterior parietal cortex can lead to sensorimotor deficits. Studies in humans have demonstrated a dose-dependent effect of ethanol on the visuomotor system (Calhoun et al., 2004), and have been shown to alter the effective connectivity of the posterior parietal cortices and visual cortex (Luchtmann et al., 2013). These differences may also account for those observed in the sensorimotor and visual cortices.
In humans, working memory is associated with the prefrontal cortex, including the anterior cingulate, temporal lobes and subcortical areas such as thalamus and basal ganglia (Constantinidis and Procyk, 2004, Lenartowicz and McIntosh, 2005). Accounting for the decreased connectivity observed in the right superior temporal gyrus, this may reflect deficits in working memory as it serves as a multimodal region for object- and space-related processing of the surroundings in NHPs (Karnath, 2001). Studies in rats found chronic ethanol exposure altered working memory processes (Santín et al., 2000, Lukoyanov et al., 2003), while studies in adolescent rhesus macaques found a delay in visuo-spatial associative memory and spatial working memory after chronic alcohol exposure (Crean et al., 2011). Indeed, given that the superior temporal gyrus is consistent with the default mode network in NHPs (Hutchison et al., 2011, Margulies et al., 2009, Vincent et al., 2007, Telesford et al., 2013), disruption of this region may impact working memory. The findings in superior temporal gyrus may also reflect a response to scanner noise as this region contains the primary auditory cortex. Nonetheless, if connectivity reflects an auditory response to the scanner, there is still an intake-dependent effect associated in the right superior temporal gyrus.
Human functional magnetic resonance imaging (fMRI) studies found increased activity in the somatosensory cortex and cingulate after a passive training task (Carel et al., 2000), which may account for the increased connectivity observed in the cingulate gyrus in the controls and lighter drinkers. In humans, a functional connectivity study of changes to the default mode network in chronic alcohol users found increased connectivity between the precuneus and cerebellum (Chanraud et al., 2011). A study of acute alcohol consumption documented changes to the resting state network in the subcallosal cortex, left temporal fusiform cortex and the left inferior temporal gyrus (Spagnolli et al., 2013). In our investigation, higher connectivity was found in the precuneus of the heavier drinking group; however, since the currently available atlas only provided a mask for cerebral gray matter, connections to the cerebellum, as in Chanraud et al., (2011) were not included in the analysis. It is also noted that the precuneus module was significantly different between the lighter and heavier drinking group. In contrast, despite having significant differences in connectivity, the control group showed no difference in the precuneus module. We believe this reflects high variability in the normal population. By introducing alcohol to the animals, there is a consistent shift in network connectivity and community structure that results in less variability. Nonetheless, differences in the precuneus in the heavier drinking group were associated with higher interconnectivity between the precuneus and anterior cingulate cortex (Figure 9). The cingulate gyrus is implicated in inhibitory control and disruption of this region results in impulsivity (Koob and Volkow, 2010). The cingulate cortex has also been associated with alcohol craving (Vollstädt-Klein et al., 2011, Schacht et al., 2013, Breese et al., 2011); cue elicited activation occurs in the parietal and temporal regions, including the posterior cingulate, precuneus and superior temporal gyrus in heavy drinkers and individuals with alcohol disuse disorder (Schacht et al., 2013).
Although this study was performed in anesthetized animals, the differences seen in the brain are consistent with changes associated with chronic alcohol use in humans. Functional connectivity studies in the precuneus have demonstrated connectivity to the superior temporal sulcus in the macaque (Zhang and Li, 2012). The precuneus has also been associated with the default mode network in several NHP studies (Telesford et al., 2013, Hutchison et al., 2011, Vincent et al., 2007). Additionally, a recent study in the awake marmoset found default mode network activity consistent with functional organization of the brain under anesthetized conditions, particularly in the precuneus (Belcher et al., 2013). Our results suggest that the precuneus, superior temporal gyrus, and the cingulate cortex are affected by chronic ethanol exposure, which alters the organization of the default mode network.
Limitations
With the current data, comparison of baseline and 12-month scans would necessitate a mixed-design statistical analysis as the second cohort received two scans (baseline and 12-month) compared to the first cohort, which only received the 12-month scan. Although there is sufficient data to compare control and drinking animals after the free access period, the number of control animals that received both scans (baseline and 12-month) was low. Consequently, the low sample size for controls (n=3) in the second cohort would make paired comparison underpowered. To address this, statistical analysis was limited to the 12-month scans, with baseline scans acting as a qualitative assessment of hub structure and community structure. While this approach limits our ability to assess within animal changes between the baseline and 12-month scan, we were still able to assess group differences that differentiate control, lighter drinkers and heavier drinkers.
Another potential caveat of this data is the intake pattern of animals. In the literature, heavy drinking in NHPs elicited by the self-administration experimental design we used is denoted by ethanol intake >3 g/kg/day, while non-heavy drinking is characterized by <3 g/kg/day (Vivian et al., 2001, Grant and Bennett, 2003). Although the vervet monkeys in this study did not in large part achieve daily averages of >3 g/kg, during the free access phase of the study the animals self-selected into groups with intakes that averaged 0.73 – 2.57 g/kg. During the last 3 months, intake ranged from 1.06–3.11 g/kg. This level of drinking allowed a comparison of heavier and lighter drinkers, with lighter drinkers often appearing closer to controls in terms of node connectivity and community structure consistency.
Of great interest is whether the observation of hubs in the cingulate after 12 months in the control and lighter drinking group may be due to a training effect. There is evidence that long-term training does cause functional and structural changes in the brain (Lewis et al., 2009, Taubert et al., 2011). However, while we are confident that this self-administration model has predictive value in determining which animals will ultimately become heavy drinkers, a larger sample size would help to differentiate the differences that can be attributed to operant responding and to ethanol intake.
A final caveat lies in the nature of graph analysis itself. The main difference between graph analysis and traditional fMRI is that graph theory does not measure activity, but rather, it measures strong correlations of BOLD signal across the brain. In contrast to studies that assess anatomic connectivity (Hagmann et al., 2008), functional connections can highlight regions that may be connected directly or indirectly.
Conclusion
The main finding of this study is that chronic ethanol exposure is indicative of altered brain network organization as demonstrated by differences in the default mode network organization of drinking and non-drinking vervet monkeys. Studies in humans have highlighted the precuneus, superior temporal gyrus and anterior cingulate as regions affected by alcohol in resting state and task-based studies. Although these animals were anesthetized, significant differences were still found in key regions, which indicate that group differences attributed to alcohol can still be observed under the given experimental conditions. More importantly, the observed differences in brain network organization appear to be intake-dependent. From a qualitative and quantitative standpoint, we observed differences in select brain regions that can differentiate between drinkers and controls, as well as, between lighter and heavier drinkers. The observed differences in the default mode network in monkeys are consistent with results found in human studies. Nonetheless, future studies are needed to help distinguish between differences that can be attributed to operant training and alcohol.
Supplementary Material
Acknowledgments
Sources of Support
Supported in part by NIAAA: AA019893 (QKT), AA019431 (JBD), AA017710 (JBD), AA014106 (DPF).
References
- Anticevic A, Cole MW, Murray JD, Corlett PR, Wang X-J & Krystal JH 2012. The role of default network deactivation in cognition and disease. Trends in cognitive sciences, 16, 584–592. [DOI] [PMC free article] [PubMed] [Google Scholar]
- Belcher AM, Yen CC, Stepp H, Gu H, Lu H, Yang Y, Silva AC & Stein EA 2013. Large-Scale Brain Networks in the Awake, Truly Resting Marmoset Monkey. The Journal of Neuroscience, 33, 16796–16804. [DOI] [PMC free article] [PubMed] [Google Scholar]
- Boden JM & Fergusson DM 2011. Alcohol and depression. Addiction, 106, 906–914. [DOI] [PubMed] [Google Scholar]
- Breese GR, Sinha R & Heilig M 2011. Chronic alcohol neuroadaptation and stress contribute to susceptibility for alcohol craving and relapse. Pharmacology & Therapeutics, 129, 149–171. [DOI] [PMC free article] [PubMed] [Google Scholar]
- Buckner RL, Andrews-Hanna JR & Schacter DL 2008. The brain’s default network. Annals of the New York Academy of Sciences, 1124, 1–38. [DOI] [PubMed] [Google Scholar]
- Bullmore E & Sporns O 2009. Complex brain networks: Graph theoretical analysis of structural and functional systems. Nat Rev Neurosci, 10, 186–198. [DOI] [PubMed] [Google Scholar]
- Calhoun VD, Altschul D, Mcginty V, Shih R, Scott D, Sears E & Pearlson GD 2004. Alcohol intoxication effects on visual perception: An fMRI study. Human Brain Mapping, 21, 15–26. [DOI] [PMC free article] [PubMed] [Google Scholar]
- Carel C, Loubinoux I, Boulanouar K, Manelfe C, Rascol O, Celsis P & Chollet F 2000. Neural Substrate for the Effects of Passive Training on Sensorimotor Cortical Representation[colon] A Study With Functional Magnetic Resonance Imaging in Healthy Subjects. J Cereb Blood Flow Metab, 20, 478–484. [DOI] [PubMed] [Google Scholar]
- Chanraud S, Pitel A-L, Pfefferbaum A & Sullivan EV 2011. Disruption of functional connectivity of the default-mode network in alcoholism. Cerebral Cortex, 21, 2272–2281. [DOI] [PMC free article] [PubMed] [Google Scholar]
- Constantinidis C & Procyk E 2004. The primate working memory networks. Cognitive, Affective and Behavioral Neuroscience, 4, 444–465. [DOI] [PMC free article] [PubMed] [Google Scholar]
- Crean RD, Vandewater SA, Katner SN, Huitron-Resendiz S & Taffe MA 2011. Chronic alcohol consumption impairs visuo-spatial associative memory in periadolescent rhesus monkeys. Drug and Alcohol Dependence, 114, 31–40. [DOI] [PMC free article] [PubMed] [Google Scholar]
- Dawson DA, Grant BF, Stinson FS, Chou PS, Huang B & Ruan WJ 2005. Recovery from DSM-IV alcohol dependence: United States, 2001–2002. Addiction, 100, 281–292. [DOI] [PubMed] [Google Scholar]
- Fein G, Di Sclafani V, Cardenas VA, Goldmann H, Tolou-Shams M & Meyerhoff DJ 2002. Cortical gray matter loss in treatment-naïve alcohol dependent individuals. Alcoholism: Clinical and Experimental Research, 26, 558–564. [PMC free article] [PubMed] [Google Scholar]
- Fortunato S 2010. Community detection in graphs. Phys Rep, 486, 75–174. [Google Scholar]
- Frye MA & Salloum IM 2006. Bipolar disorder and comorbid alcoholism: prevalence rate and treatment considerations. Bipolar Disorders, 8, 677–685. [DOI] [PubMed] [Google Scholar]
- Girvan M & Newman MEJ 2002. Community structure in social and biological networks. Proc Natl Acad Sci U S A, 99, 7821–7826. [DOI] [PMC free article] [PubMed] [Google Scholar]
- Grant BF & Harford TC 1995. Comorbidity between DSM-IV alcohol use disorders and major depression: results of a national survey. Drug and Alcohol Dependence, 39, 197–206. [DOI] [PubMed] [Google Scholar]
- Grant KA & Bennett AJ 2003. Advances in nonhuman primate alcohol abuse and alcoholism research. Pharmacology & Therapeutics, 100, 235–255. [DOI] [PubMed] [Google Scholar]
- Grant KA, Leng X, Green HL, Szeliga KT, Rogers LSM & Gonzales SW 2008. Drinking typography established by scheduled induction predicts chronic heavy drinking in a monkey model of ethanol self-administration. Alcoholism: Clinical and Experimental Research, 32, 1824–1838. [DOI] [PMC free article] [PubMed] [Google Scholar]
- Hagmann P, Cammoun L, Gigandet X, Meuli R, Honey CJ, Wedeen VJ & Sporns O 2008. Mapping the Structural Core of Human Cerebral Cortex. PLoS Biol, 6, e159. [DOI] [PMC free article] [PubMed] [Google Scholar]
- Hayasaka S & Laurienti P 2010. Comparison of characteristics between region- and voxel-based network analyses in resting-state fMRI data. Neuroimage, 50, 499–508. [DOI] [PMC free article] [PubMed] [Google Scholar]
- Hutchison RM, Leung LS, Mirsattari SM, Gati JS, Menon RS & Everling S 2011. Resting-state networks in the macaque at 7T. NeuroImage, 56, 1546–1555. [DOI] [PubMed] [Google Scholar]
- Karnath H-O 2001. New insights into the functions of the superior temporal cortex. Nat Rev Neurosci, 2, 568–576. [DOI] [PubMed] [Google Scholar]
- Koob GF & Volkow ND 2010. Neurocircuitry of Addiction. Neuropsychopharmacology, 35, 1051–1051. [DOI] [PMC free article] [PubMed] [Google Scholar]
- Lenartowicz A & Mcintosh AR 2005. The Role of Anterior Cingulate Cortex in Working Memory is Shaped by Functional Connectivity. Journal of Cognitive Neuroscience, 17, 1026–1042. [DOI] [PubMed] [Google Scholar]
- Levin JM, Ross MH, Mendelson JH, Kaufman MJ, Lange N, Maas LC, Mello NK, Cohen BM & Renshaw PF 1998. Reduction in BOLD fMRI response to primary visual stimulation following alcohol ingestion. Psychiatry Research: Neuroimaging, 82, 135–146. [DOI] [PubMed] [Google Scholar]
- Lewis CM, Baldassarre A, Committeri G, Romani GL & Corbetta M 2009. Learning sculpts the spontaneous activity of the resting human brain. Proceedings of the National Academy of Sciences. [DOI] [PMC free article] [PubMed] [Google Scholar]
- Luchtmann M, Jachau K, Adolf D, Baecke S, Lützkendorf R, Müller C, Tempelmann C & Bernarding J 2013. Decreased effective connectivity in the visuomotor system after alcohol consumption. Alcohol, 47, 195–202. [DOI] [PubMed] [Google Scholar]
- Lukoyanov N, Pereira P, Paula-Barbosa M & Cadete-Leite A 2003. Nerve growth factor improves spatial learning and restores hippocampal cholinergic fibers in rats withdrawn from chronic treatment with ethanol. Experimental Brain Research, 148, 88–94. [DOI] [PubMed] [Google Scholar]
- Mantini D, Gerits A, Nelissen K, Durand J-B, Joly O, Simone L, Sawamura H, Wardak C, Orban GA, Buckner RL & Vanduffel W 2011. Default mode of brain function in monkeys. The Journal of Neuroscience, 31, 12954–12962. [DOI] [PMC free article] [PubMed] [Google Scholar]
- Margulies DS, Vincent JL, Kelly C, Lohmann G, Uddin LQ, Biswal BB, Villringer A, Castellanos FX, Milham MP & Petrides M 2009. Precuneus shares intrinsic functional architecture in humans and monkeys. Proceedings of the National Academy of Sciences. [DOI] [PMC free article] [PubMed] [Google Scholar]
- Meunier D, Lambiotte R, Fornito A, Ersche K & Bullmore ET 2009. Hierarchical modularity in human brain functional networks. Front Neuroinform, 3. [DOI] [PMC free article] [PubMed] [Google Scholar]
- Miranda-Dominguez O, Mills BD, Grayson D, Woodall A, Grant KA, Kroenke CD & Fair DA 2014. Bridging the gap between the human and macaque connectome: A quantitative comparison of global interspecies structure-function relationships and network topology. The Journal of Neuroscience, 34, 5552–5563. [DOI] [PMC free article] [PubMed] [Google Scholar]
- Pfefferbaum A, Lim KO, Zipursky RB, Mathalon DH, Rosenbloom MJ, Lane B, Ha CN & Sullivan EV 1992. Brain gray and white matter volume loss accelerates with aging in chronic alcoholics: A quantitative MRI study. Alcoholism: Clinical and Experimental Research, 16, 1078–1089. [DOI] [PubMed] [Google Scholar]
- Pfefferbaum A, Sullivan EV, Rosenbloom MJ, Mathalon DH & Lim KO 1998. A controlled study of cortical gray matter and ventricular changes in alcoholic men over a 5-year interval. Archives of General Psychiatry, 55, 905–912. [DOI] [PubMed] [Google Scholar]
- Raichle ME, Macleod AM, Snyder AZ, Powers WJ, Gusnard DA & Shulman GL 2001. A default mode of brain function. Proceedings of the National Academy of Sciences, 98, 676–682. [DOI] [PMC free article] [PubMed] [Google Scholar]
- Rilling JK, Barks SK, Parr LA, Preuss TM, Faber TL, Pagnoni G, Bremner JD & Votaw JR 2007. A comparison of resting-state brain activity in humans and chimpanzees. Proceedings of the National Academy of Sciences, 104, 17146–17151. [DOI] [PMC free article] [PubMed] [Google Scholar]
- Ruan J & Zhang W 2008. Identifying network communities with a high resolution. Phys Rev E Stat Nonlin Soft Matter Phys, 77, 016104. [DOI] [PubMed] [Google Scholar]
- Rubinov M & Sporns O 2010. Complex network measures of brain connectivity: Uses and interpretations. NeuroImage, 52, 1059–1069. [DOI] [PubMed] [Google Scholar]
- SantíN LJ, Rubio S, Begega A & Arias JL 2000. Effects of chronic alcohol consumption on spatial reference and working memory tasks. Alcohol, 20, 149–159. [DOI] [PubMed] [Google Scholar]
- Schacht JP, Anton RF & Myrick H 2013. Functional neuroimaging studies of alcohol cue reactivity: a quantitative meta-analysis and systematic review. Addiction Biology, 18, 121–133. [DOI] [PMC free article] [PubMed] [Google Scholar]
- Spagnolli F, Cerini R, Cardobi N, Barillari M, Manganotti P, Storti S & Mucelli RP 2013. Brain modifications after acute alcohol consumption analyzed by resting state fMRI. Magnetic Resonance Imaging. [DOI] [PubMed] [Google Scholar]
- Steen M, Hayasaka S, Joyce K & Laurienti P 2011. Assessing the consistency of community structure in complex networks. Physical Review E, 84, 016111. [DOI] [PMC free article] [PubMed] [Google Scholar]
- Taubert M, Lohmann G, Margulies DS, Villringer A & Ragert P 2011. Long-term effects of motor training on resting-state networks and underlying brain structure. NeuroImage, 57, 1492–1498. [DOI] [PubMed] [Google Scholar]
- Telesford QK, Laurienti PJ, Friedman DP, Kraft RA & Daunais JB 2013. The effects of alcohol on the nonhuman primate brain: A network science approach to neuroimaging. Alcoholism: Clinical and Experimental Research, In press. [DOI] [PMC free article] [PubMed] [Google Scholar]
- Telesford QK, Simpson SL, Burdette JH, Hayasaka S & Laurienti PJ 2011. The brain as a complex system: using network science as a tool for understanding the brain. Brain Connectivity, 1, 295–308. [DOI] [PMC free article] [PubMed] [Google Scholar]
- Trim RS, Simmons AN, Tolentino NJ, Hall SA, Matthews SC, Robinson SK, Smith TL, Padula CB, Paulus MP, Tapert SF & Schuckit MA 2010. Acute ethanol effects on brain activation in low- and high-level responders to alcohol. Alcoholism: Clinical and Experimental Research, 34, 1162–1170. [DOI] [PMC free article] [PubMed] [Google Scholar]
- Vincent JL, Patel GH, Fox MD, Snyder AZ, Baker JT, Van Essen DC, Zempel JM, Snyder LH, Corbetta M & Raichle ME 2007. Intrinsic functional architecture in the anaesthetized monkey brain. Nature, 447, 83–86. [DOI] [PubMed] [Google Scholar]
- Vivian JA, Green HL, Young JE, Majerksy LS, Thomas BW, Shively CA, Tobin JR, Nader MA & Grant KA 2001. Induction and Maintenance of Ethanol Self-Administration in Cynomolgus Monkeys (Macaca fascicularis): Long-Term Characterization of Sex and Individual Differences. Alcoholism: Clinical and Experimental Research, 25, 1087–1097. [PubMed] [Google Scholar]
- Vollstädt-Klein S, Loeber S, Kirsch M, Bach P, Richter A, Bühler M, Von Der Goltz C, Hermann D, Mann K & Kiefer F 2011. Effects of cue-exposure treatment on neural cue reactivity in alcohol dependence: A randomized trial. Biological Psychiatry, 69, 1060–1066. [DOI] [PubMed] [Google Scholar]
- Watts DJ & Strogatz SH 1998. Collective dynamics of ‘small-world’ networks. Nature, 393, 440–442. [DOI] [PubMed] [Google Scholar]
- Zhang S & Li C-SR 2012. Functional connectivity mapping of the human precuneus by resting state fMRI. NeuroImage, 59, 3548–3562. [DOI] [PMC free article] [PubMed] [Google Scholar]
Associated Data
This section collects any data citations, data availability statements, or supplementary materials included in this article.


