

Summary
To delineate the ontogeny of the mammalian endoderm, we generated 112,217 single-cell transcriptomes representing all endoderm populations within the mouse embryo until midgestation. By employing graph-based approaches, we modelled differentiating cells for spatio-temporal characterization of developmental trajectories and defined the transcriptional architecture that accompanies the emergence of the first (primitive or extra-embryonic) endodermal population and its sister pluripotent (embryonic) epiblast lineage. We uncovered a relationship between descendants of these two lineages, whereby epiblast cells differentiate into endoderm at two distinct time-points, before and during gastrulation. Trajectories of endoderm cells were mapped as they acquired embryonic versus extra-embryonic fates, and as they spatially converged within the nascent gut endoderm; revealing them to be globally similar but retaining aspects of their lineage history. We observed the regionalized identity of cells along the anterior-posterior axis of the emergent gut tube, reflecting their embryonic or extra-embryonic origin, and their coordinate patterning into organ-specific territories.
Keywords: mouse embryo, endoderm, epiblast, primitive endoderm, visceral endoderm, definitive endoderm, gut endoderm, endodermal organs, scRNA-seq, developmental trajectories, cell fate, computational biology, lineage tracing
Introduction
The gut endoderm is the precursor of the respiratory and digestive tracts, and their associated organs1,2 (Fig. 1). Endoderm cells emerge twice during mammalian development. Primitive (extra-embryonic) endoderm (PrE) cells arise at the blastocyst stage, around mouse embryonic (E) day 3.5–4.03, and predominantly contribute to parietal and visceral yolk sac endoderm. Later, around E7.0, definitive (embryonic) endoderm (DE) is specified from pluripotent epiblast (EPI) at gastrulation4. Our previous studies revealed the gut endoderm to be comprised of cells of both PrE and DE (Extended Data Fig. 1a)5–7. Common endodermal genes are expressed by both cell types hampering marker-based discrimination of embryonic and extra-embryonic descendants8,9. We therefore sought to characterize the transcriptional profiles of all endoderm populations within the mouse embryo; from the blastocyst to midgestation (E3.5-E8.75), when the gut tube becomes regionally patterned along its anterior-posterior (AP) axis.
Figure 1: Single-cell map of the mouse endoderm, from blastocyst to midgestation.

a, Schematic experimental, highlighting single-cell libraries collected across sequential stages. b, tSNE plot of all samples, each dot representing a single-cell, color-coded by cell type.
To analyze our data, we developed Harmony to bridge time-points and combined it with Palantir10,11, and used these algorithms to construct a spatio-temporal map of the developing endoderm. Palantir infers cell fate potential, providing a quantitative metric of plasticity, thus identifying when fate decisions occur. The data identified key bifurcation and convergence points of embryonic and extra-embryonic tissues leading to the establishment of distinct territories along the AP axis of the E8.75 gut tube, prior to the overt appearance of endodermal organs. In sum, this study provides the first comprehensive transcriptional characterization of the ontogeny of the endodermal organ system in a mammalian model.
Results
Cells were isolated from sequentially-staged wild-type mouse embryos between E3.5 and E8.75 for scRNA-sequencing (Fig. 1a). Due to their small size, whole embryos were used for isolations at pre- and early post-implantation (E3.5-E5.5), whereas endodermal tissues were isolated for cell-type enrichment from E6.5-E8.75 embryos (Extended Data Fig. 1b). To demarcate extra-embryonic (PrE/VE) endoderm cells in the gut tube5,7, we used the VE-specific Afp-GFP mouse line12 and isolated GFP-positive (extra-embryonic) and GFP-negative (embryonic) populations by flow cytometry after tissue dissociation at E7.5-E8.75 (Fig. 1a, Extended Data Fig. 1c, Supplementary Fig. 1). In total, we profiled 13 tissue types, each collected in duplicate or triplicate, representing 112,217 cells (Fig. 1b, Extended Data Fig. 1d, Supplementary Fig. 2). We ran each sample through our processing pipeline10,11,13 (Extended Data Fig. 2a, Supplementary Note 1), verified replicate reproducibility (Supplementary Fig. 2), before combining. Phenograph clustering14 identified cell types, with labels assigned based on gene expression and visualized using tSNE15. Comparison to bulk RNA-seq data demonstrated that isolation and dissociation did not alter cell proportions or transcriptional profiles (Extended Data Figs. 1c, 2b).
Following recent successes in reconstructing developmental trajectories from scRNA-seq16–19, we organized cells along trajectories to elucidate when and how fate decisions occur. To connect across time-points, we developed Harmony (Supplementary Note 2, Extended Data Fig. 3). Asynchronous differentiation results in a subset of more mature cells in one time-point being relatively closer to a subset of less mature cells in the following time-point, resulting in mutually-similar cells across time-points. Harmony uses these mutual nearest neighbours to construct an augmented kNN-graph that connects time-points (Extended Data Fig. 3a–f), without altering the underlying data matrix, and inputs into any kNN-graph based algorithms (Extended Data Fig. 3g).
We combined Harmony with Palantir10,11 (Supplementary Note 7), which takes as input a user-defined early start cell and infers pseudo-time and branch probabilities (BP): denoting for each cell state, its probability to reach each of the terminal fates in the system. These can be used to characterize gene expression dynamics. We define differentiation potential (DP) of a cell as the entropy of its fate probabilities, a measure of plasticity associated with each state. Regions along pseudo-time where DP drops represent points where lineage specification and commitment occur.
Emergence of primitive endoderm
The mammalian blastocyst comprises three lineages3; trophectoderm (TE), giving rise to the fetal portion of the placenta; EPI, the progenitor for most somatic tissues, germ cells and extra-embryonic mesoderm; and PrE, giving rise to the endodermal component of visceral and parietal yolk sacs, and gut endoderm7. Force directed layout following Harmony between E3.5 and E4.5 datasets illustrates the relationship between blastocyst lineages (Extended Data Fig. 4a–b). Based on the average diffusion distance10,11 from the bipotent inner cell mass (ICM), TE cells were substantially further away (13.9) from ICM than either EPI (0.41) or PrE (2.0) (Extended Data Fig. 4b, Methods) suggesting that the TE-vs.-ICM decision is complete before ICM cells make a PrE-vs.-EPI choice, and that EPI cells are phenotypically closer to ICM cells, than PrE (Extended Data Fig. 4c).
To pinpoint when fate decisions occur and characterize gene expression dynamics during commitment, TE cells were excluded, and Palantir10,11 applied using a Nanoghi cell (uncommitted ICM) as the start (Extended Data Fig. 4d–e). The changes in DP and BP suggest ICM lineage divergence into EPI and PrE occurs at E3.5 consistent with previous analyses using limited markers20,21 (Extended Data Fig. 4e–f). Two ICM clusters were identified; one representing uncommitted cells having equal propensity for PrE or EPI fates (purple), and another (green), that albeit uncommitted, had started to specify towards PrE or EPI (Extended Data Fig. 4d, g–h, Supplementary Table 1). We also identified two PrE clusters at E3.5, which we propose represent nascent (light blue) and more advanced (dark blue) populations during lineage maturation22 (Extended Data Fig. 4d). At E4.5 we observed distinct EPI and PrE populations. Two clusters were identified within the E4.5 PrE (light and dark blue, black arrowhead), which likely represent emergent visceral (VE, orange arrowhead) and parietal (ParE, black arrowhead) endoderm (Extended Data Fig. 4d, i, Supplementary Table 2).
ICM cell fate specification is driven in part by the lineage-specific transcription factors (TFs) Gata6 and Nanog, which are co-expressed in uncommitted ICM, and exclusively expressed in, and required for, PrE and EPI respectively23,24. While active across the ICM population25–27, FGF4 signaling is critical for PrE specification28,29. The dynamics of key TFs and signaling pathway components within the ICM remain unclear. We used Palantir to characterize expression trends for Gata6, Nanog and Fgf4 along pseudo-time, as PrE and EPI emerged (Extended Data Fig. 5a). The Gata6/Nanog ratio closely tracked with EPI specification and a strong descriptor of ICM fate specification (Extended Data Fig. 5b). Gata6/Fgf4 also tracked with EPI specification, but trailed Gata6/Nanog. These analyses provide precise ordering of markers during ICM lineage specification (Extended Data Fig. 5c)3,22,28. Additional genes correlated along pseudo-time with Fgf4 in EPI (e.g. Tcf7l1, Extended Data Fig. 5d, b, e–f, green arrowhead), and Gata6 and Gata4 in PrE (Extended Data Fig. 5b, Supplementary Fig. 3).
Mouse mutants in both Fgfr1 and Fgfr2 phenocopy embryos lacking Fgf4, with defects in PrE specification and exit from naïve pluripotency in the EPI26,27,29. Palantir suggested Fgfr1 was expressed in uncommitted ICM cells (Extended Data Fig. 5a, c–d), and downregulated upon PrE specification, at the time of transient Fgfr2 activation. This tandem receptor expression suggests sequential Fgfr1/Fgfr2 activity during PrE specification (Extended Data Fig. 5c, second panel). By E4.5, when Fgfr1 and Fgfr2 are no longer expressed, a second phase of FGF signaling in PrE could be mediated by Fgf5/Fgf8-Fgfr4 in emergent VE and Fgf3-Fgfr3 in ParE (Extended Data Fig. 5d, orange and black arrowheads). While in EPI, Fgf4-Fgfr1 may be driving pluripotent state transitions (Extended Data Fig. 5a, c–d, green arrowheads).
Differentiation of epiblast to endoderm
While EPI and PrE were distinct at E4.5, by E5.5, we observed a continuum of cells exhibiting a gradual increase in expression of endodermal marker genes bridging EPI to VE (Fig. 2a, Extended Data Fig. 6a (black arrowhead) and 6c–d). By contrast, no connection was observed between EPI or VE and extra-embryonic ectoderm (ExE, a TE descendant). ExE cells were phenotypically more distinct from EPI and VE at E5.5, based on average pairwise distances (Extended Data Fig. 6a–d). Investigation of gene trends within the EPI and VE (Supplementary Fig. 4) identified genes correlating with endoderm factors such as Foxa2, Gata4, Gata6, Sox7 and Sox17, and pluripotency-associated factors such Nanog, Pou3f1 and Klf4 (Supplementary Table 3).
Figure 2: Differentiation of epiblast into endoderm before gastrulation.

Results from Harmony applied to all replicates of E3.5-E5.5. a, Force directed layouts depicting relationship between EPI and PrE/VE lineages. Cells colored by time-point (left) and cell type labels (right). b, Palantir pseudo-time, differentiation potential (DP) and branch probabilities (BP) of EPI and PrE/VE cell lineages. Black arrowhead and dotted arrows denote EPI cells with high DP, representing a trans-differentiation to endoderm. c, Gene expression of AVE (Hhex, Lefty1), VE (Foxa2, Afp), VE and EPI (Otx2, Sox2) markers. Cells colored based on post-MAGIC50 gene expression. d–e, 3D surface renderings of mGFP-expressing cells in E6.0 Sox2-CreTG/+;ROSA26mT/mG (d) and Ttr-CreTG/+;ROSA26mT/mG embryos (e). Nuclei stained with Hoechst, membranes labeled with RFP. Results validated in >3 independent experiments. ExE, extra-embryonic ectoderm. Scale bars: 10μm A, anterior; D, distal; P, posterior; Pr, proximal.
To define the cross-over between EPI and VE, we applied Palantir to Harmony augmented E3.5-E5.5 data after excluding TE/ExE cells (Fig. 2b), using the same starting Nanoghi cell as in Extended Data Fig. 4. Palantir ordered cells along their developmental trajectories with high DP at E3.5, corresponding to EPI-vs.-PrE lineage divergence (Fig. 2b). An increase in DP was also observed in a subset of EPI cells bridging to E5.5 VE (Fig. 2b, black arrowhead). Following the region of high DP, a sharp increase in VE BP was observed, indicating that bridging cells had high propensity towards VE (Fig. 2b, arrows with dotted lines). This suggests that this continuity results from a subset of EPI cells acquiring an endoderm identity. Expression of markers of embryonic (em)VE, and anterior visceral endoderm (AVE), a specialized cellular cohort of emVE exhibiting an intra-epithelial, distal-to-anterior migratory behavior between E5.5 and E6.0, including Lefty1, Cer1 and Hhex30–32, suggested these EPI descendants resembled emVE and AVE (Fig. 2c, Extended Data Fig. 6e)33.
To validate the cross-over between EPI and VE, we used two in vivo lineage-tracing approaches. First, we crossed the EPI-specific Sox2-Cre34 and VE-specific Ttr-Cre35 mouse lines to the ROSA26mTmG36 reporter (Fig. 2d,e, Extended Data Fig 6f,g). Imaging of E5.5-E6.0 Sox2-CreTG/+;ROSA26mTmG/+ embryos revealed the majority of GFP-positive cells within the EPI, with single cells also observed within the emVE (yellow arrowhead, 1–5 cells, 10/20 embryos), but not extra-embryonic (ex)VE. Trans-migrating cells were Gata6-positive, indicating they had acquired an endoderm identity. At E5.5, GFP-positive Gata6-positive cells were observed in distal locations, whereas by E6.0, they predominantly resided more anteriorly (Extended Data Fig. 6f). By contrast, all GFP-positive cells were restricted to the VE in Ttr-CreTG/+;ROSA26mTmG embryos, with no cells detected in the EPI (0/27 embryos, Fig. 2e, Extended Data Fig. 6f). We also generated tetraploid embryo <-> CAG-H2B-tdTomato embryonic stem cell (ESC) chimeras, observed tdTomato-positive cells distributed throughout the EPI, and also sparsely within the emVE (1–5 cells, 9/19 embryos, Extended Data Fig. 6g).
Embryonic and extraembryonic visceral endoderm
The early post-implantation (E5.5, Fig. 1) mouse embryo is radially symmetrical, and the VE appears morphologically uniform around its proximal-distal axis4,33. Symmetry is broken, and the AP axis established through the migration of AVE37. Proximal-distal spatial patterning across the VE has been described preceding, and coincident to the onset of gastrulation at E6.5, with a clear distinction between the morphology and function of the proximally located exVE (cuboidal epithelium, overlying the ExE, giving rise to yolk sac endoderm, YsE) and distal emVE (squamous epithelium, overlying the epiblast, contributing to the gut tube7). To determine the onset of transcriptomic determinants of spatial patterning within the VE, we sought to establish when cells specified as YsE-vs.-gut tube are identified. We used Harmony to integrate cells of the E3.5-E8.75 VE lineage (Fig. 3a), and applied Palantir using a Nanoghi ICM cell to define the start (Fig. 3b, Extended Data Fig. 7a,b).
Figure 3: Spatial pattern emerges within visceral endoderm at onset of post-implantation development (E5.5).

Results from Harmony applied to replicates of E3.5-E8.75 (excluding ParE). a, Force directed layout of endoderm cells from blastocyst-to-midgestation. b, Palantir pseudo-time, DP and BP of endoderm cells using a Nanoghi start cell. c, Heatmap of genes expressed (Extended Fig. 9h) in exVE or emVE at E5.5. Cells sorted within each compartment by pseudo-time ordering.
A clear distinction was evident between cells specifying towards YsE-vs.-gut tube at E6.5 and E7.5 (Supplementary Fig. 5a). Based on the expression of marker genes in scRNA-seq data, and correlation to bulk RNA-seq gene expression of sorted E7.5 exVE and emVE tissues, cells specifying towards YsE and gut tube were exVE and emVE, respectively, consistent with reported spatial patterning at these stages (Extended Data Fig. 7c–e). Interestingly, VE cells at E5.5 were distributed across pseudo-time (Extended Data Fig. 7a): a subset did not exhibit any change in DP indicating a more uncommitted state (Extended Data Figs. 7e–f), while the majority exhibited altered DP indicating propensity towards YsE-vs.-gut tube (Extended Data Figs. 7e–f). Taken together, these data reveal that at the transcriptional level, spatial patterning exists at E5.5, preceding morphological changes within the VE.
Differential expression between bulk RNA sequenced E7.5 exVE and emVE populations suggested that emVE represents a specialized variant of exVE (Extended Data Fig. 7d), perhaps modulating a transcriptional program in response to stimuli, such as BMP or Nodal38–40. To explore this further, we identified two covarying gene sets (Supplementary Fig. 5b) exhibiting contrasting expression patterns in putative E5.5 exVE and emVE cells (Fig. 3c), and also distinguished bona fide exVE and emVE cells at E6.5 and E7.5 (Extended Data Fig. 7g). emVE-specific genes (Fig. 3c, Cluster 1) included Lhx1 and Lefty1, and AVE-specific genes Cer1 and Hhex30,32,37. ExVE-specific genes (Fig. 3c, Cluster 2) included Apln and Msx1 (Supplementary Table 4). Wholemount in situ hybridization (ISH) for Apln, Lhx1, Lefty1 and Msx1 at E6.25 validated regionalized expression (Extended Data Fig. 7h). These data demonstrate that the VE is patterned at the onset of post-implantation development, and that the emVE, including the AVE subpopulation, are derivative of exVE.
Anterior-Posterior patterning of gut endoderm
We combined data from anterior and posterior E8.75 gut tube compartments with (Afp)GFP-positive and (Afp-)GFP-negative populations (Fig. 4a) using a manifold classifier (Supplementary Note 3) to infer GFP status of anterior/posterior cells, and AP position of GFP-positive/-negative cells (Extended Data Fig. 8a–b). The strongest signal in the data, as determined by the first diffusion component, was cell ordering along the AP axis (Extended Data Fig. 8c). To corroborate AP ordering reflecting spatial distribution along the gut tube, we confirmed consistency between gene expression trends from scRNA-seq data with bulk RNA-seq data of micro-dissected gut tube quadrants, such that Nkx2–1 an anterior gene, and Hoxb9, a posterior gene, exhibited consistent expression patterns (Extended Data Fig. 8c). To determine a more robust ordering, we inferred pseudo-spatial ordering of cells along the gut tube by computing multi-scale distances from the anterior-most cell after projecting cells onto multiple diffusion components (Fig. 4b, Extended Data Fig. 8d, Supplementary Note 4). The inferred pseudo-space was robust to different parameters and reproducible across replicates (Extended Data Fig. 8e–g).
Figure 4: Anterior-Posterior pseudo-spatial axis of cells residing within the E8.75 gut tube.

Force directed layout of E8.75 VE/DE cells combining anterior/posterior cells with Afp-GFP-positive/AFP-GFP-negative cells using mNNCorrect27 (panels a-c, e). a, Cells colored based on measured or inferred AP position. b, Inferred anterior-posterior (AP) pseudo-space (left) and proportion of VE/DE cells in bins along AP pseudo-space (right). Purple dots represent correlation of aggregate expression VE/DE cells in corresponding bins. c, Expression of key organ markers in DE (top) and VE cells (bottom). d, Receiver operating curve for classification of E8.75 VE/DE cells using model trained on E7.5 cells. e, Expression of classifier genes best predictive VE. f, 3D rendering of gut tube depicting all endoderm cells along AP axis. Nuclei of VE/DE cells labeled in green/grey, respectively.
Gut endoderm comprises EPI-derived DE and VE descendants6,7. Consistent with previous findings, there was extensive intermixing of these descendants along the AP pseudo-space axis with enrichment of DE descendants in the anterior, and VE descendants in the posterior (Fig. 4b). To determine whether VE descendants attained transcriptional equivalence with DE descendants, we compared the expression of markers of the emergent endodermal organs within both populations: Nkx2–1 (thyroid/thymus)41, Irx1 (lung)42, Ppy (liver)43, Pdx1 (pancreas)44, Fabp1 (small intestine)45 and Hoxb9 (posterior). All genes were expressed at substantial levels in both VE and DE cells, and at comparable AP positions, except for Nkx2–1, which is expressed in the anterior-most cells of the gut tube and therefore exclusive to DE (Fig. 4c). Furthermore, we noted a strong correlation in global gene expression patterns between VE and DE cells in binned locations along AP pseudo-space (Fig. 4b, purple), suggesting they were similarly patterned and acquiring regionalized organ-specific identities.
A memory of extra-embryonic lineage history
Despite this global similarity in transcriptomes, VE and DE descendants might retain a memory of their lineage history. To overcome the confounding effects introduced by the spatial distribution of VE and DE descendants along the gut tube, we trained a sparse logistic regression model to classify E7.5 VE and DE cells using all genes as features (Supplementary Note 5). This classifier achieved near-perfect accuracy on E7.5 test data (auROC:0.96) (Extended Data Fig. 8h). We applied this classifier (trained on E7.5) to predict the origin of cells within the E8.75 gut tube, achieving a similarly high accuracy (Fig. 4d, auROC: 0.92). Thus, demonstrating that despite extensive morphological and transcriptional changes taking place at E7.5-E8.75, VE lineage history is maintained through expression of a core set of genes, including Rhox5, Trap1a, Xlr3a, Cdkn2a and Ttr (Fig. 4e, Extended Data Fig. 8i–j, Supplementary Table 5).
Emergence of organ identities
To determine whether emergence of spatial patterning along the AP axis could be observed earlier, we applied Palantir separately to DE and VE cells. Our results revealed the presence of a small fraction of cells acquiring AP identities in both DE and VE compartments at E7.5 (Extended Data Fig. 8k). Notably, DE and VE cells were predominantly primed towards anterior and posterior localization, respectively (Extended Data Fig. 8k, black arrowheads). We next compared the distribution of VE cells along the AP axis of embryos, with VE proportions inferred from the scRNA-seq data along the pseudo-space axis. To quantify the distribution of VE/DE cells within E8.75 (13ss) embryo gut tubes at cellular resolution, we analyzed serial transverse sections of three Afp-GFPTG/+ embryos (Fig. 4f, Extended Data Fig. 8l). VE descendant proportions in binned locations along the AP axis and AP pseudo-space axis were highly correlated (Extended Data Fig. 8m), further demonstrating the accuracy of inferred AP pseudo-space.
To investigate whether the E8.75 gut tube already contains information relating to later organ establishment, we clustered all cells, annotated clusters based on differential expression of primordial organ markers and determined an ordering of clusters along AP pseudo-space. The resulting ordering of clusters matched the sequence of organ identities along the AP axis of the gut tube (Fig. 5a). We observed a high degree of variability in the density of cells along the pseudo-spatial axis (Fig. 5b–c, Extended Data Fig. 9a–b), with low density regions between clusters. Cluster-specific expression was validated using ISH, confirming the accuracy of inferred AP pseudo-space, and the emergence of endodermal organ identities at E8.75 (Extended Data Fig. 9a).
Figure 5: Spatial patterning and organ identities within the E8.75 gut tube of the mouse embryo.

a, Force directed graph of E8.75 cells colored by Phenograph clusters, annotated with putative endodermal organ associated with each cluster. b, Density of cells, per Phenograph cluster along AP pseudo-space. c, Percentage VE cells per cluster, ordered by average distance from anterior tip of AP pseudo-space. d, Heatmap of Hox gene expression along AP pseudo-space (left). Validation of Hox gene expression by ISH on E8.75 gut tubes (n >3 for each gene) (right). e, Heatmap of TF expression most predictive of AP pseudo-space in a regression model. Columns represent cells ordered by pseudo-space, each row representing expression of a particular TF. TFs ordered by expression along AP pseudo-space. Validation of predictive AP expression by ISH on E8.75 gut tubes (n >3 for each gene) (right). Scale bars: 200μm, except for Nkx2–1, Irx3: 100μm. A, anterior; cm, cardiac mesoderm; fg, foregut; hg, hindgut; L, left; mg, midgut; R, right; P, posterior. Scale bars: 200μm, except for Hoxc10: 100μm.
Hox gene expression in the developing central nervous system is considered a canonical descriptor of AP axis position46. While not all Hox genes were expressed within the E8.75 gut tube, of those that were, the majority were posteriorly localized (Fig. 5d and Extended Data Fig. 10), including several displaying robust, more anterior expression within mesoderm and/or neurectoderm (Extended Data Fig. 10: Hoxb1, Hoxd4). These data suggest that gut tube AP patterning and the stereotypical emergence of organ identities, precede or are independent of a Hox code.
To generate a signaling map of the gut tube (Extended Data Fig. 11), we analyzed the expression of context-independent targets for the activity of key signaling pathways. Our data validate FGF and WNT, and reveal NOTCH signaling at the posterior (small/large intestine clusters, Fig. 5). BMP, HH, JAK/STAT and HIPPO pathway activation encompassed multiple domains, Nodal signaling was not active at this stage, while both positive and negative read-outs of Retinoic Acid signaling were posteriorly localized.
To examine the contribution of cell-autonomous cues impacting AP pattern within the gut tube, we trained a sparse regression model to predict AP pseudo-space using the expression of all TFs as features (Supplementary Note 6). TF expression was exceptionally accurate in predicting AP pseudo-space order (Extended Data Fig. 9c, Correlation: 0.97), indicating that transcriptional regulation, presumably in response to signals from neighboring mesenchyme1, plays a key role in gut tube patterning. This model identified a core group of 20 TFs predicting AP pseudo-space ordering (Fig. 5e and Extended Data Fig. 9d–f). Expression domains for the core factors were validated by ISH; from Nkx2–1 at the anterior, to Hoxb9 and Hoxc9 at the posterior (Fig. 5e).
DISCUSSION
We have delineated the transcriptional landscape of mouse endoderm from preimplantation to midgestation. The data pinpoint the order and timing of key events starting with the emergence of the first (primitive) endodermal population within the blastocyst. The data also define previously unappreciated sub-states within well-studied cell populations and uncovered detailed gene expression trends.
The analysis reveals that throughout embryogenesis cells acquire a transcriptional identity reflecting their future fate and spatial positioning prior to overt spatial organization. For example, there is transcriptional priming of spatial patterning of cells along the AP axis at E7.5. While cells develop a marked propensity towards specific cell fates earlier than previously appreciated, they nevertheless retain a remarkable degree of plasticity. Application of Palantir to our data suggested an unprecedented plasticity within the EPI lineage, validated through lineage-tracing experiments, whereby EPI differentiates into endoderm before the onset of gastrulation. One might speculate whether this EPI-to-endoderm differentiation reflects a removal of ‘less-fit’ cells from the pluripotent compartment or an active recruitment of cells to the VE. In the context of cell competition-based models for the EPI, cell engulfment or apical cell extrusion have been proposed as mechanisms for cell removal47. In considering an active recruitment of EPI cells to VE, it has previously been suggested that breaks in the basement membrane at the EPI-VE interface, might allow cells to escape the EPI layer, and populate the nascent AVE48.
At gastrulation (E7.0-E7.5), EPI-derived (embryonic) DE cells intercalate into the emVE epithelium to form the gut endoderm5,7. While we show that VE and DE descendants retain a signature of their lineage history, the data suggest they largely acquire transcriptomic equivalence. By the time the gut endoderm has internalized forming the gut tube (E8.75), clusters of cells expressing markers of organ identity could be identified, correlating in AP pseudo-space with the stereotypical order of endodermal organs. These were largely determined by spatial localization, rather than lineage history.
Cell fate is determined through a combination of cell intrinsic propensities to specific fates and extrinsic cues (e.g. signaling) from the environment, detailed knowledge of which should yield improved protocols for differentiation into distinct endodermal derivatives49. A future challenge will be to dissect the dynamic interplay between different inputs in determining the coordination of fate decisions underlying the emergence of distinct organ identities of defined size at stereotypical locations along the gut tube, and to investigate the persistence and function of VE descendants within endodermal organs.
Methods
Data reporting
The investigators were not blinded to allocation during experiments and outcome assessment.
Ethical compliance
Mice were maintained in accordance with guidelines from Memorial Sloan Kettering Cancer Center (MSKCC) Institutional Animal Care and Use Committee (IACUC) under protocol no. 03-12-017 (PI: Hadjantonakis).
Mouse husbandry
Mouse strains used: wild-type CD-1 (Charles River), B6D2F1 (Jackson Laboratory), Afp-GFPTG/+12, Sox2-CreTG/+ (Edil3Tg(Sox2-cre)1Amc/J)34, Ttr-CreTG/+35 and R26mT/mG (Gt(ROSA)26Sortm4(ACTB-tdTomato,-EGFP)Luo/J)36.
Embryo collection
Mice were housed under a 12-hour light/dark cycle. Natural matings were set-up between males and 4–6 week-old virgin females, with noon of the day of vaginal plug considered embryonic day (E) 0.5. Pre-implantation embryos were flushed from uterine horns at E3.5 and E4.5 with flushing and holding medium (FHM, Millipore) as previously described51. Zona pellucidae were removed from E3.5 blastocysts by incubation in acidic Tyrode’s solution (Millipore) at 37°C for 2–3 min. Embryos were subsequently washed through 2–3 drops of FHM and kept in drops of FHM covered with mineral oil (Sigma) on ice prior to cell dissociation. Post-implantation embryos were dissected in DMEM/F12, 5% Newborn Calf Serum (Life Technologies) and staged according to Downs and Davies52 or by somite number.
Tetraploid embryo chimeras
Tetraploid embryo chimeras were generated at the NYU Rodent Genetic Engineering Core Facility. Three to four-week-old female B6D2F1 mice (Jackson Laboratories) were super-ovulated with 5IU PMSG and 5IU hCG at 48hr intervals, then mated individually to B6D2F1 males. Zygotes were collected at E0.5. After overnight culture in KSOM/AA (Millipore) at 37°C in an atmosphere of 5% CO2, 2-cell stage embryos were washed in 0.3M d-Mannitol plus 0.3% BSA (Sigma) and transferred to a Fusion Electrode slide (GSS-250 - BLS, Hungary), and pulses of 30V for 30 μseconds were applied. Embryos were monitored for fusion every 30 min. Embryos in which fusion had occurred were cultured for 48hr until they developed into blastocysts. H2B-tdTomato expressing ES cells53 were injected into tetraploid blastocysts, and injected blastocysts cultured to allow for recovery of morphology, before transfer into uteri (up to ten embryos per horn) of E2.5 pseudo-pregnant females (CD-1, Charles River) using standard protocols51. Chimeric embryos were recovered at E5.5-E6.0 (Extended Data Figure 6f).
Dissociation of embryos and collection of single cells
13ss (E8.75), approximately corresponding to midgestation, the latest stage analyzed in this study, is the latest stage for unambiguous assignment of visceral endoderm (VE)-vs.-definitive endoderm (DE) origin of gut tube cells using Afp-GFP7,12 or Ttr-Cre7,35 mouse lines. To obtain single cells from 13ss gut tubes, Afp-GFPTG/+ embryos were dissected, with extra-embryonic membranes and heads removed. Torsos were washed in three drops of DMEM/F12 on ice and incubated in Pancreatin/Trypsin (2.5% Pancreatin / 0.5% Trypsin in PBS) for 5 min (exact time was batch-dependent and empirically-tested) on ice, then washed in three drops of DMEM/F12, 10% Newborn Calf Serum on ice. Gut tubes were isolated using Tungsten needles (FST Cat No. 10130–10) and washed in ice-cold DMEM/F12. Gut tubes were incubated for 20 min at 37°C in Accutase/0.25% Trypsin (1:2) for dissociation into single cells. To obtain single cells from E7.5 DE and VE, and E6.5 VE, embryos were washed in three drops of DMEM/F12 on ice and incubated in Pancreatin/Trypsin (2.5% Pancreatin / 0.25% Trypsin in PBS) for 3 min (E7.5) and 45s (E6.5) on ice and then washed in three drops of DMEM/F12, 10% Newborn Calf Serum on ice. The endoderm layer was teased apart using Tungsten needles and washed in cold DMEM/F12, then incubated for 20 min at 37°C in Accutase/0.25% Trypsin (1:2). For E5.5 (defined as the stage when the DVE/AVE is distally positioned, observed as thickening within emVE epithelium), whole embryos were collected, and Reichert’s membrane removed using Tungsten needles. Embryos were washed in cold DMEM/F12 then incubated in 0.25% Trypsin for 5 min at 37°C. To dissociate tissue into a single cell suspension, a 1:1 ratio of DMEM/F12, 20% Newborn calf serum, 4mM EDTA was added. Cell clumps were triturated into single cells by mouth-pipetting using pulled (Sutter Instruments) 75mm glass capillaries. Single-cell suspensions were filtered through FlowMI cell strainers (40μm, Sigma-Aldrich) to remove debris. Single cells were spun at 450g for 4 min at room temperature, and cell numbers determined using a Neubauer hemocytometer. For pre-implantation embryo dissociations, embryos were incubated in 0.5% Trypsin-EDTA (Invitrogen) at 37°C for 3 minutes before transferring to PBS supplemented with 0.5mM EDTA (Invitrogen) and 4% BSA (Sigma) for mechanical dissociations. Trypsin-treated embryos were dissociated by trituration with pulled capillaries and mouth-pipetting. Dissociated cells were stored in FHM on ice until loading on a Chromium Controller (10x Genomics).
Single cell library preparation
Cells were counted and diluted to a final concentration in DMEM/F12, 10% Fetal Bovine Serum in Single Cell Master Mix (10x Genomics). Cellular suspensions were loaded on a Chromium Controller54 targeting a 2,500–10,000 cell range, depending on tissue type and embryo stage, to generate single cell 3’ RNA-seq libraries, in duplicate or triplicate. Single-cell 3’ RNA-seq libraries were generated following manufacturer’s instructions (10x Genomics Chromium Single Cell 3’ Reagent Kit User Guide v2 Chemistry).
Next generation sequencing of single-cell libraries
Single-cell 3’ RNA-seq libraries were quantified on an Agilent Bioanalyzer with high sensitivity chip (Agilent), and Kapa DNA quantification kit for Illumina platforms (Roche). Libraries were pooled according to target cell number loaded. To determine the exact number of cells in each library, libraries were sequenced at low depth (2,000 reads per cell) and short reads (40 bp). Sequencing libraries were loaded at 12 pM on an Illumina HiSeq 2500 with 1x Rapid SBS kit v2 (50 cycles) using the following read length: 26 bp Read1, 8 bp I7 Index and 40 bp Read2. After sequencing, the number of cells in each single cell 3’ library was calculated using the Cell Ranger analysis pipeline V2.1 (10x Genomics). Library pools were re-made according to the actual number of cells determined in each library for sequencing at a depth of ~200,000 reads per cell and the capacity of an Illumina NovaSeq flow cell. New pools were loaded on an Illumina NovaSeq 6000 using 2x NovaSeq 6000 S2 reagent kits (200 cycles) and 1x NovaSeq 6000 S4 reagent kits (300 cycles) using the following read length: 26 bp Read1, 8 bp I7 Index and 98 bp Read2.
In situ hybridization (ISH) and immunofluorescence on embryos
For mRNA in situ hybridization post-implantation embryos were fixed in 4% PFA in PBS at 4°C overnight, then dehydrated through a Methanol series and stored at −20°C. In situ hybridization was performed as previously described51 using antisense riboprobes. Probes used are listed in Supp. Tables 7 and 8.
Immunofluorescence of pre-implantation embryos was performed as previously described20,55. Fixed embryos were washed for 5 min in 0.1% Triton X-100 (Sigma) in PBS (PBX), permeabilized in 0.5% Triton X-100 and 100mM Glycine (Sigma) in PBS for 5 min, washed again in PBX for 5 min and blocked in 2% Horse Serum (Sigma) in PBS (blocking solution) for 1h at room temperature prior to antibody incubation. Embryos were incubated in primary antibodies diluted in blocking solution overnight at 4°C. Embryos were then washed three times for 5 min each in PBX and blocked again for 1h at room temperature prior to incubation with secondary antibodies. Secondary antibodies diluted in blocking solution were applied for 1h 30 min at 4°C. Embryos were then washed twice for 5 min each in PBX and subsequently incubated with 5μg/ml Hoechst 33342 (Invitrogen) in PBS to stain nuclei for 5 min or until mounting for imaging.
For immunofluorescence, post-implantation embryos were fixed for 10 min in 4% PFA at room temperature, washed three times in 0.1% Triton-100 in PBS, permeabilized in 0.5% Triton-100 in PBS for 20 min and then washed three times in 0.1% Triton-100 in PBS. Embryos were incubated in blocking buffer containing 2% Donkey Serum (Jackson Labs) in 0.1% Triton-100 in PBS for 1hr at 4°C followed by the incubation in the primary antibodies diluted in blocking buffer overnight at 4°C. Embryos were washed three times in 0.1% Triton-100 in PBS before incubated in secondary antibody overnight at 4°C and then washed again three times in 0.1% Triton-100 in PBS and counterstained in 5μg/ml Hoechst. Primary and secondary antibodies used, and their dilutions are listed in Supp. Table 9.
Amplification and cloning of antisense riboprobes
Total RNA was isolated from whole 13ss stage wild-type embryos using Trizol (Invitrogen). 500μl Trizol was added and the sample vortexed. 100μl Chloroform was added and incubated for 2 min at room temperature. Samples were then centrifuged at 12,000g for 15 min at 4°C. The aqueous phase was removed, 1x volume of Isopropanol and 1 μl GlycoBlue™ Coprecipitant (15mg/ml, Invitrogen) were added to precipitate RNA and visualize the pellet. Samples were incubated at room temperature for 20 min, then centrifuged for 10 min at 12.000g at 4°C. Samples were placed on ice and washed with 500μl 75% Ethanol and air-dried 5 min on ice. RNA pellets were resuspended in UltraPure™ DNAse/RNAse-free water (Invitrogen). TurboDNAse™ 2U/μl was used to eliminate DNA, with samples incubated 30 min at 37°C. RNA was Phenol/Chloroform extracted and precipitated by adding 1/10 volume 3M Sodium Acetate 2.5x volumes Ethanol at −80°C for 1 hr. Pellets were washed with 75% cold Ethanol and air-dried 5 min on ice and resuspended in UltraPure™ DNAse/RNAse-free water (Invitrogen). Concentrations were determined using a NanoDrop.
cDNA fragments for riboprobes were generated using the SuperScript™ IV One-Step RT-PCR System (Invitrogen) and gene-specific primers (Supp. Table 8). cDNA fragments were amplified from embryo RNA and cloned into pCR®-Blunt II TOPO® using the ZeroBlunt® TOPO® PCR Cloning Kit (Invitrogen). Rhox5 and Rhox6 riboprobes were amplified using gene-specific primers (Supp. Table 8) from Rhox5 and Rhox6 expression vectors, respectively, and cloned into the dual promoter pCR® II TOPO® vector using the TOPO TA Cloning® Kit (Invitrogen). All subcloned ISH probes were validated by sequencing.
Image data acquisition
Wide-field images of ISH of embryos and gut tubes were acquired on a Zeiss AxioZoom stereo-microscope with a Zeiss Axiocam MRc CCD camera and ZEN 2.3 software using the Manual Extended Depth of Focus application which combines sharp regions from several focal planes producing one resulting image. Laser scanning confocal images of pre- and post-implantation embryos were acquired on a Zeiss LSM 880. Fixed E5.5 and E6.0 embryos were imaged in a drop of PBS on a glass-bottom dish (MatTek). Images were acquired using a Plan-Apo 20x/NA0.8 M27 objective. Z-stacks were taken at 0.88μm intervals. Pre-implantation embryos were imaged using an EC Plan-Neofluar 40x/NA1.30 oil immersion objective at 1μm z-intervals. Fluorescence was excited using a 405 nm diode (Hoechst 3342), 488 nm Argon, 561 nm DPSS-561–10 and HeNe 633 nm lasers. Raw data were processed in ZEN (Zeiss - https://www.zeiss.com/microscopy/us/products/microscope-software/zen.html) or Imaris (Bitplane - http://www.bitplane.com/ ) software, and assembled in Adobe Photoshop or Illustrator (Adobe Creative Cloud - https://www.adobe.com/creativecloud.html ).
Image data analysis and processing
3D reconstructions of the distribution of nuclei of definitive (DE) and visceral endoderm (VE) descendants within gut tube was performed using Neurolucida software (https://www.mbfbioscience.com/neurolucida). Serial transverse sections of three 13ss Afp-GFPTG/+ embryos were cut and counterstained with Hoechst 33342 (10mg/ml, Invitrogen) to label nuclei. Sections were imaged on an AxioImager M1 (Zeiss) using a Hamamatsu C10600 Orca-R2l camera. The outline of the gut tube was traced on each section at low-magnification (5x/NA0.16 objective), then nuclei of all cells (GFP-positive and GFP-negative) and VE descendants (GFP-positive) were counted at high-magnification (40x/NA 0.75 objective). Nuclei identified in serial sections were used to reconstruct a 3D image depicting the distribution of DE and VE descendants along entire gut tubes.
FACS
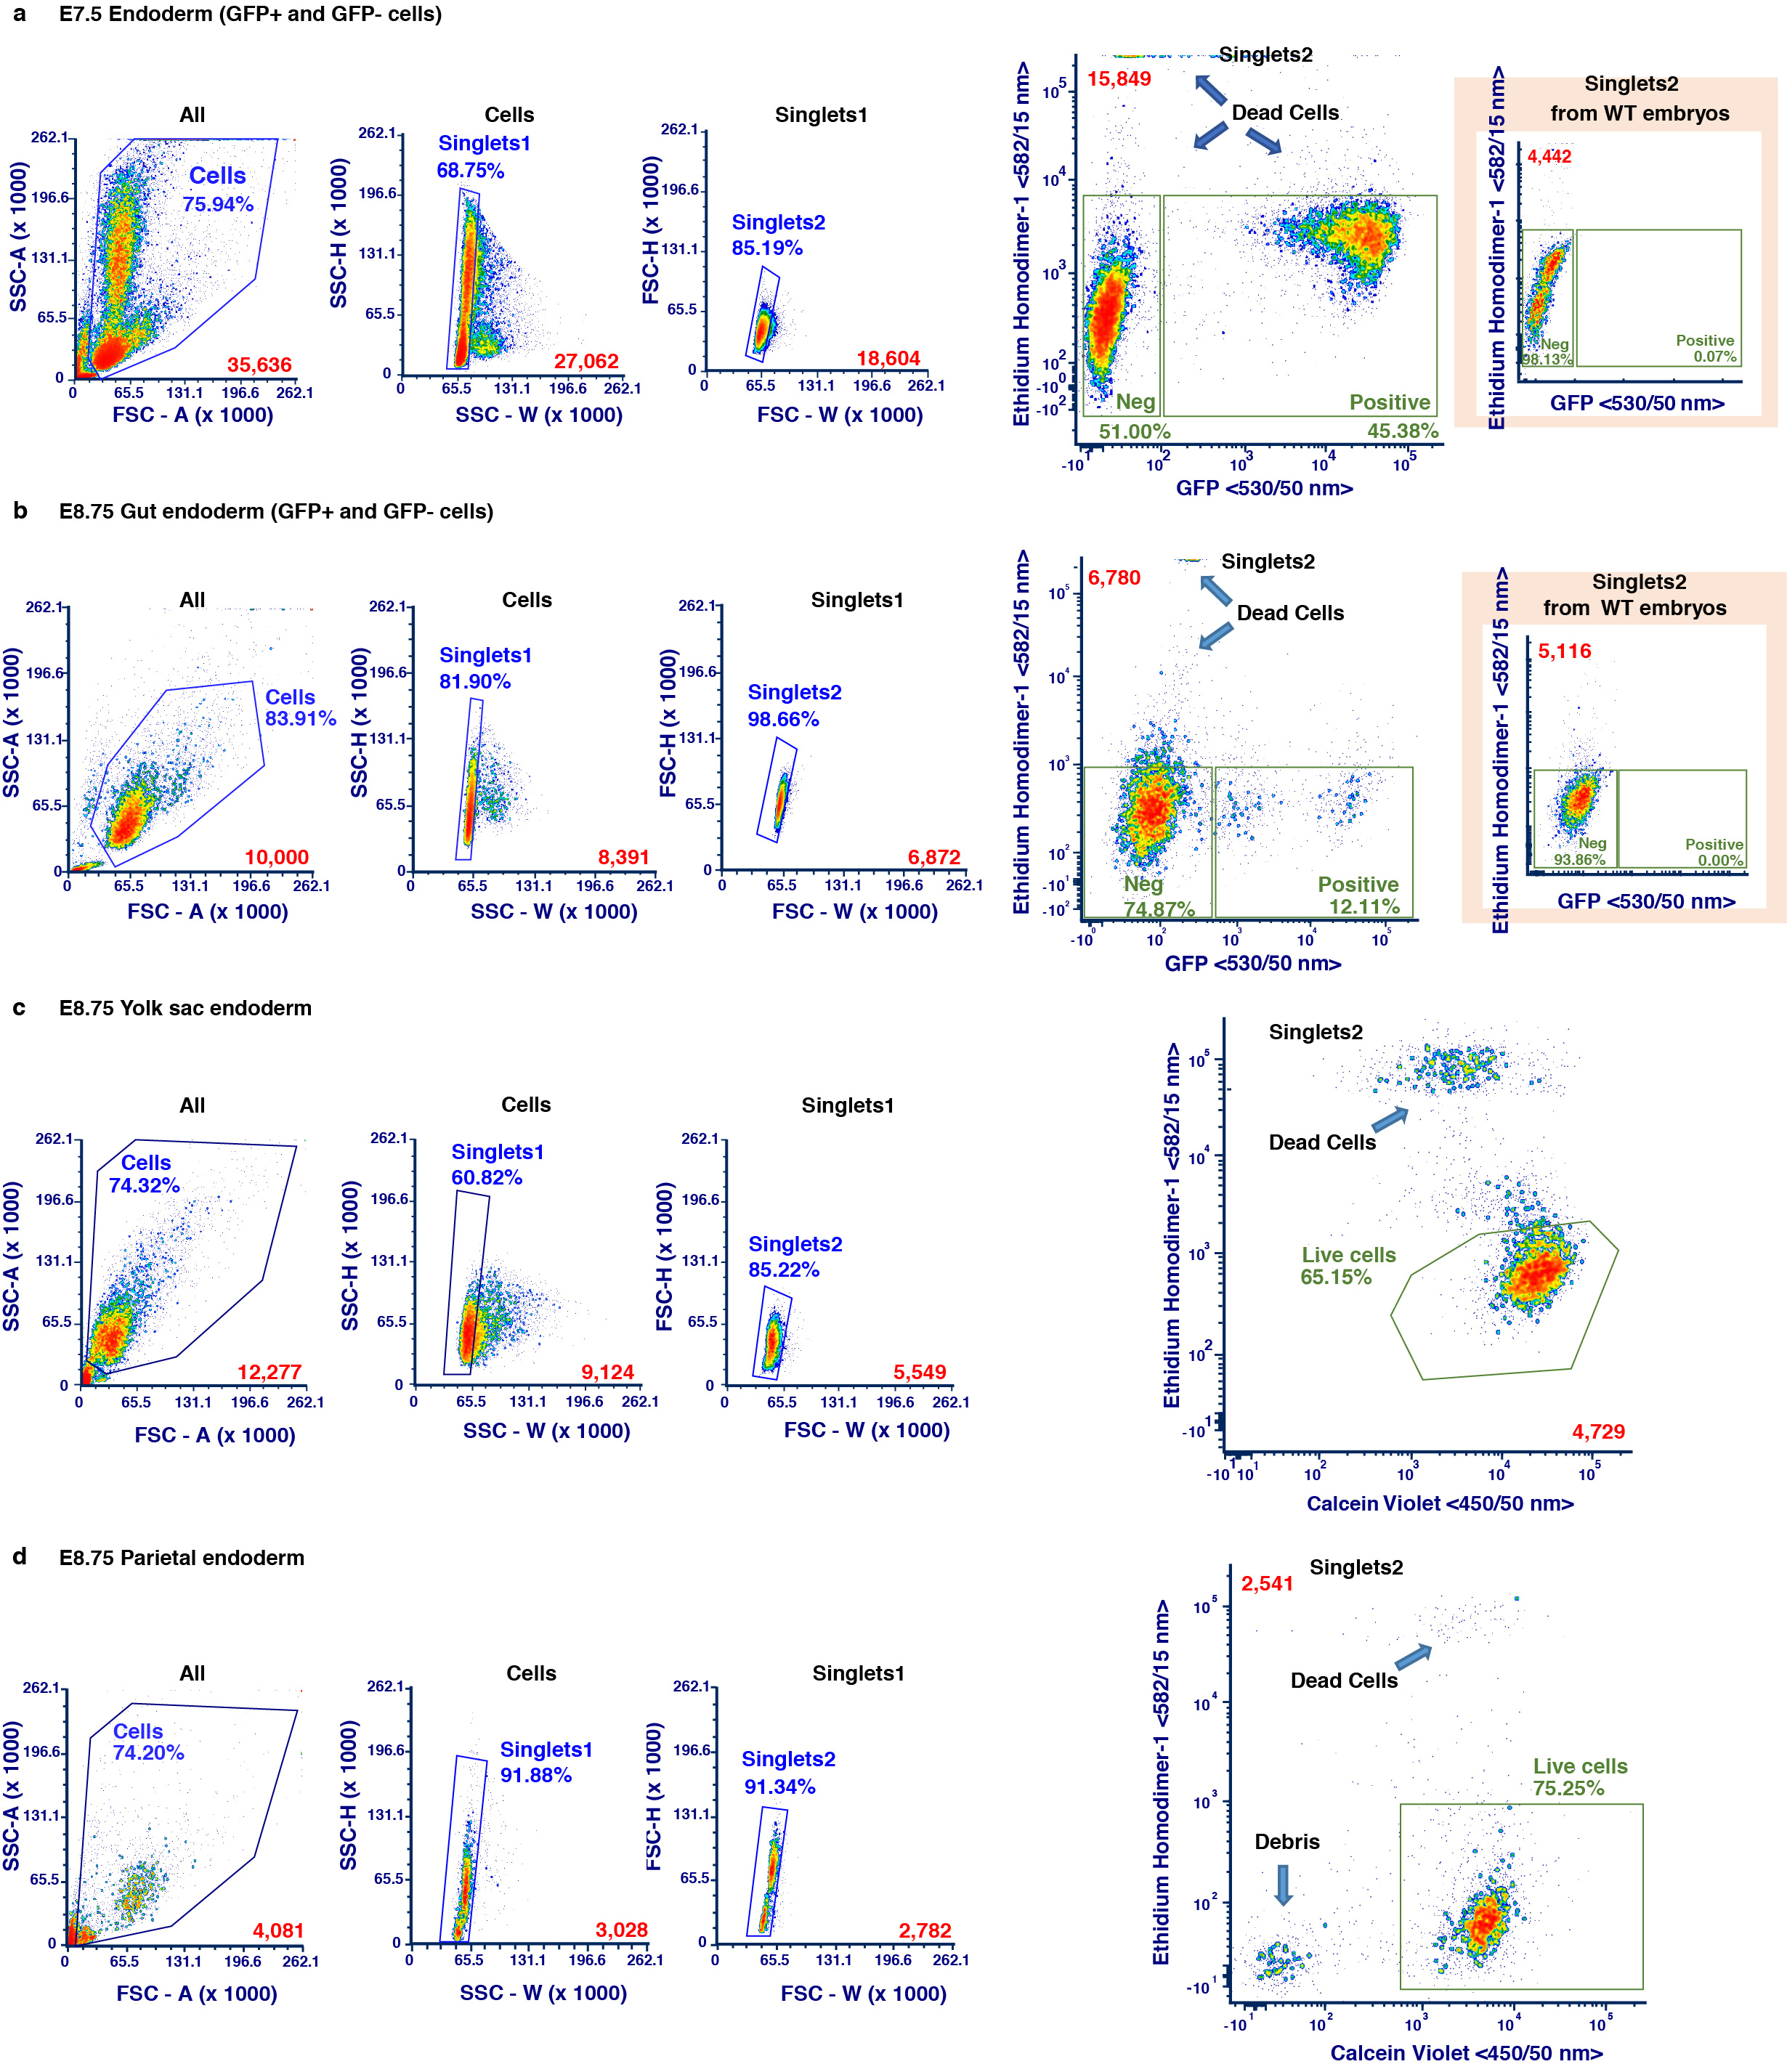
Single cells recovered from E7.5 endoderm (comprising VE and DE), as well as E8.75 gut tube, ParE, and yolk sac (YsE) were resuspended in serum-free DMEM/F12 medium and sorted prior to scRNA-seq using a SORP FACSAria IIu (BD Biosciences), with a 100 μm nozzle at 137.9 kPa (20 psi) in Purity mode. Cell suspensions were sorted based on GFP content, with both GFP-positive and GFP-negative fractions collected, and dead cells excluded using Ethidium Homodimer-1 (Ethd-1, 4 μM, ThermoFisher). Debris was excluded from YsE and ParE cell suspensions by selecting Calcein Violet (0.05 μM, ThermoFisher) and excluding Ethd-1 positive events. GFP, Calcein Violet, Ethd-1, and were excited at 488, 561, and 405 nm respectively, and detected using 530/50, 582/15, and 450/50 nm band-pass filters, respectively. Sorted cells were collected in DMEM/F12, 10% Newborn Calf Serum, resuspended immediately after sorting in collection buffer, and counted before loading on a 10x Chromium Controller. Wherever possible, purity checks were performed indicating >99.9% sample purity. Gating strategies for each tissue collected are provided in Supplementary Figure 1.
Single-cell RNA-seq data processing
RNA isolation and next generation sequencing of bulk tissue
Total RNA was extracted from bulk tissue and pooled dissociated cells of 13ss (~E8.75) gut tubes, from bulk tissue (gut tube quarters) representing anterior, anterior-midgut, midgut-posterior and posterior sections of 13ss gut tubes (Extended Data Figure 1), as well as from extra-embryonic visceral endoderm and embryonic visceral endoderm of E7.5. The Trizol method (Invitrogen) was used for RNA extraction. RNA concentration and quality were assessed, and cDNA libraries construction and sequencing were performed by the Genomics and Epigenomics Core Facility at Weill Medical College, Cornell University, New York. Paired-end sequencing (llumina HiSeq™ 4000, 50bp reads) was performed.
Bulk RNA-seq processing
The bulk RNA-seq expression datasets generated are listed in Supp. Table. 13. All samples were generated in duplicate. Bulk RNA-seq data was aligned to the mm38 mouse genome using STAR56 and reads that mapped to multiple genomic locations were filtered out. Gene expression counts for each sample were determined using the summarizeOverlaps function of the GenomicRanges package using Ensembl annotations57. The annotations and STAR parameters used for single cell RNA-seq data alignment were also used for bulk RNA-seq data to maintain consistency.
Bulk RNA-seq and scRNA-seq data was compared by computing the Pearson correlation between log-transformed bulk counts and aggregated molecule counts across all relevant single cells (Extended Data Fig. 2b). DESeq258 was used to determine the differentially expressed genes between E7.5 exVE and emVE tissues (Extended Data Fig. 7d). DESeq2 was also used to normalize the bulk data for determining spatial patterns of gene expression in the E8.75 gut tube (Extended Data Fig. 8c).
Harmony framework
Manifold classifier
Palantir
Alignment of cells along their developmental trajectories was performed using our recently published trajectory detection algorithm, Palantir10,11. A key distinguishing feature of Palantir is that rather than treating lineage decisions as bifurcations, cell fate choices are modeled as continuous probabilistic processes. Palantir accomplishes this by estimating the probability of a cell in an intermediate state reaching any of the terminal states. The entropy of these branch probabilities has been shown to represent a quantitative measure of the differentiation potential or plasticity of the cell, where multipotent cells have the highest differentiation potential and mature terminal states have the lowest potential. The high resolution achieved by Palantir allows detailed mapping of gene expression trends and dynamics that are correlated with changes in lineage potential10,11. See supplementary note on Palantir for details on interpretation of Palantir results and visualization.
The different parameters used for Palantir are listed in Supp. Table. 14. Harmony was used to compute the augmented affinity matrix by determining mutually nearest neighbours between successive time points. Diffusion components were computed by using the Harmony augmented affinity matrix and used as inputs for Palantir.
k = 30 was used for datasets involving pre-implantation stages since the number of cells are relatively lower in these stages. The number of waypoints was increased for datasets with increasing complexity. The number of diffusion components were chosen based on Eigen gap for each dataset. Palantir results however have been shown to be robust to these parameters10,11,
Gene expression trends were determined as described in Palantir using the branch probabilities and generalized additive models. Similarly, clustering of the trends was performed as described in Palantir using Phenograph14.
Trophectoderm lineage decision (Related to Fig. 2)
Harmony was used to generate an augmented affinity matrix spanning cells of all lineages (ICM, Epi, PrE and TE) across E3.5 and E4.5. The cells were projected onto diffusion components using this affinity matrix with the number of components (2 components) chosen by Eigen gap. Distance between any two cells is measured using the multi-scale distance (See section “Multi-scale distance” for more details).
The average distance between pairs of ICM and TE cells (13.9) at E3.5 and is orders of magnitude greater than distance between pairs of ICM and EPI (0.41) or PrE (2.0) cells (Fig. 2b). This suggests that the lineage decision between ICM at E3.5 and TE occurs at a stage earlier than E3.5.
Relationship between EPI, VE and ExE cells at E5.5
E5.5 EPI, VE and ExE cells were projected onto a low dimensional embedding using diffusion maps. The number of components (10) for the embedding were chosen by Eigen gap among the top diffusion components. Similar to the analysis above, the ExE cells at E5.5 continue to be significantly further from EPI and VE cells (Extended Data Fig. 6a–b).
To test the relationships between the E5.5 cell lineages, we first identified the cells that form the boundaries for the different lineages by identifying the extremes of the diffusion components for each cell lineage (Extended Data Fig. 6c). We then constructed a kNN graph in the embedded space and computed the shortest paths between the EPI boundary to the VE and ExE boundary cells. The path from EPI to ExE boundary cells includes steps that are substantially distant (Extended Data Fig. 6d). In contrast, the path from EPI to VE boundary cells includes relatively uniform step sizes and does not include substantially large steps indicating continuity (Extended Data Fig. 6d).
Identification of E5.5 emVE and exVE cells
The VE trajectories using cells from E3.5 to E8.5 show the following properties: (a) E3.5 and E4.5 cells do not show any change in differentiation potential along pseudo - time (Supplementary Fig. 5a) and thus are representative of uncommitted cells, (b) emVE cells at E6.5 and E7.5 show an increasing probability towards the gut tube and (c) exVE cells at E6.5 and E7.5 show an increasing probability towards the yolk sac endoderm (Supplementary Fig. 5a, Extended Data Fig. 7e). We therefore used the Palantir branch probabilities to identify putative E5.5 uncommitted, emVE and exVE cells that follow these properties: (a) E5.5 cells with the same differentiation potential as E3.5 and E4.5 cells are nominated as uncommitted cells, (b) E5.5 cells with gut tube and yolk sac probabilities greater than E3.5 probabilities (epsilon: 0.01) are nominated as putative emVE and exVE cells respectively (Extended Data Fig. 7e–f).
emVE-exVE gene signature
Covariance matrices were computed separately for the putative E5.5 emVE (449 cells) and exVE cells (618 cells) using the 2500 most variable genes, also used for characterizing VE developmental trajectories with Palantir (Fig. 4a). MAGIC imputed data was used for computing the covariances. Hierarchical clustering was used to identify clusters of covarying genes in each of these compartments. Visual inspection revealed the presence of two clusters of genes in emVE with strong intra cluster correlation, but anti correlated across the clusters (Supplementary Fig. 5b). The genes comprising these clusters were identified by cutting the hierarchical clustering tree to yield three clusters (Supplementary Fig. 5b).
AP pseudo-space ordering
VE-DE classifier
Identification of TFs predictive of AP pseudo-space in the gut tube
Data availability
All the generated data including bulk and scRNA-seq data is available through GEO. Accession numbers: GSE123046 (scRNA-seq) and GSE123124 (bulk RNA-seq).
Software availability
Harmony is available as a python module: https://github.com/dpeerlab/Harmony and Palantir is available as a python module at https://github.com/dpeerlab/Palantir. A Jupyter notebook detailing the usage of Harmony along with sample data is available: http://nbviewer.jupyter.org/github/dpeerlab/Harmony/blob/master/notebooks/Harmony_sample_notebook.ipynb
Extended Data
Extended Data Figure 1: Endoderm cell representation in mouse embryos, from blastocyst through midgestation, and single-cell collection pipeline.

a, Distribution of extra-embryonic endoderm cells (GFP/green) from blastocyst (E3.5) to midgestation (E8.75, 13ss) demarcated using PdgfraH2B-GFP20 (pre-implantation stages) and Afp-GFP12 (post-implantation stages) reporters. Extra-embryonic endoderm (PrE and VE derivatives) cells contribute to the gut tube of the E8.75 embryo. b, Pie charts depicting fraction of endoderm cells per embryo, for all stages analyzed in this study. c, Schematic of protocol used for single cell collection, with E8.75 gut tube provided as an example. Gut tubes were micro-dissected from embryos, then dissociated into single cells. Single cells of either anterior and posterior halves of gut tubes, or AFP-GFP-positive (VE descendants) and AFP-GFP-negative (DE descendants) collected using FACS, were used for single-cell 3’ mRNA library construction on the 10x Genomics Chromium platform. For bulk RNA-seq, whole gut tubes dissociated into single cells and then pooled, whole intact gut tubes, and whole gut tubes dissected into quarters, were collected for sequencing. d, tSNE plots of collected libraries for each time-point with each dot representing a single cell. Phenograph was used to identify clusters of cells, color-coded by cell type with annotation based on expression of known markers.
Extended Data Figure 2: Computational pipeline and comparison of scRNA-seq with bulk RNA-seq data.

a, Flow chart of computational data processing pipeline. b, Plots showing the Pearson correlation between aggregated scRNA-seq data of anterior and posterior halves of the gut tube with bulk RNA-seq of dissociated (and pooled) cells and bulk tissue, respectively. The two rows represent two replicates.
Extended Data Figure 3: MNN augmentation to correct batch effects between time-points and Harmony unified framework for scRNA-seq data analysis.

a, Force directed layouts for cells of the following time-points: E3.5, E4.5, E5.5, E6.5, E7.5 and E8.75 (amalgamation of anterior and posterior gut tube halves). Cells are colored by time-point. The graph was generated using an adjacency matrix derived from the standard kNN graph. Differences between consecutive time-points represent underlying developmental changes but are also confounded by technical batch effects, including discontinuity between E3.5 and E.4.5 and lack of spatial alignment between E6.5 and E7.5. b, E6.5 and E7.5 cells projected along their respective first two diffusion components. These projections reveal a dominant first component with strong spatial signal within individual time-points. Cells are colored by Phenograph clusters. c, The number of edges connecting cells between time-points are limited in the kNN graph (Top panel). Bottom panel: Plots showing the number of mutually nearest neighbors (MNNs) between E6.5 and E7.5 time-points. The MNNs are enriched along the boundary between time-points, supporting augmentation of the kNN graph with additional edges between mutually nearest neighbors (MNNs) between the consecutive time-points. d, The MNN distances can be converted to affinities on a similar scale as the kNN affinities, using linear regression to determine the relationship between the kath kNN and kath MNN distances. e, Example of the augmented MNN affinity matrix construction. Left panel: kNN affinities for a subset of E6.5 and E7.5 cells. Middle panel: MNN affinity matrix constructed using linear regression (d) to convert distances E6.5 and E7.5 cells to affinities. Right panel: Augmented affinity matrix: Sum of the kNN and MNN affinity matrices. f, Comparison of force directed layouts. Left: Standard kNN affinity matrix, Middle: Harmony’s augmented affinity matrix. Right: Plot generated using mnnCorrect27 for global batch effect correction leading to “over-correction” and loss in signal between time-points. g, Harmony framework starts with the augmented affinity matrix generated as described in supplemental methods. The augmented affinity matrix is used to generate the force directed graph for visualizing the data. The same augmented matrix is used to compute the diffusion operator for determining the diffusion components which, (a) forms the basis for Palantir trajectory detection, and (b) MAGIC imputation. h, Robustness of Harmony: Plots showing the correlation between diffusion components for different values of k, the number of nearest neighbours for kNN graph construction. VE cells in Fig.4 were used for testing robustness. i, Harmony applied to replicates: Plots showing the Pearson correlation between diffusion components without Harmony (x-axis) and with Harmony applied between the two replicates of the E8.75 gut tube. Plots shown for 3512 cells.
Extended Data Figure 4: Lineage decisions in the mammalian blastocyst.

Results from pooling cells of two replicates of E3.5 and E4.5 followed by Harmony augmentation. a, Force directed layout of E3.5 and E4.5 cells depicting relationship between three blastocyst lineages. Cells colored by time-point or annotated cell types. b, Plot showing projection of E3.5 and E4.5 cells along first two diffusion components. Distances between lineages were computed using multi-scale distances. c, Table showing the connectivity between different compartments in a kNN graph of E3.5 cells. Each row represents the fraction of outgoing edges from cells of the respective compartment connecting to cells in the compartments specified in the columns. d, Force directed layout of E3.5 and E4.5, following removal of TE cells, showing relationships between ICM, EPI and PrE. Cells are colored by time-point or Phenograph14 clusters. e, Palantir10,11 determined pseudo-time ordering, differentiation potential (DP) and branch probabilities (BP) of PrE and EPI cell lineages. f, Plots showing the second derivative of PrE and EPI differentiation potential along pseudo-time suggesting that changes in differentiation potential, and hence lineage commitment in both lineages occur at E3.5. Points of highest changes along pseudo-time represent inferred lineage specification and commitment. g, Distribution of E3.5 lineage cells along pseudo-time, each distribution represents cells from one Phenograph cluster. h, Histograms showing the distribution of differentiation potential (left), PrE fate probability (middle) and EPI fate probability (right) in the E3.5 ICM clusters. i, Gene expression patterns of parietal (ParE) and visceral endoderm (VE) markers. Each cell is colored based on its MAGIC15,50 imputed expression level for the indicated gene. Black and orange arrowheads mark presumptive ParE and VE lineages, respectively.
Extended Data Figure 5: Gene expression trends in EPI, PrE, VE and ParE lineages in the blastocyst.

a, Plots comparing gene expression trends along pseudo-time for genes encoding components of the FGF signaling pathway (Fgf4, Fgf5, Fgf8, Fgfr1, Fgfr2, Spry4), the endoderm marker transcription factors Gata6, Gata4, Sox7 and Sox17 and Nanog during EPI and PrE lineage specification. Solid line represents the mean expression trend and shaded regions represents 1 s.d. b, Dynamics of TF ratios as lineages emerge: Gata6/Nanog and Gata6/Fgf4 along EPI; Nanog/Gata6 and Fgf4/Gata6 along PrE, compared to changes in differential potential (dotted line). TF ratios were computed for each cell by using the MAGIC50 imputed data for each gene. c, Plots comparing gene expression trends along pseudo-time: Gata and Sox transcription factors, Fgf-receptors or -ligands during PrE or EPI specification. Colors at the bottom of each panel represent time-point, and where applicable, E3.5 and E4.5 Phenograph clusters. Dashed lines represent BP in commitment towards respective lineages. d, Gene expression patterns of FGF signaling pathway components, Gata and Sox transcription factor genes. Orange, black and green arrowheads point to high expression in ParE, VE and EPI, respectively. e, Laser scanning confocal data depicting TCF7L1 expression at E3.5 (top panel) (n = 14) and E4.5 (bottom panel) (n = 11). SOX2 and GATA6 were used as EPI and PrE lineage markers, respectively. f, Gene expression patterns of Tcf7l1 and Nanog depicting similar expression of Tcf7l1 in EPI as Fgf4 (green arrowhead).
Extended Data Figure 6: Force directed layouts of single E5.5 cells reveal relationships between EPI, VE and extra-embryonic ectoderm (ExE) lineages.

a, Force directed layouts of E5.5 data generated after pooling replicates, showing the relationship between EPI, VE and extra-embryonic ectoderm (ExE) lineages. Cells are colored by cell type. Black arrowheads mark cells that transdifferentiate from EPI to VE. b, Plot showing the projection of EPI, VE and ExE cells along the first two diffusion components. Distances between lineages were computed using multi-scale distances. c, Plots showing the shortest path step sizes for paths from EPI boundary cell to VE (top) and EPI to ExE (bottom) boundary cells. d, Left panel: Plots highlighting extremes of the diffusion components, serving as the boundaries of the phenotypic space for each lineage identity. Right panel: Plots showing the shortest path step sizes for paths from EPI-to-VE (top) and EPI-to-ExE (bottom). e, Gene expression plots of AVE (Cer1, Dkk1), VE (Eomes, Foxa1, Ttr), VE and EPI (Nodal) and EPI (Sox2) markers along EPI and PrE/VE lineages from E3.5-E5.5. Cells colored based on marker expression of indicated gene after MAGIC50. f, Laser scanning confocal images of E5.5 and E6.0 Sox2-CreTG/+;ROSA26mT/mG (d) and Ttr-CreTG/+;ROSA26mT/mG (e) embryos immunostained for GFP, RFP (red fluorescent protein, membrane-localized tdTomato) and Gata6, a marker of endoderm identity, and VE at this stage. Cell nuclei stained with Hoechst and membranes labeled with RFP. Yellow arrowheads point cells of epiblast (EPI) origin present within the visceral endoderm (VE) epithelial layer. (n = 10/20 GFP-positive cells in VE of Sox2-CreTG/+;ROSA26mT/mG embryos, n = 0/27 GFP-positive cells in the EPI of Ttr-CreTG/+;ROSA26mT/mG embryos). Results validated in at least three independent experiments. ExE, extra-embryonic ectoderm. Scale bars: 50μm in low magnification images, 20μm in high magnification images. g, Laser confocal images of an E5.5 wild-type 4n <-> H2B-tdTomato embryonic stem cell (ESC) embryo chimera. An EPI cell is intercalating into the visceral endoderm layer (VE) (yellow arrowheads). Top two rows: Low and high magnification (3D images, maximum intensity projections) of an E5.5 wild-type 4n <-> H2B-tdTomato ESC embryo chimera (n = 9/19 showed Tomato-positive cells in the VE). Bottom rows: Low and high magnification views (2D images) of two E5.5 wild-type 4n <-> H2B-tdTomato ESC embryo chimeras. Embryo is counterstained with Hoechst to label nuclei, and Phalloidin to label F-Actin. Scale bars: 20μm in low magnification images, 10μm in high magnification images. A, anterior; D, distal; P, posterior; Pr, proximal.
Extended Data Figure 7: Emergence of spatial patterning of the embryo at E5.5.

a, Plot showing Palantir pseudo-time versus differentiation potential of VE cells from stages E3.5-E8.75. Drops in differential potential occur at two time points. The first at E5.5, as cells acquire a distal versus proximal fate and the second at E7.5 as cells acquire an anterior versus posterior fate. b, Plots of branch probabilities of commitment towards yolk sac endoderm (YsE), anterior and posterior gut endoderm. c, Marker based (i) and bulk RNA-seq based (ii) prediction of exVE and emVE at E7.5. (iii) Plots showing the Pearson correlation between bulk RNA-seq replicates of exVE and emVE. d, (i-ii) Plots showing differentially expressed genes between of exVE (291 genes) and emVE (2239 genes) derived using bulk RNA-seq data. e, Plots showing the branch probabilities of E7.5, E6.5 and E5.5 exVE and emVE cells to commit towards YsE (extra-embryonic) and gut tube (embryonic). Cells labeled as exVE and emVE based on expression of known markers (plot on the left), match expected Palantir branch probabilities (4 plots on the right). Branch probabilities of E5.5 cells in committing towards YsE and gut tube were used to infer putative exVE and emVE identities at E5.5. f, Plot showing pseudo-time versus differentiation potential of endoderm cells at E5.5 colored by the inferred cell type. (A zoomed in view of Extended Data Fig 7a). g, Heatmaps of highly expressed genes specifically in exVE or emVE at E5.5 also distinguish exVE and emVE cells at E6.5 and E7.5. h, ISH of E6.25 embryos showing expression of Lhx1 (n = 3) and Lefty1 (n = 3), genes specific for emVE, and Apln (n = 3) and Msx1 (n = 3) specific for exVE. Scale bars: 50μm. A, anterior; D, distal; P, posterior; Pr, proximal.
Extended Data Figure 8: Characterization of E8.75 gut tube anterior-posterior pseudo-space.

a, Force-directed layout as in Fig 5. (i): Plots showing the probabilities of anterior-posterior positioning for the Afp-GFP-positive/Afp-GFP-negative cells inferred using the manifold classifier trained on anterior-posterior cell. (ii): Plots showing the probabilities of GFP-positive/GFP-negative status for the cells from the anterior-posterior compartment inferred using the manifold classifier trained on GFP-positive/GFP-negative cells. b, (i): Anterior and posterior cells labeled by measured data (left). Anterior and posterior positions of Afp-GFP-positive/AFP-GFP-negative cells inferred data (right) using probabilities in (a-i). (ii): GFP-positive/GFP-negative cells labeled by measured data (left). GFP-positive/GFP-negative status of the anterior-posterior compartment cells inferred using probabilities in (a-ii). c, (i): Plot showing the first diffusion component of the E8.75 cells. (ii-iii): Plots showing the expression of anterior marker Nkx2.1 and posterior marker Hoxb9 in E8.75 cells. (iv-v): Bulk RNA-seq expression of Nkx2–1 and Hoxb9 in quadrants of the gut tube along the AP axis compares with A-P single cell expression patterns. d, Plot showing the proportion of anterior and posterior cells in bins along the AP pseudo-space axis. e, Receiver operating curve for classification of E7.5 VE and DE cells (4378 cells). f, Plots showing the expression patterns of genes that are best predictive of the DE class in the VE-DE classifier (top - DE; bottom -VE). g, Plots showing the expression patterns of genes in the DE best predictive of VE class in the VE-DE classifier. h, Force directed layouts following Harmony of E7.5 and E8.75 VE and DE cells with E7.5 cells highlighted in red (DE) and blue (VE) (left). E7.5 VE and DE cells colored by the branch probability of anterior localization (middle) and posterior localization (right). Black arrowheads indicate early emergence of AP spatial patterning at E7.5, with E7.5 DE cells predominantly destined towards anterior, and VE cells predominantly destined towards posterior. i, 3D renderings of gut tube depicting all endoderm cells along AP axis. Nuclei of VE and DE cells are labeled in green and grey, respectively. j, Plots comparing the ranks of proportion of GFP-positive cells along AP positioning in the Afp-GFP embryo-derived Neurolucida gut tube replicates (x-axis), and the ranks of VE cell proportions in bins along the AP pseudo-space axis (y-axis), the AP axis was partitioned into 20 bins, each dot representing the fraction of VE cells in that bin. k, Heatmap showing Pearson correlations between AP pseudo-space orderings determined using a varying number of diffusion components highlighting the robustness of the ordering. l, Plots comparing the AP pseudo-space ordering of GFP-positive/GFP-negative cells (replicate 2: 13335 cells) generated de novo using only the replicate 2 cells (x-axis, left) with the projected ordering from replicate 1 (8143 cells) (y-axis). Right panel shows a similar comparison with the pseudo-space ordering determined using cells of both the replicates on the x-axis. m, Same as l, for replicates of anterior-posterior cells (Replicate 1: 1821 cells, replicate 2: 1691 cells). Plots show the Pearson correlation.
Extended Data Figure 9: Spatial patterning of the gut tube at E8.75.

a, Plots showing individual Phenograph clusters densities of the E8.75 gut tube cells ordered along AP pseudo-space (left panel) and in force directed layouts (middle panel). In situ hybridization of representative differentially expressed genes in each cluster on whole E8.75 embryos (n > 3 for each gene) or micro-dissected E8.75 gut tubes (n > 3 for each gene) (right panels). Arrowheads point to expression of representative gene for each particular cluster. All scale bars: 200μm, except for Nkx2–1: 100μm. A, anterior; fg, foregut; hg, hindgut; L, left; mg, midgut; no, notochord; R, right; P, posterior. b, Density of E8.75 cells along the AP pseudo-space axis. c, Comparison of empirical AP pseudo-space axis and the predicted AP pseudo-space using expression of TFs. Each dot represents the AP pseudo-space computed by all genes, verses only by the selected TFs. d, Plot showing the ranking of different TFs according to their predictive power based on the regression model. e, Heatmap showing the coefficients for the top TFs when different proportions for cells are subsampled for the regression (total cells: 24990). f, Heatmap showing the Pearson correlation of TF coefficients in (e), highlighting the robustness of TF coefficients in regression.
Extended Data Figure 10: Hox gene expression within the E8.75 gut tube.

a, Force directed plots of Hox genes expressed in gut endoderm cells at E8.75. b, Whole-mount mRNA in situ hybridizations on whole E8.75 embryos (n > 3 for each gene) and micro-dissected gut tubes (n > 3 for each gene) of Hox genes depicting their distribution along the AP axis. All scale bars: 200μm, except for Hoxc10, Hoxd11: 100μm. A, anterior; fg, foregut; hg, hindgut; L, left; mg, midgut; R, right; P, posterior.
Extended Data Figure 11: Signaling map of the gut tube of the E8.75 mouse embryo.

Force directed layouts of context-independent targets of key signaling pathways acting within the endoderm lineage of the embryo. FGF/Fibroblast Growth Factor; WNT; BMP/Bone Morphogenic Protein; NOTCH; HH/Hedgehog; Nodal/TGF-beta signaling; JASK/STAT; RA/ Retinoic Acid; HIPPO.
Supplementary Material
Acknowledgements
We thank K. Anderson, A. Joyner, A. Martinez-Arias and L. Mazutis for discussions. L. Beccari, D. Duboule, L. Sussel, M. Torres, D. Wellik and M. Wilkinson for plasmids; B. Merill for antibodies; J. Brickman for ESCs. This work was supported by grants from the NIH (R01-DK084391 and R01-HD094868 to A.K.H.; DP1-HD084071 and R01-CA164729 to D.P.; P30-CA008748, to C. Thompson), MSKCC Society for Special Projects and Functional Genomics Initiative (to A.K.H. and D.P.), and NSERC (RGPIN-2018–05018 to P.H.). C.S.S. is supported by a NYSTEM postdoctoral training award from the Center for Stem Cell Biology MSKCC.
Footnotes
Competing interests
S.C.B and D.M.C. are employees and shareholders at 10x Genomics.
References
- 1.Zorn AM & Wells JM Vertebrate endoderm development and organ formation. Annu Rev Cell Dev Biol 25, 221–251, doi: 10.1146/annurev.cellbio.042308.113344 (2009). [DOI] [PMC free article] [PubMed] [Google Scholar]
- 2.Tremblay KD Formation of the murine endoderm: lessons from the mouse, frog, fish, and chick. Prog Mol Biol Transl Sci 96, 1–34, doi: 10.1016/B978-0-12-381280-3.00001-4 (2010). [DOI] [PubMed] [Google Scholar]
- 3.Chazaud C & Yamanaka Y Lineage specification in the mouse preimplantation embryo. Development 143, 1063–1074, doi: 10.1242/dev.128314 (2016). [DOI] [PubMed] [Google Scholar]
- 4.Nowotschin S & Hadjantonakis AK Cellular dynamics in the early mouse embryo: from axis formation to gastrulation. Curr Opin Genet Dev 20, 420–427, doi: 10.1016/j.gde.2010.05.008 (2010). [DOI] [PMC free article] [PubMed] [Google Scholar]
- 5.Viotti M, Nowotschin S & Hadjantonakis AK SOX17 links gut endoderm morphogenesis and germ layer segregation. Nat Cell Biol 16, 1146–1156, doi: 10.1038/ncb3070 (2014). [DOI] [PMC free article] [PubMed] [Google Scholar]
- 6.Viotti M, Nowotschin S & Hadjantonakis AK Afp::mCherry, a red fluorescent transgenic reporter of the mouse visceral endoderm. Genesis 49, 124–133, doi: 10.1002/dvg.20695 (2011). [DOI] [PMC free article] [PubMed] [Google Scholar]
- 7.Kwon GS, Viotti M & Hadjantonakis AK The endoderm of the mouse embryo arises by dynamic widespread intercalation of embryonic and extraembryonic lineages. Dev Cell 15, 509–520, doi: 10.1016/j.devcel.2008.07.017 (2008). [DOI] [PMC free article] [PubMed] [Google Scholar]
- 8.Sherwood RI, Chen TY & Melton DA Transcriptional dynamics of endodermal organ formation. Dev Dyn 238, 29–42, doi: 10.1002/dvdy.21810 (2009). [DOI] [PMC free article] [PubMed] [Google Scholar]
- 9.Hou J et al. A systematic screen for genes expressed in definitive endoderm by Serial Analysis of Gene Expression (SAGE). BMC Dev Biol 7, 92, doi: 10.1186/1471-213X-7-92 (2007). [DOI] [PMC free article] [PubMed] [Google Scholar]
- 10.Setty M et al. Palantir characterizes cell fate continuities in human hematopoiesis. Nature Biotechnology In press, doi: 10.1038/s41587-019-0068-4 (2019). [DOI] [Google Scholar]
- 11.Setty M et al. Palantir characterizes cell fate continuities in human hematopoiesis. BioRxiv, doi: 10.1101/385328 (2018). [DOI] [Google Scholar]
- 12.Kwon GS et al. Tg(Afp-GFP) expression marks primitive and definitive endoderm lineages during mouse development. Dev Dyn 235, 2549–2558, doi: 10.1002/dvdy.20843 (2006). [DOI] [PMC free article] [PubMed] [Google Scholar]
- 13.Azizi E et al. Single-Cell Map of Diverse Immune Phenotypes in the Breast Tumor Microenvironment. Cell 174, 1293–1308 e1236, doi: 10.1016/j.cell.2018.05.060 (2018). [DOI] [PMC free article] [PubMed] [Google Scholar]
- 14.Levine JH et al. Data-Driven Phenotypic Dissection of AML Reveals Progenitor-like Cells that Correlate with Prognosis. Cell 162, 184–197, doi: 10.1016/j.cell.2015.05.047 (2015). [DOI] [PMC free article] [PubMed] [Google Scholar]
- 15.Amir el AD et al. viSNE enables visualization of high dimensional single-cell data and reveals phenotypic heterogeneity of leukemia. Nat Biotechnol 31, 545–552, doi: 10.1038/nbt.2594 (2013). [DOI] [PMC free article] [PubMed] [Google Scholar]
- 16.Setty M et al. Wishbone identifies bifurcating developmental trajectories from single-cell data. Nat Biotechnol 34, 637–645, doi: 10.1038/nbt.3569 (2016). [DOI] [PMC free article] [PubMed] [Google Scholar]
- 17.Ibarra-Soria X et al. Defining murine organogenesis at single-cell resolution reveals a role for the leukotriene pathway in regulating blood progenitor formation. Nat Cell Biol 20, 127–134, doi: 10.1038/s41556-017-0013-z (2018). [DOI] [PMC free article] [PubMed] [Google Scholar]
- 18.Haghverdi L, Buttner M, Wolf FA, Buettner F & Theis FJ Diffusion pseudotime robustly reconstructs lineage branching. Nat Methods 13, 845–848, doi: 10.1038/nmeth.3971 (2016). [DOI] [PubMed] [Google Scholar]
- 19.Farrell JA et al. Single-cell reconstruction of developmental trajectories during zebrafish embryogenesis. Science 360, doi: 10.1126/science.aar3131 (2018). [DOI] [PMC free article] [PubMed] [Google Scholar]
- 20.Plusa B, Piliszek A, Frankenberg S, Artus J & Hadjantonakis AK Distinct sequential cell behaviours direct primitive endoderm formation in the mouse blastocyst. Development 135, 3081–3091, doi: 10.1242/dev.021519 (2008). [DOI] [PMC free article] [PubMed] [Google Scholar]
- 21.Chazaud C, Yamanaka Y, Pawson T & Rossant J Early lineage segregation between epiblast and primitive endoderm in mouse blastocysts through the Grb2-MAPK pathway. Dev Cell 10, 615–624, doi: 10.1016/j.devcel.2006.02.020 (2006). [DOI] [PubMed] [Google Scholar]
- 22.Artus J, Piliszek A & Hadjantonakis AK The primitive endoderm lineage of the mouse blastocyst: sequential transcription factor activation and regulation of differentiation by Sox17. Dev Biol 350, 393–404, doi: 10.1016/j.ydbio.2010.12.007 (2011). [DOI] [PMC free article] [PubMed] [Google Scholar]
- 23.Silva J et al. Nanog is the gateway to the pluripotent ground state. Cell 138, 722–737, doi: 10.1016/j.cell.2009.07.039 (2009). [DOI] [PMC free article] [PubMed] [Google Scholar]
- 24.Schrode N, Saiz N, Di Talia S & Hadjantonakis AK GATA6 levels modulate primitive endoderm cell fate choice and timing in the mouse blastocyst. Dev Cell 29, 454–467, doi: 10.1016/j.devcel.2014.04.011 (2014). [DOI] [PMC free article] [PubMed] [Google Scholar]
- 25.Morgani SM et al. A Sprouty4 reporter to monitor FGF/ERK signaling activity in ESCs and mice. Dev Biol 441, 104–126, doi: 10.1016/j.ydbio.2018.06.017 (2018). [DOI] [PMC free article] [PubMed] [Google Scholar]
- 26.Molotkov A, Mazot P, Brewer JR, Cinalli RM & Soriano P Distinct Requirements for FGFR1 and FGFR2 in Primitive Endoderm Development and Exit from Pluripotency. Dev Cell 41, 511–526 e514, doi: 10.1016/j.devcel.2017.05.004 (2017). [DOI] [PMC free article] [PubMed] [Google Scholar]
- 27.Kang M, Garg V & Hadjantonakis AK Lineage Establishment and Progression within the Inner Cell Mass of the Mouse Blastocyst Requires FGFR1 and FGFR2. Dev Cell 41, 496–510 e495, doi: 10.1016/j.devcel.2017.05.003 (2017). [DOI] [PMC free article] [PubMed] [Google Scholar]
- 28.Ohnishi Y et al. Cell-to-cell expression variability followed by signal reinforcement progressively segregates early mouse lineages. Nat Cell Biol 16, 27–37, doi: 10.1038/ncb2881 (2014). [DOI] [PMC free article] [PubMed] [Google Scholar]
- 29.Kang M, Piliszek A, Artus J & Hadjantonakis AK FGF4 is required for lineage restriction and salt-and-pepper distribution of primitive endoderm factors but not their initial expression in the mouse. Development 140, 267–279, doi: 10.1242/dev.084996 (2013). [DOI] [PMC free article] [PubMed] [Google Scholar]
- 30.Thomas PQ, Brown A & Beddington RS Hex: a homeobox gene revealing peri-implantation asymmetry in the mouse embryo and an early transient marker of endothelial cell precursors. Development 125, 85–94 (1998). [DOI] [PubMed] [Google Scholar]
- 31.Meno C et al. Mouse Lefty2 and zebrafish antivin are feedback inhibitors of nodal signaling during vertebrate gastrulation. Mol Cell 4, 287–298 (1999). [DOI] [PubMed] [Google Scholar]
- 32.Belo JA et al. Cerberus-like is a secreted factor with neutralizing activity expressed in the anterior primitive endoderm of the mouse gastrula. Mech Dev 68, 45–57 (1997). [DOI] [PubMed] [Google Scholar]
- 33.Arnold SJ & Robertson EJ Making a commitment: cell lineage allocation and axis patterning in the early mouse embryo. Nat Rev Mol Cell Biol 10, 91–103, doi: 10.1038/nrm2618 (2009). [DOI] [PubMed] [Google Scholar]
- 34.Hayashi S, Lewis P, Pevny L & McMahon AP Efficient gene modulation in mouse epiblast using a Sox2Cre transgenic mouse strain. Mech Dev 119 Suppl 1, S97–S101 (2002). [DOI] [PubMed] [Google Scholar]
- 35.Kwon GS & Hadjantonakis AK Transthyretin mouse transgenes direct RFP expression or Cre-mediated recombination throughout the visceral endoderm. Genesis 47, 447–455, doi: 10.1002/dvg.20522 (2009). [DOI] [PMC free article] [PubMed] [Google Scholar]
- 36.Muzumdar MD, Tasic B, Miyamichi K, Li L & Luo L A global double-fluorescent Cre reporter mouse. Genesis 45, 593–605, doi: 10.1002/dvg.20335 (2007). [DOI] [PubMed] [Google Scholar]
- 37.Takaoka K, Yamamoto M & Hamada H Origin and role of distal visceral endoderm, a group of cells that determines anterior-posterior polarity of the mouse embryo. Nat Cell Biol 13, 743–752, doi: 10.1038/ncb2251 (2011). [DOI] [PubMed] [Google Scholar]
- 38.Paca A et al. BMP signaling induces visceral endoderm differentiation of XEN cells and parietal endoderm. Dev Biol 361, 90–102, doi: 10.1016/j.ydbio.2011.10.013 (2012). [DOI] [PubMed] [Google Scholar]
- 39.Kruithof-de Julio M et al. Regulation of extra-embryonic endoderm stem cell differentiation by Nodal and Cripto signaling. Development 138, 3885–3895, doi: 10.1242/dev.065656 (2011). [DOI] [PMC free article] [PubMed] [Google Scholar]
- 40.Artus J et al. BMP4 signaling directs primitive endoderm-derived XEN cells to an extraembryonic visceral endoderm identity. Dev Biol 361, 245–262, doi: 10.1016/j.ydbio.2011.10.015 (2012). [DOI] [PMC free article] [PubMed] [Google Scholar]
- 41.Serra M et al. Pluripotent stem cell differentiation reveals distinct developmental pathways regulating lung- versus thyroid-lineage specification. Development 144, 3879–3893, doi: 10.1242/dev.150193 (2017). [DOI] [PMC free article] [PubMed] [Google Scholar]
- 42.Becker MB, Zulch A, Bosse A & Gruss P Irx1 and Irx2 expression in early lung development. Mech Dev 106, 155–158 (2001). [DOI] [PubMed] [Google Scholar]
- 43.Yang Y, Akinci E, Dutton JR, Banga A & Slack JM Stage specific reprogramming of mouse embryo liver cells to a beta cell-like phenotype. Mech Dev 130, 602–612, doi: 10.1016/j.mod.2013.08.002 (2013). [DOI] [PMC free article] [PubMed] [Google Scholar]
- 44.Offield MF et al. PDX-1 is required for pancreatic outgrowth and differentiation of the rostral duodenum. Development 122, 983–995 (1996). [DOI] [PubMed] [Google Scholar]
- 45.Tsai YH et al. In vitro patterning of pluripotent stem cell-derived intestine recapitulates in vivo human development. Development 144, 1045–1055, doi: 10.1242/dev.138453 (2017). [DOI] [PMC free article] [PubMed] [Google Scholar]
- 46.Deschamps J & van Nes J Developmental regulation of the Hox genes during axial morphogenesis in the mouse. Development 132, 2931–2942, doi: 10.1242/dev.01897 (2005). [DOI] [PubMed] [Google Scholar]
- 47.Di Gregorio A, Bowling S & Rodriguez TA Cell Competition and Its Role in the Regulation of Cell Fitness from Development to Cancer. Dev Cell 38, 621–634, doi: 10.1016/j.devcel.2016.08.012 (2016). [DOI] [PubMed] [Google Scholar]
- 48.Hiramatsu R et al. External mechanical cues trigger the establishment of the anterior-posterior axis in early mouse embryos. Dev Cell 27, 131–144, doi: 10.1016/j.devcel.2013.09.026 (2013). [DOI] [PubMed] [Google Scholar]
- 49.McCauley HA & Wells JM Pluripotent stem cell-derived organoids: using principles of developmental biology to grow human tissues in a dish. Development 144, 958–962, doi: 10.1242/dev.140731 (2017). [DOI] [PMC free article] [PubMed] [Google Scholar]
- 50.van Dijk D et al. Recovering Gene Interactions from Single-Cell Data Using Data Diffusion. Cell 174, 716–729 e727, doi: 10.1016/j.cell.2018.05.061 (2018). [DOI] [PMC free article] [PubMed] [Google Scholar]
- 51.Kwon GS et al. Tg(Afp-GFP) expression marks primitive and definitive endoderm lineages during mouse development. Dev Dyn 235, 2549–2558, doi: 10.1002/dvdy.20843 (2006). [DOI] [PMC free article] [PubMed] [Google Scholar]
- 52.Hayashi S, Lewis P, Pevny L & McMahon AP Efficient gene modulation in mouse epiblast using a Sox2Cre transgenic mouse strain. Mech Dev 119 Suppl 1, S97–S101 (2002). [DOI] [PubMed] [Google Scholar]
- 53.Kwon GS & Hadjantonakis AK Transthyretin mouse transgenes direct RFP expression or Cre-mediated recombination throughout the visceral endoderm. Genesis 47, 447–455, doi: 10.1002/dvg.20522 (2009). [DOI] [PMC free article] [PubMed] [Google Scholar]
- 54.Muzumdar MD, Tasic B, Miyamichi K, Li L & Luo L A global double-fluorescent Cre reporter mouse. Genesis 45, 593–605, doi: 10.1002/dvg.20335 (2007). [DOI] [PubMed] [Google Scholar]
- 55.Behringer RG,M; Nagy KV and Nagy A Manipulating the Mouse Embryo: A Laboratory Manual. Fourth Edition edn, (Cold Spring Harbor Laboratory Press, 2014). [Google Scholar]
- 56.Downs KM & Davies T Staging of gastrulating mouse embryos by morphological landmarks in the dissecting microscope. Development 118, 1255–1266 (1993). [DOI] [PubMed] [Google Scholar]
- 57.Morgani SM et al. Totipotent embryonic stem cells arise in ground-state culture conditions. Cell Rep 3, 1945–1957, doi: 10.1016/j.celrep.2013.04.034 (2013). [DOI] [PMC free article] [PubMed] [Google Scholar]
- 58.Kwon GS, Viotti M & Hadjantonakis AK The endoderm of the mouse embryo arises by dynamic widespread intercalation of embryonic and extraembryonic lineages. Dev Cell 15, 509–520, doi: 10.1016/j.devcel.2008.07.017 (2008). [DOI] [PMC free article] [PubMed] [Google Scholar]
- 59.Zheng GX et al. Massively parallel digital transcriptional profiling of single cells. Nat Commun 8, 14049, doi: 10.1038/ncomms14049 (2017). [DOI] [PMC free article] [PubMed] [Google Scholar]
- 60.Plusa B, Piliszek A, Frankenberg S, Artus J & Hadjantonakis AK Distinct sequential cell behaviours direct primitive endoderm formation in the mouse blastocyst. Development 135, 3081–3091, doi: 10.1242/dev.021519 (2008). [DOI] [PMC free article] [PubMed] [Google Scholar]
- 61.Frankenberg S et al. Primitive endoderm differentiates via a three-step mechanism involving Nanog and RTK signaling. Dev Cell 21, 1005–1013, doi: 10.1016/j.devcel.2011.10.019 (2011). [DOI] [PubMed] [Google Scholar]
- 62.Dobin A et al. STAR: ultrafast universal RNA-seq aligner. Bioinformatics 29, 15–21, doi: 10.1093/bioinformatics/bts635 (2013). [DOI] [PMC free article] [PubMed] [Google Scholar]
- 63.Lawrence M et al. Software for computing and annotating genomic ranges. PLoS Comput Biol 9, e1003118, doi: 10.1371/journal.pcbi.1003118 (2013). [DOI] [PMC free article] [PubMed] [Google Scholar]
- 64.Love MI, Huber W & Anders S Moderated estimation of fold change and dispersion for RNA-seq data with DESeq2. Genome Biol 15, 550, doi: 10.1186/s13059-014-0550-8 (2014). [DOI] [PMC free article] [PubMed] [Google Scholar]
- 65.Setty M et al. Palantir characterizes cell fate continuities in human hematopoiesis. Nature Biotechnology In press, doi: 10.1038/s41587-019-0068-4 (2019). [DOI] [Google Scholar]
- 66.Setty M et al. Palantir characterizes cell fate continuities in human hematopoiesis. BioRxiv, doi: 10.1101/385328 (2018). [DOI] [Google Scholar]
- 67.Levine JH et al. Data-Driven Phenotypic Dissection of AML Reveals Progenitor-like Cells that Correlate with Prognosis. Cell 162, 184–197, doi: 10.1016/j.cell.2015.05.047 (2015). [DOI] [PMC free article] [PubMed] [Google Scholar]
Associated Data
This section collects any data citations, data availability statements, or supplementary materials included in this article.
Supplementary Materials
Data Availability Statement
All the generated data including bulk and scRNA-seq data is available through GEO. Accession numbers: GSE123046 (scRNA-seq) and GSE123124 (bulk RNA-seq).