

Abstract
HRAS, NRAS, and KRAS isoforms are almost identical proteins that are ubiquitously expressed and activate a common set of effectors. In vivo studies have revealed that they are not biologically redundant; however, the isoform specificity of Ras signaling remains poorly understood. Using a novel panel of isogenic SW48 cell lines endogenously expressing wild-type or G12V-mutated activated Ras isoforms, we have performed a detailed characterization of endogenous isoform-specific mutant Ras signaling. We find that despite displaying significant Ras activation, the downstream outputs of oncogenic Ras mutants are minimal in the absence of growth factor inputs. The lack of mutant KRAS-induced effector activation observed in SW48 cells appears to be representative of a broad panel of colon cancer cell lines harboring mutant KRAS. For MAP kinase pathway activation in KRAS-mutant cells, the requirement for coincident growth factor stimulation occurs at an early point in the Raf activation cycle. Finally, we find that Ras isoform-specific signaling was highly context dependent and did not conform to the dogma derived from ectopic expression studies.
INTRODUCTION
Ras proteins are ubiquitously expressed monomeric GTPases that represent key signaling hubs operating downstream of growth factor receptors to regulate cell proliferation, differentiation, protein synthesis, metabolism and cell survival (Pylayeva-Gupta et al., 2011; Hobbs et al., 2016). Activation of Ras generates a network response; however, the most intensively studied effector pathways are the Raf-MEK-ERK and PtdIns 3-kinase (PI3K)-AKT pathways (Cox and Der, 2011). Oncogenic mutations in Ras at codons 12, 13, or 61 are present in ∼ 20% of human cancers (Prior et al., 2012). Whereas all of these mutations are activating, recent work has indicated that each mutation specifies a distinct Ras output and propensity for promoting oncogenesis (De Roock et al., 2010; Ihle et al., 2012; Burd et al., 2014; Alamo et al., 2015; Hammond et al., 2015; Stolze et al., 2015; Winters et al., 2017).
Three ubiquitously expressed Ras genes (HRAS, KRAS, and NRAS) encode at least four isoforms that, despite being almost identical, are not functionally redundant. In vivo evidence for this comes from studies of mouse development where KRAS knockout mice are embryonic lethal, whereas NRAS and HRAS double knockout mice are healthy (Koera et al., 1997; Esteban et al., 2001). Mice with HRAS inserted into the KRAS locus are viable; however, they exhibit cardiomyopathy that suggests patterns of expression and gene dosing define the majority of the isoform-specific effects on development, whereas there may still be KRAS-specific contributions to healthy development (Potenza et al., 2005). Other evidence comes from large-scale profiling of the distribution of oncogenic Ras mutations that reveals an isoform-specific bias, with KRAS being the most frequently mutated isoform (Prior et al., 2012). Furthermore, comparative studies using mouse models endogenously expressing activated mutant Ras isoforms reveal that only KRAS is capable of promoting colonic epithelium proliferation (Haigis et al., 2008).
The Ras isoform-specific signaling differences underpinning these in vivo differences remain poorly understood. Ectopic overexpression studies revealed that whereas all Ras isoforms can activate canonical Raf-MAP-kinase and PI3K-AKT pathways, they are differentially coupled. Specifically, KRAS is a better activator of Raf and Rac, whereas HRAS and NRAS are better activators of PI3K (Yan et al., 1998; Voice et al., 1999). Notably, however, cells derived from KRAS-mutant mouse models and cancer cell lines harboring endogenous mutant Ras frequently do not exhibit the high levels of PI3K and Raf-MAP kinase pathway activation seen in overexpression studies (Iida et al., 1999; Yip-Schneider et al., 1999; Giehl et al., 2000; Tuveson et al., 2004; Omerovic et al., 2008). Similarly, synthetic lethality studies have illustrated the significant context dependence associated with Ras signaling (Downward, 2015). This means that any systematic characterization of isoform-specific Ras signaling needs to be either based on very large panels of cell lines or performed in isogenic model systems where endogenous signaling is measured.
Genome-edited isogenic cell models allow the study of Ras variants expressed from endogenous loci while avoiding context-dependent differences associated with different genetic backgrounds. The majority of isogenic cell models have used genetic ablation of a wild-type or oncogenic KRAS allele resulting in some gene dosing differences between wild-type and oncogenic KRAS cells (Shirasawa et al., 1993; Kim et al., 2004; Di Nicolantonio et al., 2008; Yun et al., 2009). More recently, recombinant adeno-associated virus (rAAV)-targeted genome editing has been used to generate a panel of isogenic colorectal SW48 cells harboring a range of heterozygous mutations at codons 12 or 13 of the KRAS gene (De Roock et al., 2010). Importantly, each individual mutation generates a distinct oncogenic and network response (Ihle et al., 2012; Burd et al., 2014; Hammond et al., 2015), which means that any comparison of isoform-specific oncogenic Ras signaling should incorporate the same activating mutation in each Ras gene. Taking this into account, we have developed a novel isogenic SW48 cell panel and employed a focused network biology strategy to characterize the context dependence of endogenous isoform-specific Ras-signaling responses.
RESULTS
An isogenic panel of Ras G12V SW48 cells
To investigate endogenous isoform-specific Ras signaling, we generated isogenic NRASG12V cell lines to complement an existing panel of heterozygous G12V-mutated Ras-variant SW48 cell lines. The same Parental SW48 cells harboring wild-type Ras isoforms and an rAAV-based genome-editing strategy were used for the generation of all of the isogenic cell lines used in this study. The presence of an oncogenic Ras variant results in no obvious change in the protein abundance of the mutated or wild-type Ras isoforms in each of the isogenic cell lines (Figure 1A). Highly transforming G12V mutations result in constitutive Ras activation and are present in 20% of human cancers that possess a mutated Ras (Prior et al., 2012). However, the presence of a G12V-mutated Ras isoform does not result in noticeable activation of canonical Ras effector pathways in the absence of serum, where any signaling will be entirely contingent on the mutant Ras proteins (Figure 1B). The lack of response in serum-starved cells harboring hyperactive Ras isoforms is in significant contrast to the effector activation observed in wild-type cells stimulated for 5 min with 15 ng/ml epidermal growth factor (EGF) (Figure 1B). One explanation for this could be that the absence of growth factors reduced nucleotide exchange on Ras to the point where G12V-induced resistance to GAP-mediated GTP hydrolysis became redundant. However, this does not seem to be the case, since significant Ras activity is detected for each isoform harboring a G12V mutation (Supplemental Figure S1, A and B).
FIGURE 1:

Context-dependent activation of canonical Ras effectors by endogenous Ras isoforms. (A) Ras isoform protein expression is similar to Parental (P) control in all isogenic cell lines. (B) The presence of an oncogenic RasG12V allele is insufficient to activate effector pathways in the absence of coincident growth factor stimulation. (C) There are no clear isoform-specific effects on effector activation in response to cell culture in the presence of 10% FBS. Western blotting data representative of n ≥ 3 biological replicates. (D) Luminex-based measurement of key nodes within the Ras-signaling network in untreated and growth factor-stimulated cells reveals that differential coupling of Ras isoforms with the RAF (pMEK, pERK, pp90RSK) or PI3K PI3K (pAKT, pMTOR, pRPS6) pathways is not a generic feature of Ras signaling; mean ± SD of n = 2 biological replicates. p Values correspond to Tukey’s test (vs. Parental) for those cases where multiple testing corrected one-way ANOVA was significant (FDR ≤ 0.05); *p < 0.05, **p < 0.01, ***p < 0.001.
Standard cell culture conditions in the presence of 10% fetal bovine serum (FBS) revealed subtle isoform-specific patterns of effector activation, although they do not exceed the variability observed between KRASG12V clones (Figure 1C). Therefore, mutant Ras activation of effectors is growth factor dependent, and in the presence of a cocktail of growth factors in FBS, we found no evidence for isoform specificity of endogenous Ras coupling to canonical effector pathways.
The variability in some outputs that we observed between the KRASG12V cells raised questions about whether our other cells were likely to be representative. We were unable to generate additional HRASG12V clones; however, we were able to generate a larger panel of NRASG12V clones and observed similar MAPK pathway outputs to the clone that we had already selected and some heterogeneity in the AKT pathway response (Supplemental Figure S2). The heterogeneity that we observed within the NRASG12V panel was no greater than that observed between the KRASG12V clones. Therefore, to acknowledge the potential for clonality to confound our observations, we have included both KRASG12V clones in all subsequent experiments. Although clonality means that any subtle differences between isoforms are unable to be clearly described, all clones show the same growth factor dependence for observing robust activation of canonical Ras effector pathways.
Basal downstream signaling is reduced and GF responses are isoform-specific
To characterize the wider network responses of endogenous Ras isoform signaling, we performed Luminex analysis incorporating phospho-antibody reporters of the activation status of 16 relevant downstream and feedback-regulated signaling nodes. Cells under basal serum-starved cell culture conditions exhibited no activation of the Ras network in the presence of any of the constitutively active Ras isoforms (Supplemental Figure S3A). Indeed, all but five of the 64 measurements of Ras effector phosphorylation are decreased in mutant Ras cells versus wild-type Ras Parental cells, with both KRASG12V clones generally displaying the most pronounced levels of Ras network suppression. This may reflect uncoupling of oncogenic Ras from downstream signaling and/or adaptive engagement of negative feedback pathways downstream of active Ras to suppress the network response.
In response to growth factor stimulation, Parental as well as G12V-mutant cell lines exhibit increased activation throughout their Ras network, although this is context dependent (Figure 1D and Supplemental Figure S3B). Within the RAF-MAP kinase pathway, the suppressed outputs in Ras-mutant cells compared with Parental control are generally less evident with coincident growth factor stimulation. This is particularly clear for all isoforms following EGF stimulation and for human growth factor (HGF) stimulation of AKT in HRAS and KRAS-mutant SW48 cells. EGF is the most potent of the three growth factors at activating the Raf pathway (pMEK-pERK-pp90RSK) with, for example, 10- to 15-fold increases in MEK activation versus untreated, compared with two- and fourfold increases, respectively, following HGF and insulin-like growth factor (IGF) stimulation (Figure 1D and Supplemental Figure S3B). In the EGF condition, we also see a trend for an additive effect of HRAS for MEK-ERK activation. While this suggests enhanced coupling between HRAS and the RAF-MAP kinase pathway compared with the other Ras isoforms, this is only present in the context of EGF stimulation and not a general feature of HRAS signaling. Notably, Ras activity is less stimulatable by EGF if a cell harbors a mutant Ras isoform (Supplemental Figure S1, A and C).
Within the PI3K pathway, the significant suppression of KRAS activation of AKT and RPS6 versus Parental control is lost when cells are stimulated with growth factors. Strikingly, we observe potent activation of AKT and RPS6 in HGF-stimulated KRAS-mutant SW48 cells compared with the other cell lines (Figure 1D and Supplemental Figure S3B). Therefore, analogous to HRAS coupling to the RAF pathway, KRAS coupling to the PI3K-AKT pathway is also highly context dependent and not a generic feature of endogenous isoform-specific Ras signaling.
Generation of perturbation data to systematically probe signaling
To get a deeper understanding, we used a network biology approach where responses to pathway manipulations can be used to inform mathematical models that predict signaling flow within a network (Klinger et al., 2013). To generate the data for mathematical modeling, we performed, in addition to the stimulation experiments depicted in Figure 1D, a broad range of combinatorial treatments targeting the Ras-signaling network (Figure 2A). Specifically, we stimulated the indicated isogenic SW48 cells for 20 min with empirically determined subsaturating doses of three growth factors: EGF, HGF, and IGF. The cells had been preincubated for 1 h with pharmacological inhibitors of MEK, PI3K, MTOR, Src or solvent control, and the phosphorylation status of 16 members of the local Ras signaling network was measured in a Luminex proteomics platform (Figure 2B and Supplemental Figure S4). The presence of inhibitors was maintained while coincident growth factor stimulation was performed. The 20-min stimulatory time point was chosen because it represented signaling in an approximate steady state during the long-term plateau phase that follows the initial strong transient peak (Klinger et al., 2013).
FIGURE 2:
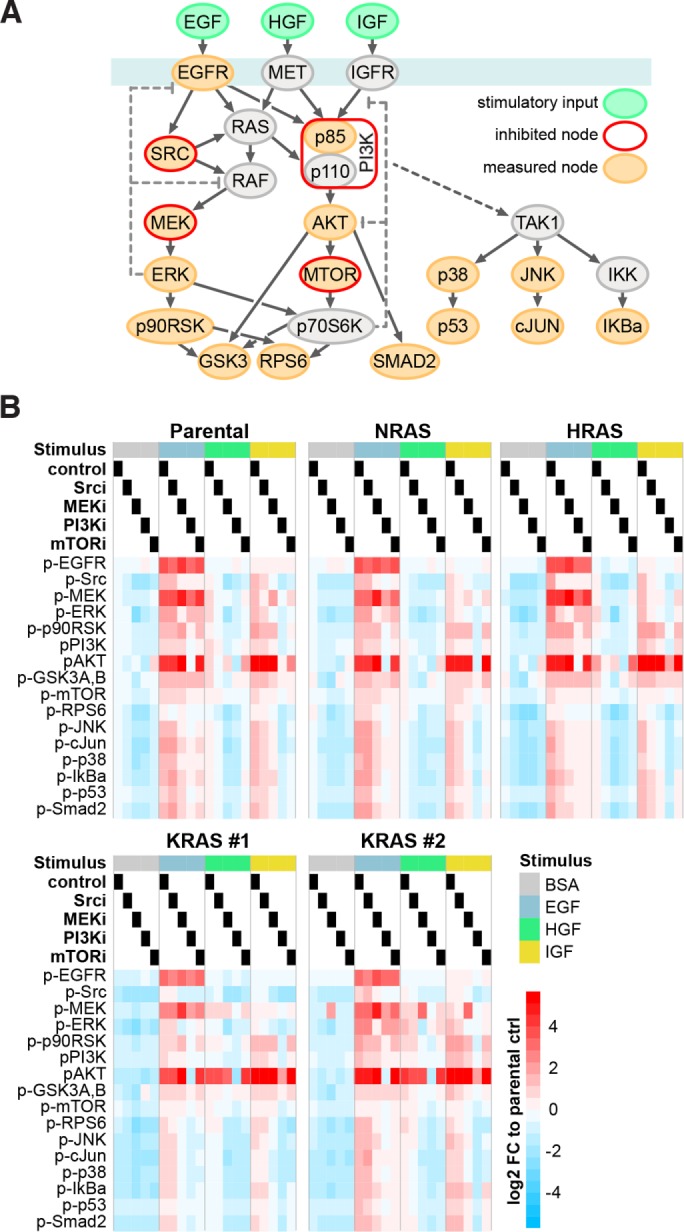
Generation of systematic perturbation data. (A) Schema depicting stimulated, inhibited, and measured nodes within the Ras-signaling network that were used for generation of systematic perturbation data. (B) Log2-fold changes (FC) of phosphorylation in response to combinations of growth factor stimulation and node inhibition across the five isogenic SW48 cells lines measured with Luminex-based phospho-assays are displayed. Values are averaged signals from n = 2 biological replicates normalized to the untreated Parental cell line control (BSA-treated control lane).
While generally there are subtle differences between cell lines in response to combinatorial treatments, AKT and MEK activation in HGF-stimulated KRAS cells are the most obvious outliers (Figure 2B and Supplemental Figure S4). All cell lines show >10-fold up-regulation of MEK phosphorylation in the presence of MEK inhibitor in EGF-stimulated cells that would be consistent with the loss of ERK–dependent negative feedback.
Modeling unveils subtle interlineal differences and a clear overall effect on signaling
Luminex measurements were incorporated into mathematical models of network connectivity. We quantified the feedforward and feedback relationships within a core network around Ras in each cell line using mathematical modeling. The algorithm determines network structure and parameterizations based on modular response analysis (MRA) (Klinger et al., 2013) (Figure 3A). The model pipeline estimates response coefficients for an initial literature-based network and then iteratively edits the network to generate the best consensus network for the whole data set derived from the perturbation experiments (Figure 3B, points 1 and 2). Afterward, significantly differing parameters across data sets are derived by first modeling all data sets with the same parameter set and then iteratively testing if individual fitting of each parameter significantly improved the overall fit (likelihood ratio test, p ≤ 0.05). Of the 21 parameters tested, 10 were required to be fitted specifically to each data set. Looking at the localization of the edges where variability was observed between the Ras-mutant SW48 cells (Figure 3B, point 3), we can see that mainly the upstream signaling is different in the cell lines as five of the six receptor-associated parameters have to be differential, whereas eight of the 10 links downstream of ERK and AKT can be modeled with the same parameter (dashed links). When looking at the variation size of the differential signaling parameters across cell line models (as absolute coefficient of variation [CV]), three parameters (ERK-RAF feedback and MET downstream links) have to be varied strongly (CV > 1), whereas the remaining seven only required minor changes (CV < 0.5). Thus, by individually modeling 10 of the total 24 parameters (including the three quantifications of inhibitor strengths that were not allowed to vary between cell lines), we can simulate cell line-specific responses that are in good agreement with the experimental data (Figure 3C). To more closely study the differential signaling, we clustered the cell lines according to the 10 variable parameters (row-wise normalized to absolute maximum; Figure 3D). Whereas most represent relatively subtle differences, in general, the KRAS clones differentiate from the other cell lines across each of the parameters. The most striking differences are seen for HGF-induced activation of the RAF pathway and EGF/HGF/IGF-induced activation of the PI3K pathways that in each case is strongest in the KRAS-mutant SW48 cells.
FIGURE 3:

Model fit reveals Ras isoform-specific differences in network topology. (A) Workflow of modeling steps to determine differential signaling based on MRA. (B) Realization of modeling steps from A: the starting network, consensus network with pruned (red) and extended (blue) links (Χ2-test, p ≤ 0.05), and the resultant differential signaling network of which the numbers and line width reflect differential signaling across the five cell lines as absolute CV of the parameter quantifications and dashed links denote unvaried links. (C) Side-by-side comparison of experimental data (black) and model simulations (yellow) derived from the final model (step 3 in B). (D) Clustered heat map of the variable network parameters with each row scaled by the absolute maximal value.
Apart from modeling individual Ras isoform-specific models, we also applied a holistic model that included all data sets and modeled Ras mutations as perturbations of the Parental state. This allowed us to dissect the direct impact of the Ras mutation on their downstream outputs, using the previously defined network topology (see Figure 3B, point 2). We found that all Ras mutations had a negative impact on signaling via PI3K and Raf versus Parental cells in each cellular context (Supplemental Figure S4). Specifically, we find that basal signaling (in the absence of growth factors) is trending downward in Ras mutant SW48 cell lines and their growth factor inducibility is decreased compared with Parental cells.
RASG12V signaling is attenuated upstream of RAF and requires receptor stimulation
The network analysis reinforces our earlier observation that active Ras mutants do not exhibit potent effector stimulation in the absence of growth factors (Figure 1B), but the mechanism remains unclear. To address this, we focused on the Raf-MAP kinase pathway and considered each of the points where the signal could be interrupted or remodeled (Figure 4A). Phosphorylation of Ser259 on CRAF provides a 14-3-3 binding site that stabilizes CRAF in an auto-inhibited state unable to bind to Ras (Lavoie and Therrien, 2015). We observed a trend for reduced phosphorylation in the presence of growth factors but not RAS mutation alone (Figure 4B). The differences are marginal and it is difficult to infer whether there will be consequences in the capacity for mutated RAS SW48 cells to recruit Raf to the membrane. However, Raf heterodimerization that occurs downstream of Ras recruitment was seen only in the presence of growth factor stimulation (Figure 4C). Oncogenically mutated KRAS was unable to promote Raf dimerization in the absence of growth factors suggesting either that Raf has not been efficiently recruited to the membrane or that dimerization is sensitive to coincident growth factor signaling. Phosphorylation of Ser338 in the catalytic domain of CRAF indicates a fully active Raf molecule (Lavoie and Therrien, 2015). Clear growth factor dependence is seen for activating phosphorylation of CRAF and downstream effectors (Figure 4, D and E). Finally, we explored whether negative feedback was actively down-regulating mutant RAS signaling. Negative feedback phosphorylation of Ser289/296/301 on CRAF is mediated by activated ERK (Lavoie and Therrien, 2015), and we saw clear sensitivity of these sites to MEK inhibition following EGF stimulation but not in the starved condition when any MEK-ERK activation would be driven exclusively by mutant RAS (Figure 4F, Supplemental Figure S5). Therefore, the low levels of MEK-ERK phosphorylation seen in mutant RAS SW48 cells in the absence of growth factor stimulation are not a cause or consequence of negative feedback to CRAF. Together, these data demonstrate that oncogenically mutated RAS in our cells is unable to activate the Raf-MAP kinase pathway in the absence of coincident growth factor stimulation and that the requirement for growth factors is evident from early in the Raf activation cycle.
FIGURE 4:

Oncogenically mutated Ras requires coincident growth factor stimulation to activate Raf. (A) The Raf activation cycle. (B) RAF auto-inhibitory phosphorylation is largely unchanged by Ras mutation. (C) Growth factor dependence is observed with BRAF:CRAF heterodimerization. (D) Activating phosphorylation of the CRAF kinase catalytic domain, (E) downstream activation of CRAF effectors, and (F) ERK-mediated negative feedback to CRAF revealed by decreased CRAF phosphorylation in the presence of MEK inhibitors. All blots are representative of n ≥ 3 biological replicates. Graphs depict mean values ± SEM; paired, equal variance t test vs. Parental cells or indicated pairwise comparisons, *p < 0.05, **p < 0.01, ***p < 0.001, n = 3 biological replicates. Cells starved for 24 h (EGF –), ±15 ng/ml EGF stimulation (EGF +) for 5 min for all experiments, except 20 min for feedback experiment.
Oncogenic Ras decoupling from effector pathways is also observed in a wider colorectal cancer cell panel
There are no independent isogenic systems with equivalent mutations in each of Ras isoforms that we could use to increase confidence in the wider applicability of our findings. Instead we assembled a panel of colorectal cancer cell lines variously containing mutations in Ras pathway components (Figure 5A). Quantitation of Western blots from biological replicates reveals that KRAS mutation status does not define the effector response and coclustering of mutant and wild-type KRAS cell lines is observed (Figure 5B). Notably, there is no evidence of effector stimulation in a subset of KRAS-mutant cell lines with only 7/11 pMEK and 6/11 pAKT responses in KRAS-mutant cells displaying increased phosphorylation versus wild-type SW48 cells and only 1/11 KRAS-mutant cell lines showing strong pAKT increases (Figure 5A). This is consistent with the observations in the SW48 cell panel where the presence of mutated Ras did not lead to AKT or MEK phosphorylation in the serum-starved context (Figure 1B). We confirmed that the KRAS mutations are functional with all codon 12, 13, and 61 mutants exhibiting clear increases in KRAS activity compared with the wild-type KRAS cell lines (Figure 5B). The A146T mutation that is observed in <0.05% of colon cancers had a negligible effect on LIM1215 cell KRAS activity. A lack of correlation between the amount of KRAS activity and effector activation is seen regardless of the presence or absence of coincident mutations (Figure 5C). Similarly, in a wider Luminex-based analysis of Ras network activation, we see that mutation status does not define the coclustered responses, with the exception of pMEK responses in BRAF mutant cells (Figure 5D), and these data reemphasize that cells with KRAS mutations show no general trend of increased signaling. In summary, data generated using the SW48 panel are consistent with a subset of colon cancer cell lines harboring mutant KRAS that also exhibit negligible effector activation in the absence of growth factors despite harboring activated KRAS.
FIGURE 5:
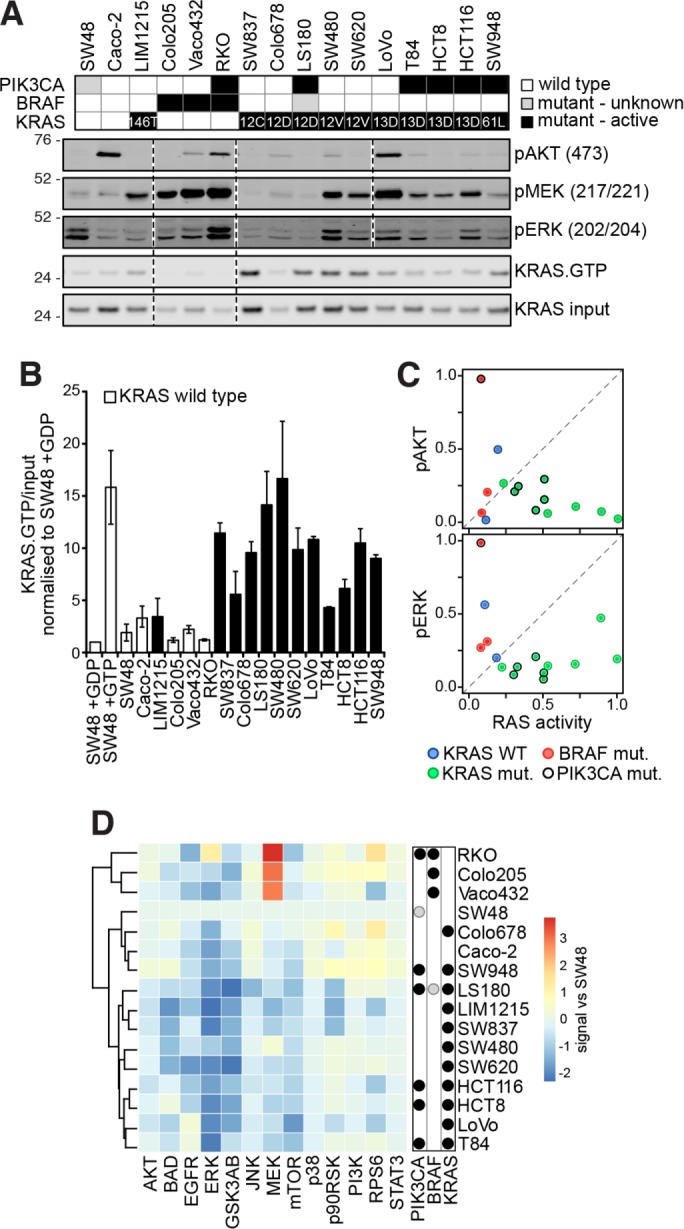
Ras effector activation does not correlate with KRAS mutation status in a panel of colon cancer cells. (A) Mutation status of a representative panel of colorectal cancer cell lines. Representative Western blots from n = 2–4 biological replicates indicate that the presence of an oncogenic mutation is not necessarily leading to activation of effector pathways in the absence of coincident growth factor stimulation. (B) Quantification of KRAS activity measured using a Raf RBD assay (see A for representative blot) indicates that codon 12, 13, and 61 mutant cells contain activated KRAS (mean ± SEM; n = 3). (C) KRAS activity does not correlate with ERK and AKT phosphorylation. (D) Luminex-based measurement of key nodes within the Ras-signaling network reveals that responses do not strictly cocluster based on mutation status. Values are averaged signals from n = 2–6 biological replicates normalized to the SW48 cells. In all experiments, cells were starved for 16 h prior to assaying.
DISCUSSION
Isoform-specific Ras signaling has been inferred from studies of mouse development and cancer mutation frequencies (Koera et al., 1997; Esteban et al., 2001; Prior et al., 2012); however, we still have only a vague understanding of the isoform-specific mechanisms that may underpin this. Classic studies ectopically expressing Ras isoforms suggested clear differences in coupling of RAF and PI3K pathways to Ras isoforms (Yan et al., 1998; Voice et al., 1999; Hobbs et al., 2016). Whereas amplification of Ras is observed in some tumors, it is also true that overexpression can have distorting effects on signaling networks and senescence rather than an oncogenic program is observed in some Ras models (Sarkisian et al., 2007). Isogenic cells provide a useful option for studying variants of endogenous signaling networks without being confounded by differences in the genetic backgrounds of the various cell lines. To date, isogenic cell-based studies have largely focused on comparative analysis of KRAS-mutant versus wild-type Ras cells (Vartanian et al., 2013; Alamo et al., 2015; Stolze et al., 2015). Given the clear evidence for Ras mutation-specific signaling (Burd et al., 2014; Hammond et al., 2015; Winters et al., 2017), we used the same G12V mutation in all three Ras isoforms. This novel cell line panel means that we have been able to perform the first analysis of endogenous isoform-specific Ras signaling in the same genetic background.
A notable initial observation was the general inability of G12V-mutated Ras isoforms to generate enhanced RAF and PI3K pathway signaling outputs compared with the wild-type control (Figure 1B). G12V-mutant Ras displays slow nucleotide exchange and slow GTP hydrolysis (Trahey et al., 1987; Smith et al., 2013), meaning that starvation and stimulation times could significantly influence the amount of active Ras in the cell. However, under the conditions in which we performed the experiments, it was clear that the lack of effector activation was not due to a lack of Ras activation (Supplemental Figure S1A). It is relevant to note that SW48 cells harbor an EGFRG719S mutation that has been observed to promote ligand-independent EGFR kinase activity and Ras effector activation (Greulich et al., 2005) and might be expected to exhibit preexisting engagement of negative feedback pathways. However, we saw no evidence for this under our experimental conditions; all of the isogenic cell lines showed significant EGF stimulatability, effector activation was minimal under serum-starved conditions, and negative feedback was only consistently observed when EGF was added to cells (Supplemental Figure S6).
One potential criticism of our cell model is that the introduction of Ras oncogenic mutations into a wild-type Ras SW48 cell Parental background does not result in Ras addiction that is observed in some cancer cell lines in some contexts. Therefore, the signaling that we are observing may not be equivalent to “true” oncogenic mutant Ras signaling. In fact, DepMap analysis reveals that <30% of 2-D cultured KRAS-mutant cell lines show strongly selective KRAS dependence (Tsherniak et al., 2017). Furthermore, our observation of low levels of effector activation in Ras mutant SW48 cells has been seen before in a range of Ras mutant cancer cells and mouse models (Iida et al., 1999; Yip-Schneider et al., 1999; Giehl et al., 2000; Tuveson et al., 2004; Omerovic et al., 2008; Vartanian et al., 2013). We also observed a disconnect between the presence of activating KRAS or PIK3CA mutations and activation of their effector pathways in a panel of colon cancer cell lines commonly used to study KRAS and cancer biology (Figure 5). Our observations of Ras versus effector activation seen in the wild-type and KRAS-mutant SW48 cells sat well within the range of observations seen within the representative panel of colon cancer cell lines. Together, these argue against any exceptionalism for the isogenic SW48 model and the subtle effects on downstream signaling that are observed in the Ras mutant cells.
Importantly, studies across a wide range of Ras mutant cell models have usually not had access to an equivalent matched wild-type Ras cell line for comparison so it has not generally been obvious that mutations that generate hyperactivated Ras can fail to result in enhanced outputs compared with wild-type Ras. It may be that the chronic trickle of low-level effector activation represents the reality of oncogenic signaling until the acquisition of genetic insults that further dysregulate signaling later in the progression of the cancer. Indeed, this low-level signaling may be important for avoiding pushing the cells into cytotoxic stress, cell death, or senescence (Varmus et al., 2016).
Stimulation with growth factors potently activated Ras effectors (Figures 1 and 2); therefore, the lack of signaling seen in the Ras mutant cells was not due to a complete down-regulation or uncoupling of the Ras network. The second feature of the growth factor stimulation experiments was that Ras isoforms variably display enhanced coupling to the RAF and PI3K pathways (Figure 1D). However, these were not consistent across all growth factor stimulations (Figure 2) and the patterns did not conform to the observations seen in ectopic expression studies where KRAS preferentially coupled to Raf-MAP kinase and HRAS coupled to the PI3K pathway (Yan et al., 1998; Voice et al., 1999). Therefore, the dogma that Ras isoforms consistently favor coupling to a particular Ras pathway is incorrect in this endogenous context and the reality is far more nuanced and subject to growth factor modulation.
Mathematical modeling of the combinatorial treatment data revealed that the core signaling networks are very similar between the Ras isoforms (Figure 3). Nevertheless, there were some significant differences between the Ras isoforms that tended to distinguish the KRAS cell lines from the rest. The most pronounced of these differences was the increased GF-induced pathway activation (Figure 3D). HGF was particularly selective for KRAS-dependent PI3K pathway activation and this observation can be explained by the increased expression of the HGF receptor MET in KRAS-mutant cell lines including both G12V clones (Hammond et al., 2015). Although MET is upstream of KRAS, it has a well-established role in Ras-dependent tumorigenesis that typically involves gene and protein amplification consistent with our observations (Webb et al., 1998; Furge et al., 2001; Xie et al., 2012; Hammond et al., 2015).
Importantly, the modeling did not point to a profound rewiring of the Ras network that could explain the minimal effector activation in the absence of growth factors. Similarly, our experiments to profile where the signaling downstream of Ras might be interrupted revealed no evidence for network rewiring. Instead, they suggested that mutant Ras in serum-starved cells was unable to efficiently activate Raf (Figure 4), arguing that growth factor signaling is required to give competence to Ras activation of this key effector pathway. Insufficiency may arise due to the coordinated regulation of kinases, phosphatases, scaffolds, and cofactors required for Raf-MAPK activation (Figure 4A) (Lavoie and Therrien, 2015). In this context, growth factor receptor engagement of a wider signaling network than Ras could be required to create a permissive state for efficient Ras signaling. We note that ectopic expression studies have shown downstream activation in serum-starved cells when Ras mutants are overexpressed (Yan et al., 1998; Voice et al., 1999). While this could argue against Ras insufficiency, an alternative interpretation is that the higher concentration of Ras in cells is able to overcome the requirement for growth factor signaling to prime the Ras network. Higher Ras concentrations will influence the nanoscale organization of Ras on the plasma membrane and increase the opportunity for dimerization and interactions with effectors (Zhou et al., 2017). Alternative explanations for the requirement for growth factors could include a requirement for SOS recruitment and wild-type Ras engagement (Margarit et al., 2003; Jeng et al., 2012), that alternative effectors may be preferentially bound in the absence of growth factors (Adhikari and Counter, 2018), or that nucleotide cycling within the Ras population may be required for efficient and disease-relevant signaling (Nichols et al., 2018; Ruess et al., 2018).
An important caveat with these studies is the use of a single isogenic cell model system and the potential for cell clonality to confound the observations. To give an indication of potential clonal heterogeneity, we profiled a panel of NRAS clones to identify a representative clone (Supplemental Figure S2) and used more than one KRAS clone throughout our studies. While it is clear that heterogeneity between clones exists, all of the clones conformed to the core observations of minimal effector responses to the presence of mutant Ras and similar substantial context-dependent responses to the presence of different growth factors. We also observe similar mutant KRAS-refractory responses in a representative panel of colon cancer cell lines. While data from a single isogenic system are not definitive, our observations challenge current models and highlight fundamental aspects of Ras biology requiring further understanding.
In summary, we have created an isogenic cell panel that for the first time allows endogenous signaling of all Ras isoforms to be investigated in a common genetic background. The expression of isoform-specific G12V-mutant Ras in the background of five wild-type Ras alleles, all expressed in their native genomic contexts, represents the earliest stage of Ras-driven cancer. The observed limited activation of key effector pathways suggests that endogenous oncogenic Ras signaling relies on costimulatory events or further genetic perturbations to overcome cellular homeostasis mechanisms. These mechanisms are imposed at the earliest points in the effector activation cycle. Differences between Ras isoform outputs were most clearly revealed with concomitant growth factor stimulation where it operated as a subtle but variable nudge on the significant growth factor-induced program. This is likely to be critical in the context of the tumor microenvironment where mutated Ras will operate in the presence of a cocktail of growth factors. Our systematic analysis reveals that the long-held view that Ras isoforms are consistently coupled to particular effector pathways is likely to be oversimplistic and that the context dependence of HRAS, NRAS and KRAS signaling precludes any general predictions of likely pathway activation in response to a specific isoform.
MATERIALS AND METHODS
Reagents
The following inhibitors were used in various assays: AZD6244 (5 µM; MEK; Selleck Chemicals), LY294002 (20 µM; PI3K; Alexis Chemicals), rapamycin (0.15 µM; TOR; Selleck Chemicals), and dasatinib (25 nM; Src; Selleck Chemicals). The solvent control was dimethyl sulfoxide (equal volume to each inhibitor). The following ligands were used (all Peprotech): IGF-1 (50 ng/ml), EGF (15 ng/ml), and HGF (50 ng/ml) with 0.1% bovine serum albumin (BSA) in phosphate-buffered saline as solvent.
Cell lines
Ras mutation sequence verified isogenic SW48 cells were obtained from Horizon Discovery. The clones used were HRASG12V (clone 1), KRASG12V (clone c16 [K1] and clone c48 [K2]). Heterozygous knock-in of NRASG12V (clone G9-1 [N1], clone 7-2 [N2], clone 4-2 [N3], and clone 8-1 [N4]) was generated from homozygous RASWT Parental SW48 cells using AAV-mediated gene editing and sequence verified for the presence of a heterozygous NRAS G12V mutation. SW48 cells were grown in McCoy’s 5A media, supplemented with 10% (vol/vol) FBS, 100 U/ml penicillin, and 100 µg/ml streptomycin (Thermo Fisher Scientific) at 37°C in 5% (vol/vol) CO2. The colon cancer cell panel comprising Caco-2, LIM1215, Colo205, Vaco432, RKO, SW837, Colo678, LS180, SW480, SW620, LoVo, T84, HCT8, HCT116, and SW948 were cultured in DMEM (BE12-707F, Lonza/Biozym), supplemented with 1% Ultraglutamine (BE17-605E/U1, Lonza/Biozym), 100 U/ml penicillin, 100 µg/ml streptomycin (DE17-602E, Lonza/Biozym), and 10% (vol/vol) FBS (P30-1506, PAN Biotech) at 37°C and 5% CO2. Vaco432 cells were obtained from René Bernards’ laboratory (Netherlands Cancer Institute); all other cell lines were from AG Sers Molekulare Tumorpathologie (Charité–Universitätsmedizin Berlin). All cell lines were short tandem repeat-authenticated via Eurofins Genomics. Vaco432 could not be matched, as they were not found in the database. Mycoplasma testing was conducted by Eurofins Genomics.
Starvation of cells was done for 16 h with FBS-free medium, before lysis. Lysis was done with the lysis buffer from the Ras activation assay and protease inhibitors there included. For WB lysates, protease- and phosphatase inhibitors from the Bio-Plex Cell Lysis Kit (Bio-Rad; 171-304012) were used. Protein concentration was determined using the BCA Protein Assay Kit (Pierce; 23227). After SDS–PAGE, proteins were blotted to nitrocellulose membranes and stained with the Pierce Reversible Protein Stain Kit, which was later used for normalization. The following antibodies were used: rabbit anti-pMEK (CST9154), rabbit anti-pAkt T308 (CST9275), rabbit anti-pAkt S473 (CST4060), rabbit anti-pERK (CST4370), and mouse anti-pERK (CST9106). The blots were imaged with Odyssey CLx and infrared-labeled antibodies (all Li-COR). Analysis was done using ImageJ after exporting pictures from ImageStudio (Li-COR).
Luminex assays
Cell lysates were prepared using the Bio-Plex Pro Cell Signaling Reagent Kit (Bio-Rad), according to the manufacturer’s instructions. Briefly, cells seeded into 24-well plates were serum-starved for 24 h and then incubated ± inhibitors in serum-free media for 1 h, followed by a 20-min stimulation ± growth factor in the continued presence of inhibitor. Lysates were measured with a Bio-Plex Protein Array (Bio-Rad, Hercules, CA) as described earlier (Klinger et al., 2013) using magnetic bead-based enzyme-linked immunosorbent assays specific for phospho-AKTS473 (171-V50001M), phospho-c-JunS63 (171-V50003M), phospho-EGFRY1068 (171-V50004M), phospho-ERK1/2T202,Y204/T185,Y187 (171-V50006M), phospho-GSK3A/BS21/S9 (171-V50007M), phospho-IkBaS32,S36 (171-V50010M), phospho-JNKT183,Y185 (171-V50011M), phospho-MEK1S217,S221 (171-V50012M), phospho-mTORS2448 (171-V50033M), phospho-p38T180,Y182 (171-V50014M), phospho-p53S15 (171-V50034M), phospho-PI3KY458 (171-V50036M), phospho-RPS6S235,S236 (171-V50038M), phospho-p90RSKS380 (171-V50035M), phospho-SMAD2S465,S467 (171-V50019M), and phospho-SrcT416 (171-V50039M). The capture antibody-coated beads as well as detection antibodies and the fluorescent conjugate SAPE were diluted 1:3. We used the R package lxb for data acquisition. Statistical testing on excerpts of the luminex assay (i.e., Figure 1D and Supplemental Figure S3) was conducted by applying a one-way analysis of variance (ANOVA) on logarithmized data of each subplot followed by multiple correction testing (Benjamini-Hochberg). For significant findings (false discovery rate [FDR] ≤ 0.05) a post-hoc analysis was conducted (Tukey’s Honestly Significant Difference test) to report adjusted p values for the comparisons of interest.
Model construction and evaluation
The modeling procedure relies on a variant of MRA (Klinger et al., 2013) that quantifies identifiable parameter (combinations) of a given network structure on base of systematic perturbation data. The network structure was derived from available literature and prior modeling approaches of colorectal cancer cell lines (Klinger et al., 2013). Modeling was conducted in the two steps network structure determination and differential signaling detection: 1) Five cell line-specific models were generated based on the literature network choosing the best of 3 × 10⁴ sample runs, observing that the ranked fits converged on the lower end and multiple best fits were found. These data sets were then locally adjusted to the data by determining superfluous links, that is, removal did not significantly decrease the fit (likelihood-ratio test p > 0.05), and missing links, that is, addition, significantly improved the fit (Benjamini-Hochberg corrected p ≤ 0.05) in all five cell lines. Among the extension candidates only those were included for which a biological confirmation could be found in the literature (e.g., PI3K → Raf). 2) The generated consensus network was then used to train a modelset (4 × 10⁴ simulations), which models the individual data sets by a single parameter set. To determine significantly differing parameters, modelset parameters were iteratively relaxed to fit cell line-specific data (i.e., a split up of one parameter into five) in a greedy hill parameter splitting procedure with ensuing reverse lumping procedure (likelihood-ratio test p ≤ 0.05, best of 10³ simulations each).
The holistic model (Supplemental Figure 4) used the found consensus network above but treated Ras mutations as perturbations of the Parental data set, essentially modeling all data sets by one model with nodes of the Ras mutations added and each linked to RAF and PI3K (105 simulations). The model was run on either the whole data set or data sets without stimulations. All modeling steps were conducted using the R package STASNet (Version 1.0.0) available under https://github.com/molsysbio/STASNet38.
Ras activation assay and coimmunoprecipitation
Ras activity assays were performed as described using the Ras Activation Assay Kit (Cytoskeleton; BK008). Briefly, cells were serum-starved for 24 h, before incubation ± 15 ng/ml EGF for 20 min, and lysis and incubation of 300 µg of precleared lysate with 30 μl (100 μg) GST-Raf1-RBD–conjugated sepharose beads for 1 h at 4ºC with rotation. Controls using serum-starved SW48 Parental cell lysates incubated with 1–3 mM GDP (100% inactive Ras) and 200 µM GTPγS (100% active Ras) were included for comparative normalization of cell lines. For coimmunoprecipitation, cell lysates were prepared using NP40 lysis buffer (50 mM Tris–HCl, pH 7.5, 150 mM NaCl, 1% NP40 substitute protease inhibitor cocktail [P8465; Sigma], phosphatase inhibitor cocktail [PhosStop; Roche], and 2 mM NaF). Lysate (1.5 mg) was precleared with protein A–conjugated agarose (Sigma), then incubated with 2 μg BRAF antibody (Santa Cruz; sc-5284) or normal mouse IgG Control (EMD Millipore; 12-371) and 7.5 μl (4.5 mg) Protein A agarose, for 2.5 h. Beads from activity/coprecipitation experiments were washed and then boiled in sample buffer to elute proteins for loading on 4–12% NuPAGE Bis–Tris gels and visualization by Western blotting. The following primary antibodies were used for Western blotting including for experiments measuring isoform-specific Ras activity: rabbit monoclonal pan-RAS (52939) phospho-CRAFS259 (173539; both AbCam), KRAS (Life Span Biosciences LS-C175665), HRAS (sc-520), NRAS (sc-31), BRAF (sc5284), EGFR sc-03; all Santa Cruz), CRAF (9422), phospho-CRAFS289/S296/S301 (9431), phospho-CRAFS338 (9427), MEK (9122), phospho-MEKS217/S221 (9154), ERK (4695), phospho-ERK1/2T202/Y204 (4370), AKT (9272), phospho-AKTS473 (4060), phospho-EGFRY1068 (2234), and actin (6276; all Cell Signaling Technology).
Supplementary Material
Acknowledgments
This work was supported by funding from North West Cancer Research (CR1025), the Wellcome Trust (WT092791), and the German Ministry for Education and Research and grants MapTorNet and ColoSys. We thank Rob Howes and Christine Schofield for help in generating the isogenic cell lines.
Abbreviations used:
- ANOVA
analysis of variance
- BSA
bovine serum albumin
- CV
coefficient of variation
- EGF
epidermal growth factor
- FBS
fetal bovine serum
- HGF
human growth factor
- IGF
insulin-like growth factor
- MRA
modular response analysis
- PI3K
PtdIns 3-kinase
- rAAV
recombinant adeno-associated virus.
Footnotes
This article was published online ahead of print in MBoC in Press (http://www.molbiolcell.org/cgi/doi/10.1091/mbc.E18-10-0676) on February 20, 2019.
REFERENCES
- Adhikari H, Counter CM. (2018). Interrogating the protein interactomes of RAS isoforms identifies PIP5K1A as a KRAS-specific vulnerability. Nat Commun , 3646. [DOI] [PMC free article] [PubMed] [Google Scholar]
- Alamo P, Gallardo A, Di Nicolantonio F, Pavon MA, Casanova I, Trias M, Mangues MA, Lopez-Pousa A, Villaverde A, Vazquez E, et al (2015). Higher metastatic efficiency of KRas G12V than KRas G13D in a colorectal cancer model. FASEB J , 464–476. [DOI] [PubMed] [Google Scholar]
- Burd CE, Liu W, Huynh MV, Waqas MA, Gillahan JE, Clark KS, Fu K, Martin BL, Jeck WR, Souroullas GP, et al (2014). Mutation-specific RAS oncogenicity explains NRAS codon 61 selection in melanoma. Cancer Discov , 1418–1429. [DOI] [PMC free article] [PubMed] [Google Scholar]
- Cox AD, Der CJ. (2011). Ras history: the saga continues. Small Gtpases , 2–27. [DOI] [PMC free article] [PubMed] [Google Scholar]
- De Roock W, Jonker DJ, Di Nicolantonio F, Sartore-Bianchi A, Tu D, Siena S, Lamba S, Arena S, Frattini M, Piessevaux H, et al (2010). Association of KRAS p.G13D mutation with outcome in patients with chemotherapy-refractory metastatic colorectal cancer treated with cetuximab. J Am Med Assoc , 1812–1820. [DOI] [PubMed] [Google Scholar]
- Di Nicolantonio F, Arena S, Gallicchio M, Zecchin D, Martini M, Flonta SE, Stella GM, Lamba S, Cancelliere C, Russo M, et al (2008). Replacement of normal with mutant alleles in the genome of normal human cells unveils mutation-specific drug responses. Proc Natl Acad Sci USA , 20864–20869. [DOI] [PMC free article] [PubMed] [Google Scholar]
- Downward J. (2015). RAS synthetic lethal screens revisited: still seeking the elusive prize? Clin Cancer Res , 1802–1809. [DOI] [PMC free article] [PubMed] [Google Scholar]
- Esteban LM, Vicario-Abejon C, Fernandez-Salguero P, Fernandez-Medarde A, Swaminathan N, Yienger K, Lopez E, Malumbres M, McKay R, Ward JM, et al (2001). Targeted genomic disruption of H-ras and N-ras, individually or in combination, reveals the dispensability of both loci for mouse growth and development. Mol Cell Biol , 1444–1452. [DOI] [PMC free article] [PubMed] [Google Scholar]
- Furge KA, Kiewlich D, Le P, Vo MN, Faure M, Howlett AR, Lipson KE, Woude GF, Webb CP. (2001). Suppression of Ras-mediated tumorigenicity and metastasis through inhibition of the Met receptor tyrosine kinase. Proc Natl Acad Sci USA , 10722–10727. [DOI] [PMC free article] [PubMed] [Google Scholar]
- Giehl K, Skripczynski B, Mansard A, Menke A, Gierschik P. (2000). Growth factor-dependent activation of the Ras-Raf-MEK-MAPK pathway in the human pancreatic carcinoma cell line PANC-1 carrying activated K-ras: implications for cell proliferation and cell migration. Oncogene , 2930–2942. [DOI] [PubMed] [Google Scholar]
- Greulich H, Chen TH, Feng W, Janne PA, Alvarez JV, Zappaterra M, Bulmer SE, Frank DA, Hahn WC, Sellers WR, Meyerson M. (2005). Oncogenic transformation by inhibitor-sensitive and -resistant EGFR mutants. PLoS Med , 1167–1176. [DOI] [PMC free article] [PubMed] [Google Scholar]
- Haigis KM, Kendall KR, Wang Y, Cheung A, Haigis MC, Glickman JN, Niwa-Kawakita M, Sweet-Cordero A, Sebolt-Leopold J, Shannon KM, et al (2008). Differential effects of oncogenic K-Ras and N-Ras on proliferation, differentiation and tumor progression in the colon. Nat Genet , 600–608. [DOI] [PMC free article] [PubMed] [Google Scholar]
- Hammond DE, Mageean CJ, Rusilowicz EV, Wickenden JA, Clague MJ, Prior IA. (2015). Differential reprogramming of isogenic colorectal cancer cells by distinct activating KRAS mutations. J Proteome Res , 1535–1546. [DOI] [PMC free article] [PubMed] [Google Scholar]
- Hobbs GA, Der CJ, Rossman KL. (2016). RAS isoforms and mutations in cancer at a glance. J Cell Sci , 1287–1292. [DOI] [PMC free article] [PubMed] [Google Scholar]
- Ihle NT, Byers LA, Kim ES, Saintigny P, Lee JJ, Blumenschein GR, Tsao A, Liu SY, Larsen JE, Wang J, et al (2012). Effect of KRAS oncogene substitutions on protein behavior: Implications for signaling and clinical outcome. J Natl Cancer Inst , 228–239. [DOI] [PMC free article] [PubMed] [Google Scholar]
- Iida M, Towatari M, Nakao A, Iida H, Kiyoi H, Nakano Y, Tanimoto M, Saito H, Naoe T. (1999). Lack of constitutive activation of MAP kinase pathway in human acute myeloid leukemia cells with N-Ras mutation. Leukemia , 585–589. [DOI] [PubMed] [Google Scholar]
- Jeng HH, Taylor LJ, Bar-Sagi D. (2012). Sos-mediated cross-activation of wild-type Ras by oncogenic Ras is essential for tumorigenesis. Nat Commun , 1168. [DOI] [PMC free article] [PubMed] [Google Scholar]
- Kim JS, Lee C, Foxworth A, Waldman T. (2004). B-Raf is dispensable for K-Ras-mediated oncogenesis in human cancer cells. Cancer Res , 1932–1937. [DOI] [PubMed] [Google Scholar]
- Klinger B, Sieber A, Fritsche-Guenther R, Witzel F, Berry L, Schumacher D, Yan Y, Durek P, Merchant M, Schafer R, et al (2013). Network quantification of EGFR signaling unveils potential for targeted combination therapy. Mol Syst Biol , 673. [DOI] [PMC free article] [PubMed] [Google Scholar]
- Koera K, Nakamura K, Nakao K, Miyoshi J, Toyoshima K, Hatta T, Otani H, Aiba A, Katsuki M. (1997). K-ras is essential for the development of the mouse embryo. Oncogene , 1151–1159. [DOI] [PubMed] [Google Scholar]
- Lavoie H, Therrien M. (2015). Regulation of RAF protein kinases in ERK signalling. Nat Rev Mol Cell Biol , 281–298. [DOI] [PubMed] [Google Scholar]
- Margarit SM, Sondermann H, Hall BE, Nagar B, Hoelz A, Pirruccello M, Bar-Sagi D, Kuriyan J. (2003). Structural evidence for feedback activation by Ras-GTP of the Ras-specific nucleotide exchange factor SOS. Cell , 685–695. [DOI] [PubMed] [Google Scholar]
- Nichols RJ, Haderk F, Stahlhut C, Schulze CJ, Hemmati G, Wildes D, Tzitzilonis C, Mordec K, Marquez A, Romero J, et al (2018). RAS nucleotide cycling underlies the SHP2 phosphatase dependence of mutant BRAF-, NF1-and RAS-driven cancers. Nat Cell Biol , 1064–1073. [DOI] [PMC free article] [PubMed] [Google Scholar]
- Omerovic J, Hammond DE, Clague MJ, Prior IA. (2008). Ras isoform abundance and signalling in human cancer cell lines. Oncogene , 2754–2762. [DOI] [PMC free article] [PubMed] [Google Scholar]
- Potenza N, Vecchione C, Notte A, De Rienzo A, Rosica A, Bauer L, Affuso A, De Felice M, Russo T, Poulet R, et al (2005). Replacement of K-Ras with H-Ras supports normal embryonic development despite inducing cardiovascular pathology in adult mice. EMBO Rep , 432–437. [DOI] [PMC free article] [PubMed] [Google Scholar]
- Prior IA, Lewis PD, Mattos C. (2012). A comprehensive survey of Ras mutations in cancer. Cancer Res , 2457–2467. [DOI] [PMC free article] [PubMed] [Google Scholar]
- Pylayeva-Gupta Y, Grabocka E, Bar-Sagi D. (2011). RAS oncogenes: weaving a tumorigenic web. Nat Rev Cancer , 761–774. [DOI] [PMC free article] [PubMed] [Google Scholar]
- Ruess DA, Heynen GJ, Ciecielski KJ, Ai JY, Berninger A, Kabacaoglu D, Gorgulu K, Dantes Z, Wormann SM, Diakopoulos KN, et al (2018). Mutant KRAS-driven cancers depend on PTPN11/SHP2 phosphatase. Nat Med , 954–960. [DOI] [PubMed] [Google Scholar]
- Sarkisian CJ, Keister BA, Stairs DB, Boxer RB, Moody SE, Chodosh LA. (2007). Dose-dependent oncogene-induced senescence in vivo and its evasion during mammary tumorigenesis. Nat Cell Biol , 493–505. [DOI] [PubMed] [Google Scholar]
- Shirasawa S, Furuse M, Yokoyama N, Sasazuki T. (1993). Altered growth of human colon cancer cell lines disrupted at activated Ki-ras. Science , 85–88. [DOI] [PubMed] [Google Scholar]
- Smith MJ, Neel BG, Ikura M. (2013). NMR-based functional profiling of RASopathies and oncogenic RAS mutations. Proc Natl Acad Sci USA , 4574–4579. [DOI] [PMC free article] [PubMed] [Google Scholar]
- Stolze B, Reinhart S, Bulllinger L, Frohling S, Scholl C. (2015). Comparative analysis of KRAS codon 12, 13, 18, 61, and 117 mutations using human MCF10A isogenic cell lines. Sci Rep , 8535. [DOI] [PMC free article] [PubMed] [Google Scholar]
- Trahey M, Milley RJ, Cole GE, Innis M, Paterson H, Marshall CJ, Hall A, McCormick F. (1987). Biochemical and biological properties of the human N-ras p21 protein. Mol Cell Biol , 541–544. [DOI] [PMC free article] [PubMed] [Google Scholar]
- Tsherniak A, Vazquez F, Montgomery PG, Weir BA, Kryukov G, Cowley GS, Gill S, Harrington WF, Pantel S, Krill-Burger JM, et al (2017). Defining a cancer dependency map. Cell , 564–576.e516. [DOI] [PMC free article] [PubMed] [Google Scholar]
- Tuveson DA, Shaw AT, Willis NA, Silver DP, Jackson EL, Chang S, Mercer KL, Grochow R, Hock H, Crowley D, et al (2004). Endogenous oncogenic K-ras(G12D) stimulates proliferation and widespread neoplastic and developmental defects. Cancer Cell , 375–387. [DOI] [PubMed] [Google Scholar]
- Varmus H, Unni AM, Lockwood WW. (2016). How cancer genomics drives cancer biology: does synthetic lethality explain mutually exclusive oncogenic mutations? Cold Spring Harb Symp Quant Biol , 247–255. [DOI] [PubMed] [Google Scholar]
- Vartanian S, Bentley C, Brauer MJ, Li L, Shirasawa S, Sasazuki T, Kim JS, Haverty P, Stawiski E, Modrusan Z, et al (2013). Identification of mutant KRas-dependent phenotypes using a panel of isogenic cell lines. J Biol Chem , 2403–2413. [DOI] [PMC free article] [PubMed] [Google Scholar]
- Voice JK, Klemke RL, Le A, Jackson JH. (1999). Four human ras homologs differ in their abilities to activate Raf-1, induce transformation, and stimulate cell motility. J Biol Chem , 17164–17170. [DOI] [PubMed] [Google Scholar]
- Webb CP, Taylor GA, Jeffers M, Fiscella M, Oskarsson M, Resau JH, Vande Woude GF. (1998). Evidence for a role of Met-HGF/SF during Ras-mediated tumorigenesis/metastasis. Oncogene , 2019–2025. [DOI] [PubMed] [Google Scholar]
- Winters IP, Chiou SH, Paulk NK, McFarland CD, Lalgudi PV, Ma RK, Lisowski L, Connolly AJ, Petrov DA, Kay MA, Winslow MM. (2017). Multiplexed in vivo homology-directed repair and tumor barcoding enables parallel quantification of Kras variant oncogenicity. Nat Commun , 2053. [DOI] [PMC free article] [PubMed] [Google Scholar]
- Xie T, G DA, Lamb JR, Martin E, Wang K, Tejpar S, Delorenzi M, Bosman FT, Roth AD, Yan P, et al (2012). A comprehensive characterization of genome-wide copy number aberrations in colorectal cancer reveals novel oncogenes and patterns of alterations. PLoS One , e42001. [DOI] [PMC free article] [PubMed] [Google Scholar]
- Yan J, Roy S, Apolloni A, Lane A, Hancock JF. (1998). Ras isoforms vary in their ability to activate Raf-1 and phosphoinositide 3-kinase. J Biol Chem , 24052–24056. [DOI] [PubMed] [Google Scholar]
- Yip-Schneider MT, Lin A, Barnard D, Sweeney CJ, Marshall MS. (1999). Lack of elevated MAP kinase (Erk) activity in pancreatic carcinomas despite oncogenic K-ras expression. Int J Oncol , 271–279. [DOI] [PubMed] [Google Scholar]
- Yun J, Rago C, Cheong I, Pagliarini R, Angenendt P, Rajagopalan H, Schmidt K, Willson JK, Markowitz S, Zhou S, et al (2009). Glucose deprivation contributes to the development of KRAS pathway mutations in tumor cells. Science , 1555–1559. [DOI] [PMC free article] [PubMed] [Google Scholar]
- Zhou Y, Prakash P, Gorfe AA, Hancock JF. (2017). Ras and the plasma membrane: a complicated relationship. Cold Spring Harb Perspect Med , a031831. [DOI] [PMC free article] [PubMed] [Google Scholar]
Associated Data
This section collects any data citations, data availability statements, or supplementary materials included in this article.