

Abstract
Mitochondria are essential and dynamic organelles undergoing constant fission and fusion. The primary players in mitochondrial morphology (MFN1/2, OPA1, DRP1) have been identified, but their mechanism(s) of regulation are still being elucidated. ARL2 is a regulatory GTPase that has previously been shown to play a role in the regulation of mitochondrial morphology. Here we demonstrate that ELMOD2, an ARL2 GTPase-activating protein (GAP), is necessary for ARL2 to promote mitochondrial elongation. We show that loss of ELMOD2 causes mitochondrial fragmentation and a lower rate of mitochondrial fusion, while ELMOD2 overexpression promotes mitochondrial tubulation and increases the rate of fusion in a mitofusin-dependent manner. We also show that a mutant of ELMOD2 lacking GAP activity is capable of promoting fusion, suggesting that ELMOD2 does not need GAP activity to influence mitochondrial morphology. Finally, we show that ELMOD2, ARL2, Mitofusins 1 and 2, Miros 1 and 2, and mitochondrial phospholipase D (mitoPLD) all localize to discrete, regularly spaced puncta along mitochondria. These results suggest that ELMOD2 is functioning as an effector downstream of ARL2 and upstream of the mitofusins to promote mitochondrial fusion. Our data provide insights into the pathway by which mitochondrial fusion is regulated in the cell.
INTRODUCTION
Mitochondria are vital for a variety of cellular functions in all eukaryotes. Best known is the generation of ATP, but they are also involved in maintenance of calcium levels, lipid metabolism, apoptosis, and cell signaling. Mitochondria are highly dynamic organelles capable of changing overall morphology from small spheres to highly connected, branched networks, and anywhere in between, as a result of changes in the rate of mitochondrial fission and fusion (Campello and Scorrano, 2010). These changes are highly correlated with altered mitochondrial functions, such as regulation of ATP production, apoptosis, and mitophagy (Frank et al., 2001; Tanaka et al., 2010; Gomes et al., 2011; Mishra et al., 2014).
Known key proteins involved in control of mitochondrial morphology are MFN1/2 (mitofusin 1 and 2), OPA1 (optic atrophy 1), and DRP1 (dynamin-related protein 1). MFN1/2 are essential for outer mitochondrial membrane (OMM) fusion by tethering apposing mitochondria (Chen et al., 2003; Eura, 2003; Koshiba et al., 2004). MFN1/2 are large GTPases that localize to the OMM, and their activity is dependent on their oligomerization both cis (within the same mitochondrion) and trans (across mitochondria; Rojo et al., 2002; Koshiba et al., 2004). OPA1 is necessary for inner mitochondrial membrane (IMM) fusion (Zanna et al., 2008). Conversely, DRP1 is required for mitochondrial fission (Smirnova et al., 2001). While roles for each of these large GTPases in mitochondrial biology are established, their mechanisms of action and their regulation are incompletely understood.
ARL2 (ARF-like 2) is an ancient, very highly conserved, ubiquitously expressed, small regulatory GTPase within the ARF superfamily (McElver et al., 2000; Radcliffe et al., 2000; Antoshechkin and Han, 2002; Watzlich et al., 2013). ARL2 localizes to the cytosol, centrosomes, nucleus, and mitochondria. Previous work has shown that cytosolic ARL2 is bound to the tubulin-specific cochaperone cofactor D and is capable of regulating the biogenesis of αβ-tubulin (Tian et al., 2010; Francis et al., 2017a,b). In the nucleus, ARL2 is proposed to play a role in the regulation of STAT3 signaling (Muromoto et al., 2008). ARL2 has also been implicated in the transport of N-myristoylated protein cargos to the primary cilium (Ismail et al., 2011; Watzlich et al., 2013).
ARL2 is the only member of the ARF or RAS superfamily shown to function inside mitochondria. We have previously shown that alterations in ARL2 activity affect the morphology, motility, and energy metabolism of mitochondria. Expression of a dominant negative ARL2 mutant (ARL2[T30N]) causes mitochondrial fragmentation and perinuclear clustering (Newman et al., 2014). Conversely, expression of a dominant active ARL2 mutant (ARL2[Q70L]) causes mitochondrial elongation as a result of an increase in the rate of fusion (Newman et al., 2017a). ARL2 small interfering RNA (siRNA) also causes fragmentation, reduction of cellular ATP to <50% of controls, and ultimately cell death (Newman et al., 2014). Other data reveal that ARL2 regulates mitochondrial fusion specifically from the IMS, upstream of the MFNs, and that ARL2 and MFN1/2 localize to puncta that display the same periodicity in spacing along mitochondria (Newman et al., 2017a).
Like all regulatory GTPases, ARL2 activity is predicted to be controlled by the actions of guanine-nucleotide exchange factors (GEFs) and GTPase-activating proteins (GAPs). Additionally, effectors are the immediate downstream targets of regulatory GTPases that preferentially bind to the activated form to initiate biological responses; consequently, they have been the first focus in studies of GTPase-regulated pathways. In the ARF family, GAPs consistently have been found to have effector functions (East and Kahn, 2011), further highlighting their importance. ELMOD2 was purified in our lab based on its ARL2 GAP activity and found to be a member of a protein family with three members in humans (Bowzard et al., 2007). ELMOD2 localizes to mitochondria, the ER, and lipid droplets (East et al., 2012; Newman et al., 2014; Suzuki et al., 2015).
There are several parallels between ARL2 and ELMOD2. ELMOD2 is the only ELMOD protein that localizes to mitochondria (Newman et al., 2014), and ARL2 is the only ARF family member (out of ∼30 in mammals) similarly found inside mitochondria. Like ARL2 siRNA, ELMOD2 siRNA causes mitochondrial fragmentation and perinuclear clustering (Newman et al., 2014). Like ARL2, ELMOD2 is ancient—predicted to be present in the last eukaryotic common ancestor (East et al., 2012). The fact that we earlier purified ELMOD2 based on its ability to promote hydrolysis of GTP bound to ARL2 and can reconstitute this activity with purified components demonstrates that the two proteins bind directly to each other. Finally, we previously demonstrated that ARL2 mitochondrial staining intensity changes as a result of various growth conditions and stressors and that mitochondrial ELMOD2 follows the same trends (Newman et al., 2017b). These similarities between ARL2 and ELMOD2 led us to study the potential role of ELMOD2 in mitochondria further.
RESULTS
Knockout of ELMOD2 causes mitochondrial fragmentation
We previously demonstrated that knockdown of human ELMOD2 in HeLa cells, using siRNAs, results in mitochondrial fragmentation (Newman et al., 2014). However, knockdown via siRNA is inherently incomplete and transient. To test the effect of complete loss of ELMOD2, we generated clonal ELMOD2-null lines using CRISPR-Cas9 in immortalized mouse embryonic fibroblasts (MEFs). As described in detail under Materials and Methods, we used two different guide RNAs to generate indels in exons encoding ELMOD2, near the N-terminus, that would result in frame-shifting mutations in both alleles. Screening for indels was done by DNA sequencing. For simplicity’s sake, we will refer to these lines as nulls, recognizing the possibility that a short (77 amino acids or fewer) N-terminal fragment, completely lacking the ELMO domain, may be expressed, and could exert a cellular effect. We generated 10 ELMOD2-null lines, one heterozygous line (only one allele frameshifted), and three clonal wild-type (WT) lines (or lines that went through the CRISPR transfection and cloning process but were found to have no mutations at the predicted guide cut site). Our prediction, based on earlier siRNA data, was that ELMOD2-null MEFs would display fragmented mitochondria.
We scored mitochondrial morphology in our null and both clonal and parental WT MEFs (Figure 1, A and B). In all WT MEF lines, the vast majority of cells have mitochondria with a predominantly tubular morphology (average of all four WT lines = 87%). In these lines, only a small proportion of cells display mitochondria that appear short (average = 6%), fragmented (average = 2%), or elongated (average = 5%). We define mitochondrial fragmentation as mitochondria appearing predominantly as large puncta and lacking in tubulation, whereas short mitochondria are tubular, but clearly shorter than control tubular mitochondria. Cells displaying mitochondria that are longer and even more tubulated than the bulk of cells were classed as elongated. Although other mitochondrial shapes have been reported, such as circular mitochondria or mitochondria that appear as doughnuts, we did not consistently observe these morphologies. The mitochondria in the sole ELMOD2 heterozygous line were similar to those observed in WT lines, with only a modest increase in the proportion of cells with short mitochondria (15% compared with 6% in WT lines). Across the ELMOD2-null lines, mitochondrial morphology was far more variable, but consistently displayed much higher levels of fragmentation. Mitochondrial morphology appeared short in 14–42% of cells (average of all 10 lines = 28%), while the proportion of cells with fragmented mitochondria varied even more widely at 9–71% (average of all lines = 30%). On the average, only 42% of ELMOD2-null cells showed mitochondria with a tubular morphology, down from the 87% seen in WT lines. Conversely, mitochondria were short or fragmented in 58% of ELMOD2-null lines (averages across all 10 lines), while the average proportion of WT lines with short or fragmented mitochondria was only 8%. Thus, despite this clonal variability, there was a marked increase in the percentages of cells displaying less tubular and shorter or more fragmented mitochondria in cells lacking ELMOD2.
FIGURE 1:

Knockout of ELMOD2 causes mitochondrial fragmentation. Three WT, one heterozygous ELMOD2+/–, and ten homozygous frameshifted ELMOD2-null immortalized MEF lines were generated by CRISPR. From this collection, two WT, the one ELMOD2+/– (het), and four ELMOD2–/– (null) lines were each transduced with lentivirus expressing GFP (negative control) or mouse ELMOD2-myc, as described under Materials and Methods. (A) Cells were fixed 24 h after plating and stained for HSP60. HSP60 staining of one representative WT (clone #1) is shown. For ELMOD2-null clone #6, two cells are pictured to demonstrate both the fragmented and short mitochondrial morphologies observed in ELMOD2-null lines. These same WT and ELMOD2-null lines were also transduced with lentivirus to direct expression of ELMOD2-myc, treated the same, and imaged. 2D maximal intensity projections of z-stacks are shown. Scale bar = 10 μm. (B) All of the cell lines generated by CRISPR were fixed and stained for HSP60 and scored for the presence of fragmented, short, tubular, or elongated mitochondria. N = 100 cells per condition. The bars on the far right section show average values across all WT MEFs and across all ELMOD2-null MEFs. Error bars represent SEM of three independent experiments. (C) Each of the cell lines transduced with lentivirus expressing ELMOD2-myc was fixed and stained for both HSP60 and the myc epitope and scored for the presence of fragmented, short, tubular, or elongated mitochondria. N = 100 cells per condition. The bars on the far right show average values across both WT MEFs expressing ELMOD-myc and across all ELMOD2-null MEFs expressing ELMOD2-myc. Error bars represent SEM of three independent experiments.
To confirm that the mitochondrial fragmentation observed in the ELMOD2-null lines results from the loss of ELMOD2 rather than an off-target effect(s), we reintroduced ELMOD2 into four of these lines (two from each of two guides) by lentiviral transduction to express mouse ELMOD2 carrying a myc epitope at the C-terminus (ELMOD2-myc; Figure 1, A and C). Expression of ELMOD2-myc resulted in a consistent reversal of the mitochondrial fragmentation, with the mitochondrial morphology in transduced cells appearing almost identical to those in WT cells. The proportion of cells with fragmented mitochondria dropped from an average of 28% to an average of 10%, while the fraction with short mitochondria decreased from an average of 30% to an average of 9%. Conversely, tubular mitochondria increased from 42% to 76%. In marked contrast, expression of ELMOD2-myc in the parental WT, one of the clonal WTs, or the ELMOD2 heterozygous line had little to no effect on mitochondrial morphology. Thus, levels of ELMOD2 activity increased over that found in WT cells do not appear to alter mitochondrial morphologies, while expression of ELMOD2-myc reverses these effects of deletion on mitochondrial morphology. All together, these results are in agreement with, and go well beyond, the previously published data showing that loss of ELMOD2 leads to mitochondrial fragmentation. In addition, the availability of ELMOD2-null MEFs allowed us to monitor other aspects of ARL2 and ELMOD2 in homogeneous cell populations, not readily achieved via siRNA.
Loss of ELMOD2 reduces the rate of mitochondrial fusion
The mitochondrial fragmentation observed in ELMOD2-null lines may be caused by an increase in fission, a decrease in fusion, or some combination of the two. To begin to address this, we employed a previously established (Karbowski et al., 2004, 2014; Zunino et al., 2009) assay for mitochondrial fusion by coexpressing a mitochondria-targeted photoactivatable GFP (mito-PAGFP) with a photostable mitochondrial marker (mito-DsRed; Karbowski et al., 2014). Photoactivation of a small region of interest (4 µm diameter; circles in Figure 2A), was followed by monitoring the spread of the activated GFP (green) over a 40-min window and is expressed as the percentage increase in pixels having signal from both fluors (green and red; Figure 2B). Because the activated-GFP signal is inside the mitochondrial matrix, it requires mitochondrial fusion to spread throughout the mitochondrial network.
FIGURE 2:

Loss of ELMOD2 decreases mitochondrial fusion. (A) Two WT lines, two ELMOD2-null lines, two ELMOD2-null lines expressing mouse ELMOD2-myc (one of each is shown), and MFN2-null MEFs (unpublished data) were cotransfected with mito-DsRed and mito-PAGFP. After 24 h, cells were photoactivated in the ROI shown and imaged every 10 min over a period of 40 min, as described under Materials and Methods. Merged images of the mito-PAGFP signal (green) and mito-DsRed signal (red) are shown on the left, while the mito-PAGFP signal alone (gray) is shown on the right. Single z-planes are shown. Scale bar = 10 μm. (B) The percentage of pixels positive for both red and green signal was quantified at each time point, and the increase in overlap (relative to the 0-min time point after photoactivation) is graphed, as a measure of mitochondrial fusion. N = 10 cells per condition. Error bars represent SEM. Single and double asterisks indicate statistically significant differences at p < 0.05 and p < 0.01, respectively.
Figure 2A shows examples of cells imaged during this assay; including WT, ELMOD2-null, and an ELMOD2-null line expressing ELMOD2-myc. By visual inspection, it is clear both that there is much less spreading of the activated GFP in the ELMOD2-null line than with WT cells at the 40-min time point shown and that this is reversed upon expression of ELMOD2-myc. The results from two different clones from each of the conditions shown in Figure 2A were quantified and the results averaged (Figure 2B). We carried out the same analysis on MFN2-null MEFs, which have well-documented defects in mitochondrial fusion (Chen et al., 2003) and were predicted to yield a strong effect on fusion. Loss of ELMOD2 had an effect on mitochondrial fusion comparable to that of loss of MFN2 (Figure 2B), consistent with each protein playing a role in fusion. This defect in fusion seen in the ELMOD2-null MEFs was largely reversed by expression of ELMOD2-myc, again arguing that these effects result from the loss of ELMOD2, rather than off-target effects.
Expression of ELMOD2 partially reverses mitochondrial fragmentation in MFN1- and MFN2-null MEFs
MEFs lacking MFN1 or MFN2 typically have a fragmented mitochondrial morphology, in contrast with WT MEFs, which display more tubular mitochondria (Chen et al., 2003; Figure 3A). We previously demonstrated that overexpression of ARL2 led to a partial reversal of this fragmented phenotype in MFN nulls. This reversal was even more marked in response to expression of the dominant activating mutant ARL2[Q70L] (Newman et al., 2017a). Because ELMOD2 is an ARL2 GAP that also localizes to mitochondria and loss of ELMOD2 leads to mitochondrial fragmentation (Newman et al., 2014; Figure 1), we asked whether increased expression of ELMOD2 can also reverse, in whole or part, the fragmentation resulting from the loss of mitofusins.
FIGURE 3:
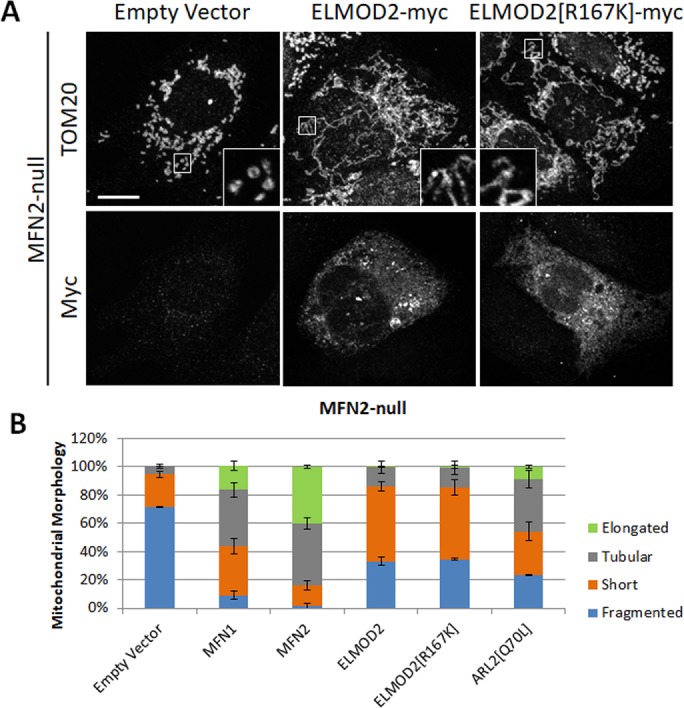
Expression of ELMOD2 or ELMOD2[R167K] partially reverses mitochondrial fragmentation in MFN2-null MEFs. (A) MFN2-null MEFs were transfected with pcDNA3.1 (empty vector, left), mouse ELMOD2-myc/DDK (middle), or mouse ELMOD2[R167K]-myc/DDK (right). Cells were fixed 24 h after transfection and costained for TOM20 (top) and myc (bottom), as described under Materials and Methods. 2D projections of z-stacks are shown. Scale bar = 10 μm. (B) MFN2-null MEFs were transfected with pcDNA3.1, MFN1-myc, MFN2-myc, ELMOD2-myc/DDK, ELMOD2[R167K]-myc/DDK, or ARL2[Q70L] and fixed 24 h after transfection. Transfected cells were scored for the presence of fragmented, short, tubular, or elongated mitochondria. N = 200 cells per condition across two independent experiments. Error bars represent SEM.
We began testing effects of ELMOD2 overexpression using the human ELMOD2, as it had been used in our previous biochemical analyses (Bowzard et al., 2007; East et al., 2012) and human and mouse ELMOD2 share 87% identity in primary sequence. However, we found that human ELMOD2 contains a high percentage of rare codons (53%), compared with mouse ELMOD2 (15%), which may contribute to its low levels of expression (Supplemental Figure S1A). A direct comparison of human and mouse ELMOD2-myc under the same promoter revealed that mouse ELMOD2-myc achieved substantially higher expression levels than the human protein in MEFs (Supplemental Figure S1B). We did not pursue the cause of this difference, but codon bias is a reasonable explanation (Clarke and Clark, 2008). Also, because we were rescuing knockout of ELMOD2 in mouse cells, we used mouse ELMOD2-myc for studies involving protein overexpression, though we note that expression of human ELMOD2-myc yielded almost identical results.
MFN2-null MEFs were transfected with a plasmid directing expression of mouse ELMOD2-myc, mouse ELMOD2[R167K]-myc, or empty vector, and effect(s) on mitochondrial morphology were scored after 24 h (Figure 3). MFN2-null MEFs that were not transfected or transfected with the empty vector predominantly (72%) showed a fragmented mitochondrial morphology, with the majority of the remainder (23%) having short mitochondria and only a small portion (5%) of cells having tubular mitochondria. We included expression of MFN1-myc or MFN2-myc as positive controls, as they are predicted to yield the strongest rescue. As expected, expression of either mitofusin led to a dramatic reversal of mitochondrial fragmentation, especially expression of MFN2-myc which decreased the proportion of cells with fragmented mitochondria to 1%. The majority of the MFN2-null MEFs expressing MFN2-myc were tubular (44%) or elongated (40%). Although the effect of ELMOD2-myc expression was not as complete as expression of the mitofusins, the effect was still quite strong. The majority of MFN2-null MEFs expressing ELMOD2-myc displayed mitochondria with a short tube morphology (53%), with a smaller percentage (14%) displaying a tubular morphology similar to the typical shape observed in WT MEFs. Only 33% of MFN2-null cells expressing ELMOD2-myc have fragmented mitochondria, down from 72% in empty vector controls.
All ARF family GAPs to date also demonstrate effector functions (East and Kahn, 2011), so we tested whether this holds true also for ELMOD2 and its effects on mitochondrial morphology. The two strongest ways to differentiate between a protein acting as a GAP versus an effector are to 1) mutate the essential catalytic arginine residue in the GAP domain that renders it unable to stimulate GTP hydrolysis with retention of binding to the GTPase or 2) test whether knockdown/-out of the GAP results in increased or decreased signaling. If acting as a “pure” GAP, the arginine mutant or decrease in protein expression should increase signal output, while if acting as an effector, expression of the arginine mutant typically should have no effect, but total loss of the GAP/effector should lose signal output. The ELMOD2[R167K] mutant lacks the catalytic arginine previously shown to be necessary for GAP activity (East et al., 2012). Although ELMOD2[R167K] lacks GAP activity, it remains stable and, in fact, expresses to higher levels than ELMOD2-myc (Supplemental Figure S3). ELMOD2[R167K]-myc expression in MFN2-null MEFs resulted in partial reversal of mitochondrial fragmentation, which was quantified and found to be virtually identical to the effects observed following expression of ELMOD2-myc (Figure 3). Thus, the ability of ELMOD2-myc to partially rescue mitochondrial morphology in MFN2-null MEFs does not depend on its GAP activity, consistent with an effector functionality.
We also included expression of ARL2[Q70L] for comparison. As previously reported (Newman et al., 2017a), expression of ARL2[Q70L] partially reversed the mitochondrial fragmentation phenotype in these MEFs. The effect of this dominant mutant appears to be somewhat stronger than that of ELMOD2-myc. In MFN2-null cells expressing ARL2[Q70L], a lower proportion of cells displayed fragmented or short mitochondria (24% and 31%, respectively) compared with those expressing ELMOD2-myc, while a larger proportion had tubular (37%) or even elongated mitochondria (9%).
ELMOD2-myc expression also partially reversed mitochondrial fragmentation resulting from the deletion of MFN1 (Supplemental Figure S2). Almost all MFN1-null MEFs under control conditions contained fragmented mitochondria (93%). Again, expression of the mitofusins led to the most pronounced reversal of mitochondrial fragmentation, particularly MFN1-myc expression. MFN1-null MEFs expressing MFN1-myc had predominantly tubular (54%) mitochondria, and only a very small fraction were fragmented (4%). The remainder of the population had short (27%) or elongated (15%) mitochondria. Expression of ELMOD2-myc resulted in a large fraction of cells displaying mitochondria with a short tube phenotype (59%) and a small fraction displaying a tubular morphology (9%). These results are similar to those in MFN2-null MEFs, although there are slightly fewer ELMOD2-myc–expressing MFN1-null cells with a tubular mitochondrial morphology. Again, expression of ELMOD2[R167K]-myc resulted in the same degree of fragmentation reversal as ELMOD2-myc expression. ARL2[Q70L] also partially reversed fragmentation in these MEFs, but to a lesser extent than with MFN2-null MEFs.
We next tested the effect of ELMOD2-myc expression in MEFs null for both MFN1 and MFN2—hereafter termed DKO (double knockout) MEFs. The mitochondrial morphology in these MEFs is highly fragmented under normal culture conditions (Chen et al., 2003). Expression of either MFN1 or MFN2 partially reversed this fragmentation. However, expression of ELMOD2-myc or ELMOD2[R167K]-myc had no noticeable effect on the mitochondrial morphology of DKO MEFs (Figure 4, A and D). These results are the same as those previously reported for ARL2 (Newman et al., 2017a). Thus, like ARL2, ELMOD2 requires the presence of at least one mitofusin to mediate its effects on mitochondrial morphology. Expression of either ELMOD2-myc, ELMOD2[R167K]-myc, or ARL2[Q70L] also had no effect on the mitochondrial morphology of OPA1-null MEFs (Figure 4, B and D). This inability to reverse mitochondrial fragmentation is unlikely to be due to differences in expression levels, as ELMOD2-myc expressed to similar levels in each cell line tested (Supplemental Figure S3). Expression of ELMOD2-myc or ELMOD2[R167K]-myc in WT MEFs had no evident effect on mitochondrial morphology aside from a very modest increase in the fraction of cells with short mitochondria. This is in contrast to expression of either of the mitofusins or ARL2[Q70L], which results in mitochondrial elongation (Figure 4C). This result is also consistent with ELMOD2 acting as an effector of ARL2, as it is not uncommon for an activated, regulatory GTPase to have a stronger phenotype than overexpression of its effector.
FIGURE 4:

Expression of ELMOD2 or ELMOD2[R167K] does not affect the morphology of MFN DKO, OPA1-null, or WT MEFs. (A) MFN DKO MEFs were transfected with pcDNA3.1 (empty vector), MFN1-myc, MFN2-myc, mouse ELMOD2-myc/DDK, mouse ELMOD2[R167K]-myc/DDK, or ARL2[Q70L]. Cells were fixed 24 h after transfection and costained for myc and TOM20 or ARL2 and TOM20. Transfected cells were then scored for the presence of fragmented, short, tubular, or elongated mitochondria. N = 100 cells per condition. Error bars represent SEM of two independent experiments. (B) Same as A except that OPA1-null MEFs were transfected and OPA1-myc/his was used in place of MFN1-myc and MFN2-myc. (C) Same as A except that WT MEFs were transfected. (D) OPA1-null MEFs (left) and DKO MEFs (right) were transfected with pcDNA3.1 (empty vector) or mouse ELMOD2-myc/DDK. Cells were fixed 24 h after transfection and costained for TOM20 (top) and myc (bottom). 2D projections of z-stacks are shown. Scale bar = 10 μm.
Lipid-mediated transfections can be quite toxic to cells and even potentially generate secondary effects as a consequence, including changes in mitochondrial morphology. Thus, we included two additional controls in our study. We made use of lentiviral expression of ELMOD2-myc to compare the effects of lentiviral transduction with those of transient transfection, and we also included an ELMOD2 paralog, ELMOD3, for comparison. We transduced WT, MFN1-null, MFN2-null, or MFN DKO MEFs with lentiviruses expressing either mouse ELMOD3-myc (Supplemental Figure S4A) or mouse ELMOD2-myc (Supplemental Figure S4B) and quantified mitochondrial morphology. Expression of ELMOD3-myc and ELMOD2-myc was confirmed by IF staining of the myc epitope. The results were almost identical to those obtained using transient transfection of plasmids, with ELMOD2-myc expression leading to a partial rescue of mitochondrial fragmentation in MFN1-null and MFN2-null MEFs, no effect on mitochondrial morphology in DKO MEFs, and a moderate increase in the fraction of short mitochondria in WT MEFs. In marked contrast, expression of ELMOD3 had no evident effect on mitochondrial morphology in any of the MEF lines. Thus, like loss of ARL2, loss of ELMOD2 causes mitochondrial fragmentation, and its increased expression partially reverses that fragmentation resulting from the loss of either MFN, but not both.
Expression of ELMOD2 increases the rate of mitochondrial fusion in MFN2-null MEFs
As shown above (Figure 3 and Supplemental Figure S2), expression of ELMOD2-myc in MFN1- or MFN2-null MEFs results in elongation of mitochondria back toward morphologies seen in WT MEFs. With the well-established roles of mitofusins in mitochondrial fusion, we sought to confirm this defect in the MFN-null MEFs and to determine whether the rescue provided by expression of ELMOD2-myc (partially) restored this activity. Thus, we tested effects of its expression on mitochondrial fusion using the previously described PAGFP assay.
ELMOD2-myc expression yielded a more pronounced effect in MFN2-null than in the MFN1-null MEFs so MFN2-null MEFs were used in this study. As is readily apparent from the images shown in Figure 5A, spread of the PAGFP signal is far more extensive at 40 min postphotoactivation in MFN2-null cells expressing either human ELMOD2-myc or ELMOD2[R167K]-myc. Quantification showing averages from at least 10 cells (Figure 5B) confirms that ELMOD2-myc expression increases the rate of mitochondrial fusion and that loss of its GAP activity does not alter this effect. These results are consistent with those in Figure 3, leading us to the conclusion that ELMOD2-myc expression causes an increase in the rate of mitochondrial fusion, although this does not rule out potential effects of ELMOD2-myc expression on mitochondrial fission.
FIGURE 5:

Expression of ELMOD2 or ELMOD2[R167K] increases mitochondrial fusion in MFN2-null MEFs. (A) MFN2-null MEFs were cotransfected with mito-DsRed and mito-PAGFP in combination with pcDNA3.1 (empty vector, top left), human ELMOD2-myc/his (top right), or human ELMOD2[R167K]-myc/his (bottom left). After 24 h, cells were photoactivated in the ROI shown and imaged over a period of 40 min as described under Materials and Methods. Merged images of the mito-PAGFP signal (green) and mito-dsRed signal (red) are shown on the left, while mito-PAGFP signal alone (gray) is shown on the right. Single z-planes are shown. Scale bar = 10 μm. (B) Mitochondrial fusion was quantified by calculating the increase in percentage of pixels positive for both red and green signals at each time point relative to the 0-min time point after photoactivation. N = 10 cells per condition. Error bars represent SEM. Single and double asterisks indicate statistically significant differences at p < 0.05 and p < 0.01, respectively.
Expression of ARL2[Q70L] does not induce mitochondrial elongation in the absence of ELMOD2, consistent with ELMOD2 acting as an ARL2 effector
The fact that ARL2 and ELMOD2 bind to each other, localize to mitochondria, and yield very similar phenotypes when decreased in MEFs or overexpressed in MFN-null MEFs strongly suggests that they are acting in a common pathway, with ELMOD2 predicted to be acting downstream of ARL2. To further test this model, we asked whether dominant active ARL2, ARL2[Q70L], can still cause elongation of mitochondria in ELMOD2-null MEFs. Eight cell lines were used in this study: two ELMOD2-null lines, one each from two different guides, two different WT lines, one parental and the other clonal post-CRISPR, and the same four lines after transduction with lentivirus directing expression of mouse ELMOD2-myc. Each of these lines was transiently transfected with plasmid expressing empty vector (negative control) or ARL2[Q70L] and stained for imaging 48 h later.
We have previously shown that expression of ARL2[Q70L] in HeLa cells promotes elongation of mitochondria as well as partial reversal of mitochondrial fragmentation in MFN-null MEFs (Newman et al., 2017a). Consistent with this, we found that expression of ARL2[Q70L] in WT MEFs led to elongated mitochondrial morphology in an average of 48% of transfected cells (Figure 6, A and B). However, in ELMOD2-null MEFs, ARL2[Q70L] expression failed to promote mitochondrial elongation. The morphology of mitochondria in ELMOD2-null MEFs expressing ARL2[Q70L] is indistinguishable from that in cells transfected with the empty vector, with very few mitochondria appearing elongated (average of both lines = 1%).
FIGURE 6:

ARL2[Q70L] does not promote mitochondrial elongation in the absence of ELMOD2. (A) Selected MEF lines were transfected with either pcDNA3.1 (empty vector) or ARL2[Q70L]. Cells were fixed 48 h after transfection and costained for ARL2 (unpublished data) or HSP60. 2D projections of z-stacks are shown. Scale bar = 10 μm. (B) Two WT and two ELMOD2-null MEF lines along with the same lines after lentiviral transduction to express mouse ELMOD2-myc were transfected with either empty pcDNA3.1 or that designed for expression of ARL2[Q70L]. Cells were fixed and stained as described in A and scored for the presence of fragmented, short, tubular, or elongated mitochondria. N = 100 cells per condition per experiment. The graph shows average values across the multiple cell lines tested. Error bars represent SEM of three independent experiments.
The expression of ELMOD2-myc in ELMOD2-null cells partially restored the ability of ARL2[Q70L] to promote mitochondrial elongation in these lines (average 31% elongated), although the combination caused a slight increase in the proportion of cells with short (average 14%) and fragmented (average 16%) mitochondria compared with empty vector. In contrast, the effects of transient expression of ARL2[Q70L] in combination with lentiviral expression of ELMOD2-myc in WT MEFs were similar to those of ARL2[Q70L] expression alone, with an average of 35% of cells having elongated mitochondria, although the combination also caused a slight increase in short and fragmented mitochondria. These results demonstrate that the presence of ELMOD2 is required for ARL2[Q70L] to promote mitochondrial fusion, strongly suggesting that ELMOD2 is acting downstream of ARL2.
Attempts to quantify the localization of ELMOD2 in cultured cells have been unsuccessful
Given the similarities in actions of ELMOD2 to those of ARL2 and the model in which they interact directly with each other to modulate mitochondrial fusion, we wanted to confirm the localization of ELMOD2 to the intermembrane space (IMS), as we have done previously for ARL2. We showed that ARL2 regulates mitochondrial morphology specifically from the IMS through the use of a strong mitochondrial localization sequence (MLS), derived from Smac/Diablo, fused at the N-terminus to drive the exogenous protein to the IMS (Newman et al., 2017a). SMAC-ARL2 was sufficient to regulate mitochondrial morphologies, while an N-terminal fusion of an MLS from ornithine carbamoyltransferase (OCT) that targets to the matrix or simply adding an HA-tag at the N-terminus to keep ARL2 out of mitochondria altogether failed to alter morphologies. We attempted to use the same strategies with ELMOD2, but found that the addition of any tag at the N-terminus of ELMOD2 (including a short HA tag) resulted in poor expression, with rapid degradation of the tagged ELMOD2. In addition, the exogenous ELMOD2 constructs that could be detected did not localize properly; that is, SMAC-ELMOD2 only very incompletely localized to mitochondria, based on immunofluorescence and the incomplete cleavage typically seen upon import (Newman et al., 2016, 2017a). As a result, the site of ELMOD2’s activity in relation to mitochondrial morphology could not be confirmed experimentally, though is predicted to function from the IMS based on its similarities to ARL2, its direct binding to ARL2, and high-resolution imaging showing that ELMOD2 localizes inside mitochondria (Supplemental Figure S5). We have not observed similar degradation or localization issues using the various C-terminally tagged ELMOD2 constructs used throughout the previously described experiments.
Studies of ELMOD2 are also complicated by the fact that it localizes to several cellular locations, including mitochondria, lipid droplets, and the endoplasmic reticulum (ER) (East et al., 2012; Newman et al., 2014; Suzuki et al., 2015). Additionally, ELMOD2 is expressed at only low levels in every cell line or tissue examined by immunoblot, it overexpresses poorly (particularly the human form as described above), and ELMOD2 antibodies lack the sensitivity needed to monitor endogenous levels by immunoblotting in a number of cell lines examined, including MEFs. The ELMOD2 antibody used throughout this paper was raised in rabbits against purified, bacterially expressed ELMOD2 and characterized in our lab. It detects endogenous mitochondrial ELMOD2 by immunofluorescence but is typically near or below the limit of detection in immunoblots. We have previously confirmed the specificity of the mitochondrial ELMOD2 staining by loss of signal after antigen competition or use of preimmune serum (Newman et al., 2014). Finally, we note that the commercial rabbit polyclonal antibody directed against ELMOD2 that we used in our earlier studies using siRNAs to demonstrate knockdown effectiveness is no longer available. Or rather, what is being sold is a “different bleed” that lacks the previously established sensitivity required to detect endogenous ELMOD2.
ELMOD2, ARL2, MFN1-myc, MFN2-myc, myc-MIRO1, myc-MIRO2, and mitoPLD-GFP each displays similarly periodic punctate staining at mitochondria
In our earlier studies of ARL2 at mitochondria, we used high-resolution structured illumination microscopy (SIM) and found that staining of endogenous ARL2 localizes to discrete puncta along mitochondria that align with those of transiently expressed MFN1-myc and MFN2-myc (Newman et al., 2017a). Given the extensive functional similarities between ARL2 and ELMOD2 described above, as well as previously reported (Newman et al., 2014, 2017b), we tested whether ELMOD2 shares this localization pattern. We utilized gated stimulated emission depletion (gSTED) microscopy as well as SIM, due to its even greater resolving power and because it is less prone to artifacts that can arise during image reconstruction. Instead of MEFs, we used COS7 cells in these studies, as they are superior for visualization and quantification. Additionally, the generation of ELMOD2-null MEFs allowed us to further validate our ELMOD2 antibody. Supplemental Figure S6 shows that mitochondrial ELMOD2 staining is not present in ELMOD2-null MEFs, demonstrating the loss of ELMOD2 in our null MEFs and the specificity of the mitochondrial signal detected by our antibody.
Imaging of endogenous ELMOD2 in COS7 cells by gSTED revealed that ELMOD2 staining is typically found at regularly spaced puncta (Figure 7). The puncta typically repeat at intervals of 0.2–0.3 μm, with some variation likely due to mitochondrial shape. In contrast to ELMOD2 or ARL2, gSTED imaging of a number of mitochondrial proteins (e.g., HSP60, cytochrome c) appear diffuse (nonpunctate) within mitochondria. As shown in previous work (East et al., 2012; Suzuki et al., 2015), ELMOD2 is also found at ER and lipid droplets, so there is substantial nonmitochondrial staining that adds background. Thus, to focus on mitochondrial ELMOD2 staining, we used double labeling with well-established mitochondrial markers (e.g., HSP60, cytochrome c, TOM20) to define the organelle boundaries and then monitored ELMOD2-specific staining that fell within that boundary.
FIGURE 7:

Mitochondrial ELMOD2 and ARL2 staining show the same periodic, punctate staining pattern when imaged by gSTED. COS7 cells were fixed and stained for ELMOD2 (top three panels) or ARL2 (bottom panel) and imaged by gSTED as described under Materials and Methods. The panels on the left show example sections of mitochondria from four different cells costained for ELMOD2 (top three rows) or ARL2 (bottom row) and HSP60 (unpublished). The second column shows the same staining shown in the first column but with line scans drawn over the mitochondria, using FIJI. These line scans were used to determine pixel intensities, which are graphically displayed in the plot profiles in the right column. 2D projections of z-stacks are shown. Scale bar = 0.5 μm.
We measured the average distance between ELMOD2 puncta over a total mitochondrial length of at least 100 μm per cell in eight cells (5102 puncta distances measured) and determined the average distance between ELMOD2 puncta to be 0.27 ± 0.11 μm. The distance between puncta was consistent within a single cell and when multiple cells were compared (Supplemental Figure S7). When analyzed by gSTED (1839 puncta distances measured), the ARL2 puncta repeated at an interval of 0.25 ± 0.11 μm, almost identical to the ELMOD2 pattern (Figure 7).
Although a number of multisubunit protein complexes are known to exist inside mitochondria (e.g., complexes I–V, MICOS), none of the components of these has been reported to display punctate staining with spacing similar to that seen for ELMOD2 and ARL2. We previously used SIM to image a number of other mitochondrial proteins to identify other candidates with similar spacing and found that most (cytochrome c, TOM20, HSP60, subunits of complex I, III, and V, mic60/mitophilin, DRP1, MFF, and OPA1) are not similarly spaced (Newman et al., 2017a). We repeated imaging of a selection of these mitochondrial proteins by gSTED (cytochrome c, HSP60, TOM20) and found that, similarly to the SIM results, these proteins either appear mostly diffuse (cytochrome c, HSP60, Supplemental Figure S8, A and B) or have punctate staining that does not have the same spacing as ELMOD2 (TOM20, Supplemental Figure S8C; consistent with previous reports [Wurm et al., 2011]).
We next asked whether other proteins implicated in mitochondrial fusion (MFNs; Chen et al., 2003; Eura, 2003; Koshiba et al., 2004) and mitochondrial phospholipase D (mitoPLD; Huang et al., 2011; Zhang et al., 2016) also appear as puncta with regular spacing. Sensitive and specific antibodies directed against several key mitochondrial proteins are lacking, so in some cases we had to use exogenous, epitope-tagged protein expression. COS7 cells were transfected with plasmids directing expression of MFN1-myc or MFN2-myc. Only cells displaying low levels of expression were chosen for imaging and quantification, to minimize effects of protein overexpression on mitochondrial morphology. Cells were costained for the myc epitope and ELMOD2 and imaged by SIM. Punctate staining of MFN1/2-myc was similar to that of ELMOD2, so we followed up using gSTED. ELMOD2 and each mitofusin displayed a very similar punctate staining pattern, and the puncta often aligned (Figure 8, A and B). We also tested the localization of mitoPLD by expressing mitoPLD-GFP. The mitoPLD-GFP signal was also punctate and often aligned with ELMOD2 puncta (Figure 8C).
FIGURE 8:

ELMOD2 puncta have a similar staining pattern when compared with MFN1-myc, MFN2-myc, and mitoPLD-GFP puncta at mitochondria. (A) COS7 cells were transfected with MFN1-myc. Cells were fixed 24 h after transfection, costained for myc (magenta) and ELMOD2 (green), and imaged by gSTED. A single mitochondrion is shown stained for myc (top left), ELMOD2 (top right), and merged (bottom left). The bottom right image displays the merged image including the line scan drawn in FIJI. The resulting plot profile showing pixel intensities for MFN1-myc and ELMOD2 is shown below the images. 2D projections of z-stacks are shown. Scale bar = 0.5 μm. (B) Same as A except cells were transfected with MFN2-myc, and the images and plot profile show MFN2-myc and ELMOD2. (C) Same as A except cells were transfected with mitoPLD-GFP and the images and plot profile show mitoPLD-GFP (green) and ELMOD2 (magenta).
Because mitochondrial fusion and motility can be functionally linked processes, we also examined the localization of the two MIRO proteins, transmembrane proteins in the OMM involved in mitochondrial motility (Hirokawa and Takemura, 2005). Again, because antibodies capable of imaging endogenous proteins were not available, we used low-level expression of exogenous myc-MIRO1 and myc-MIRO2. COS7 cells were transfected with plasmids directing expression of myc-MIRO1 or myc-MIRO2, costained for myc and ELMOD2, and imaged by gSTED. Like the results observed with the fusion proteins, the myc-MIRO1 and myc-MIRO2 signals showed regularly spaced punctate staining that consistently aligned with ELMOD2 signal at mitochondria (Figure 9).
FIGURE 9:

ELMOD2, myc-MIRO1, and myc-MIRO2 have similar punctate staining patterns at mitochondria. (A) COS7 cells were transfected with myc-MIRO1. Cells were fixed 24 h after transfection, costained for myc (magenta) and ELMOD2 (green), and imaged by gSTED. A single mitochondrion is shown stained for myc (top left), ELMOD2 (top right), and merged (bottom left). The bottom right image displays the merged image including the line scan drawn in FIJI. The resulting plot profile showing pixel intensities for myc-MIRO1 and ELMOD2 is shown below the images. 2D projections of z-stacks are shown. Scale bar = 0.5 μm. (B) Same as A except that cells were transfected with myc-MIRO2 and images and plot profile show myc-MIRO2 and ELMOD2.
To quantify the apparent alignment of ARL2, ELMOD2, MFN1/2, mitoPLD, and MIRO1/2, we measured the Pearson’s correlation coefficient between the green and red pixel intensities for every doubly labeled condition tested, as described under Materials and Methods (Figure 10). Because ARL2 and ELMOD2 stain other cellular locations besides the mitochondria, we used Imaris to select three-dimensional (3D) regions of interest (ROIs) around the mitochondria (using the mitochondrial protein as a guide) and limited our analysis to the ARL2 and ELMOD2 signal at mitochondria (Supplemental Figure S9). At least three cells were analyzed per condition. The average correlations between staining of ELMOD2 and the negative controls were 0.24 (cytochrome c), 0.24 (HSP60), and 0.21 (TOM20). These results confirm the lack of a strong correlation between the staining patterns in these samples observed by visual inspection and are consistent with a lack of alignment between ELMOD2 and these proteins. The fact that these values are above zero is consistent with their all being found throughout mitochondria and thus expected to overlap with ELMOD2 puncta. Because mitofusins both homo- and hetero-oligomerize, we cotransfected COS7 cells with MFN2-myc and MFN1- or MFN2-HA and costained for myc and HA as positive controls, predicted to yield the highest values achievable in this assay (Supplemental Figure S10). The correlations between the two mitofusins were 0.69 for MFN1-HA and MFN2-myc and 0.68 for MFN2-HA and MFN2-myc. The correlations between ARL2 and the mitofusins were also very high—0.70 for MFN1-myc and 0.66 for MFN2-myc. The correlations for the ELMOD2 and MFN-myc signals at mitochondria were 0.51 for MFN1-myc and 0.52 for MFN2-myc, higher than for negative controls, though not as high as ARL2 and the mitofusins or the positive controls. The correlation between ELMOD2 and mitoPLD-GFP was 0.59. Finally, the correlations between ELMOD2 and the MIROs were 0.55 for myc-MIRO1 and 0.63 for myc-MIRO2, comparable (or even higher in the case of MIRO2) to the correlations observed between ELMOD2 and the mitofusins and also higher than the negative controls.
FIGURE 10:
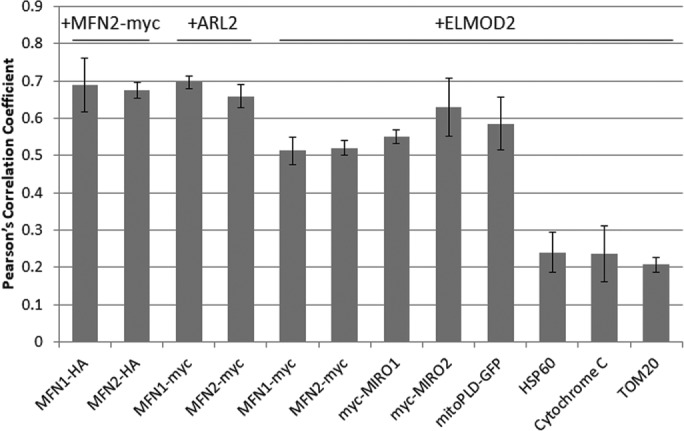
Pearson’s correlation coefficient values for doubly labeled mitochondrial proteins using images collected by gSTED. Pearson’s correlation coefficient was calculated using Imaris as described under Materials and Methods. The different antibodies used for double labeling are indicated above and below the bars. At least three cells were analyzed per costaining condition. Error bars represent SEM.
DISCUSSION
We show that changes in the levels of ELMOD2, loss via deletion or overexpression, result in opposite effects on mitochondrial morphology. We knocked out ELMOD2 in immortalized MEFs and found them to display fragmented mitochondria, similar to our earlier findings with siRNA (Figure 1). In the ELMOD2 heterozygous line, this phenotype was barely noticeable, suggesting that the majority of ELMOD2 must be lost for fragmentation to manifest. Concerns over off-target effects of CRISPR were minimized through the use of rescued lines. These results are in agreement with the siRNA data, but go further, in that we were able to use the KO lines in the mito-PAGFP assay, where we found decreases in fusion (Figure 2). Altogether, these data support our conclusion that ELMOD2 promotes mitochondrial fusion.
Expression of ELMOD2-myc reverses mitochondrial fragmentation in MFN1- or MFN2-null MEFs and increases the rate of mitochondrial fusion (Figures 3 and 5 and Supplemental Figure S2), consistent with ELMOD2 acting with either MFN to promote fusion. ELMOD2-myc expression is unable to reverse mitochondrial fragmentation in OPA1-null or MFN DKO MEFs (Figure 4). ELMOD2 is thus capable of compensating for the loss of a single mitofusin, but not OPA1 or both mitofusins. Thus, the promotion of mitochondrial fusion by ELMOD2-myc requires the presence of either MFN1 or MFN2, consistent with ELMOD2 acting upstream of the mitofusins. These results are practically identical to those reported for ARL2, which was also found to reverse mitochondrial fragmentation in MFN1- or MFN2-null MEFs but not OPA1-null or DKO MEFs (Newman et al., 2017a), providing more evidence that ARL2 and ELMOD2 are acting in the same pathway to promote mitochondrial fusion.
The fragmentation phenotype in the ELMOD2-null lines, while always more fragmented than in WT MEFs, is variable, likely due to variations across different clonal lines (Figure 1). However, in all ELMOD2-null lines, the fragmentation phenotype is not as severe as phenotypes observed in MEFs lacking the key components of mitochondrial fusion (MFN1, MFN2, or OPA1; Figures 3 and 4 and Supplemental Figure S2). Similarly, ARL2 siRNA or expression of the dominant negative mutant ARL2[T30N] results in obvious mitochondrial fragmentation, but not to the same degree as mitofusin or OPA1 loss (Newman et al., 2014). Notably, expression of ELMOD2-myc has no effect on the mitochondrial morphology of WT MEFs and overexpression of WT ARL2 also does not alter mitochondrial morphology in cells without fusion defects (Newman et al., 2014, 2017a; Figure 4). ARL2 expression results in mitochondrial elongation only when it is constitutively active (ARL2[Q70L]; Newman et al., 2017a). Expression of ELMOD2-myc or ARL2 in MFN-null MEFs results in an obvious, but partial, reversal of mitochondrial fragmentation (Figure 3 and Supplemental Figures S2 and S4). These data are evidence that ARL2 and ELMOD2 are likely not required for mitochondrial fusion, but rather regulators capable of enhancing this process. The levels of mitochondrial ARL2 and ELMOD2 increase in response to stressors that also stimulate elongation, such as glucose or serum deprivation (Newman et al., 2017b), so the function of ARL2 and ELMOD2 may be to modulate fusion during times of stress.
All previously described regulators of mitochondrial fusion act from the cytosolic side of the outer membrane. We previously demonstrated ARL2’s regulation of mitochondrial morphology occurs specifically from the IMS (Newman et al., 2017a). Analogous studies with ELMOD2 were unsuccessful, as tagging resulted in degradation and incomplete mitochondrial import. Despite these limitations, the fact that ELMOD2 binds directly to ARL2 (Bowzard et al., 2007) and acts downstream of it leads us to hypothesize that ELMOD2 acts from the IMS. Because some ELMOD2 localizes to the ER and tethering between the ER and mitochondria may influence mitochondrial dynamics, we used triple labelling of ER (mCherry-Sec61β), mitochondria (TOM20), and ELMOD2 to assess the presence of ELMOD2 at ER–mitochondria contact sites (defined by areas of ER and mitochondria overlap). We did not observe any enrichment of ELMOD2 at contact sites, but rather a predominance of overlap between TOM20 and ELMOD2 staining that lacked that of mCherry-Sec61β. Though we cannot exclude a possible contribution of ER- or lipid droplet–localized ELMOD2 to mitochondrial dynamics, we show that ARL2 and ELMOD2 are acting in a common pathway upstream of MFNs. High-resolution imaging is also in agreement with ELMOD2 localizing inside mitochondria as ELMOD2 staining often lies between that of outer membrane proteins, such as MFN1-myc (Figure 8A), myc-MIRO2 (Figure 9B), or TOM20 (Supplemental Figure S5). Thus, we believe that ARL2 and ELMOD2 each partially localize to the IMS. The localization of ARL2, and likely ELMOD2, in the IMS indicates that they may participate in cross-talk between the OMM and IMM.
Currently, there are few known regulators of mitochondrial fusion. Those that have been described act specifically on either MFN1 or MFN2 (Hoppins et al., 2011; Kumar et al., 2016), but not both. It appears that ARL2 and ELMOD2 can act through either mitofusin, as expression of either ARL2 or ELMOD2-myc partially reverses mitochondrial fragmentation in both MFN1- and MFN2-null MEFs. For both ARL2 and ELMOD2-myc, the rescue is more pronounced in the MFN2-null MEFs, but it is unclear whether this is due to a preferential activation of MFN1 or the fact that MFN1-null MEFs have a more severe fragmentation phenotype (Chen et al., 2003), likely due to the fact that MFN1 has better fusion activity in vitro than MFN2 (Ishihara et al., 2004). Mitochondrial staining of ARL2 and ELMOD2 is stronger in MFN2-null than in MFN1-null or WT MEFs (Newman et al., 2017b), suggesting that ARL2 and ELMOD2 may respond somewhat differently to the loss of each MFN.
Despite the fact that ELMOD2 was first purified as an ARL2 GAP (Bowzard et al., 2007), it was later shown to display a unique and high level of promiscuity in its use of substrates, though all are ARF family GTPases (Ivanova et al., 2014). Because ARL2 is the only regulatory GTPase in the ARF family found inside mitochondria and ELMOD2 the only GAP associated with that organelle, we sought to test the model that they act in a common pathway more rigorously. With the generation of MEFs specifically deleted for ELMOD2, we had the ability to test this model. Expression of ARL2[Q70L] leads to hyperfusion and mitochondrial elongation (Newman et al., 2017a); however, it had no such effect in ELMOD2-null MEFs (Figure 6). Thus, ELMOD2 is required for ARL2 to promote mitochondrial elongation, consistent with ELMOD2 acting immediately downstream of ARL2 to regulate mitochondrial fusion. Loss of ARL2 causes a drastic (∼50%) decrease in cellular ATP; however, loss of ELMOD2 has no significant effect on ATP levels (Newman et al., 2014). This suggests that while ARL2 and ELMOD2 act in a common pathway that regulates mitochondrial morphology, ARL2 influences cellular ATP levels through a different pathway, independent of ELMOD2.
In addition, ARF-family GAPs have consistently been found to act as effectors, being obligate components in the signal output, rather than simply down-regulating that output as a result of increased GTP hydrolysis by the GTPase (East and Kahn, 2011). We previously identified the residue acting as the presumptive “arginine finger,” Arg167, which is essential for GAP activity in ELMOD2 and showed that mutation results in ablation of GAP activity (East et al., 2012). The results shown in Figures 3 and 5 and Supplemental Figure S2 using ELMOD2[R167K]-myc suggest that ELMOD2 is functioning as an effector in this pathway (rather than a GAP), as ELMOD2[R167K]-myc is as capable as ELMOD2-myc of reversing fragmentation and enhancing fusion, showing that ELMOD2 does not require GAP activity to promote mitochondrial fusion (Figures 3 and 5 and Supplemental Figure S2). A number of similarities are also evident in phenotypes resulting from changes in the activities of ARL2 and ELMOD2: 1) loss of either decreases the rate of fusion, causing fragmentation, 2) overexpression rescues either MFN1-null or MFN2-null MEFs, 3) the two share similar localization patterns along mitochondria, and 4) the abundance of ARL2/ELMOD2 increases in response to stressors leading to mitochondrial elongation (Newman et al., 2014, 2017a,b). Thus, we conclude that ELMOD2 is acting downstream of ARL2 as an effector in promoting mitochondrial fusion.
The gSTED data show that ELMOD2, ARL2, the MFNs, mitoPLD, and the MIROs localize to puncta at mitochondria (Figures 7–10). These puncta have a periodicity unique to these proteins, and distinct from a large number of other mitochondrial proteins tested, repeating at an interval of 0.2–0.3 μm (Supplemental Figure S7). We tested the localization of several known mitochondrial proteins with both diffuse (HSP60, cytochrome c) and punctate (TOM20) staining, but none of these proteins shared the same spacing as ELMOD2 (Supplemental Figure S8). Therefore, this punctate, periodic staining is specific to ARL2, ELMOD2, the mitofusins, mitoPLD, and the MIROs. We have previously suggested that ARL2 and the mitofusins could be part of a complex important for mitochondrial fusion, particularly as mitochondrial fission proteins (DRP1, MFF) did not align with ARL2 (Newman et al., 2017a). The data described here more accurately define the spacing of these potential complexes and expand the number of proteins potentially involved to include ELMOD2, mitoPLD, and the MIROs. Because ELMOD2 binds directly to ARL2, we speculate that ARL2 and ELMOD2 are likely in a common protein complex in mitochondria. ARL2/ELMOD2 may then either directly or indirectly interact with the other components identified by high-resolution imaging as displaying common staining patterns at mitochondria (mitofusins, mitoPLD, and MIROs).
MFN1 and MFN2 are central to OMM fusion, while MIRO1 and MIRO2 are essential for mitochondrial motility (Rojo et al., 2002; Koshiba et al., 2004; Boldogh and Pon, 2007). Mitochondria must come into contact with each other in order to fuse, so motility necessarily precedes fusion; the fact that mitofusins, mitoPLD (also involved in fusion), and MIROs localize to the same puncta suggests such a link. In addition, we have previously shown that ARL2[T30N] expression, ARL2 siRNA, or ELMOD2 siRNA result in perinuclear clustering of mitochondria (Newman et al., 2014), suggesting a defect in mitochondrial motility when ARL2 or ELMOD2 activity is lost. Thus, the possibility that there exists in mitochondria a multisubunit protein complex containing components from both the IMS and OMM and capable of influencing fusion and motility is worthy of further study.
In summary, we show that ELMOD2 acts downstream of ARL2 and upstream of the mitofusins. We also demonstrate that ELMOD2 promotes mitochondrial fusion and does so independent of its GAP activity. Thus, like a number of ARF GAPs, we believe ELMOD2’s actions at mitochondria are best described as an effector in the ARL2 pathway. Additionally, we describe the unique staining patterns of ELMOD2, ARL2, MFNs, mitoPLD, and MIROs at mitochondria, suggestive of a possible protein complex or mitochondrial outer membrane subdomain that we speculate is important to both mitochondrial fusion and motility. These findings demonstrate a novel mode of regulation of mitochondrial morphology that is predicted to be ancient and important in a number of currently unidentified cellular conditions.
MATERIALS AND METHODS
Antibodies and reagents
The following antibodies were used in this study: rabbit monoclonal TOM20 (Cell Signaling #42406S), myc (Invitrogen #R950-25), HSP60 (Stressgen #ADI-SPA-807), mouse monoclonal TOM20 (BD Biosciences #61228), cytochrome c (BD Biosciences #556432), and HA (Cell Signaling #3724S). ARL2 and ELMOD2 antibodies were generated in our lab and raised against their corresponding recombinant full-length human proteins and have been described previously (Sharer et al., 2002; Newman et al., 2014).
Cloning and constructs
The following plasmids were generously given or commercially obtained and used in this study: MFN1-10xmyc, MFN2-16xmyc, MFN1-3xHA, and MFN2-3xHA in pcDNA3.1 (David Chan, California Institute of Technology; Chen et al., 2003); myc-MIRO1 (Addgene plasmid #47888) and myc-MIRO2 (Addgene plasmid #4789, Pontus Aspenstrom, Karolinska Institute; Fransson et al., 2003); human mitoPLD-GFP (Michael Frohman, Stony Brook University; Huang et al., 2011); mito-PAGFP (Richard Youle, National Institutes of Health [NIH]; Addgene plasmid #23348; Karbowski et al., 2004); mito-DsRed (James Zheng, Emory); mCherry-Sec61β (Gia Voeltz, University of Colorado; Addgene plasmid #49155); and pSpCas9(BB)-2A-Puro (PX459) V2.0 (Addgene plasmid #62988). ARL2[Q70L], ELMOD2-myc/his, and ELMOD2[R167K]-myc/his in pcDNA3.1 were described previously (Zhou et al., 2006; Bowzard et al., 2007; East et al., 2012). ELMOD2-myc/DDK in pCMV6 was purchased from OriGene (#MR204034). ELMOD2[R167K]-myc/DDK was generated by site-directed mutagenesis using the QuickChange mutagenesis kit (Agilent Technologies #210518) and sequence-verified. Note that ELMOD2-myc/his directs expression of human ELMOD2, while ELMOD2-myc/DDK directs expression of mouse ELMOD2. Human and mouse ELMOD2 share 87% sequence identity and are equally capable of influencing mitochondrial morphology. However, mouse ELMOD2 expresses to higher levels than human ELMOD2 (Supplemental Figure S1). Lentiviruses directing expression of mouse ELMOD2-myc or ELMOD3-myc were generated and purified in the Emory Lentiviral Vector Core Facility after the ELMOD open reading frames were cloned into the pFUGW vector (Lois et al., 2002). For simplicity, expression of all ELMOD2 constructs is referred to as “ELMOD2-myc” expression in the results and figure labels. The full names of constructs used are provided in the figure legends.
Cell lines
COS7 cells were originally obtained from the American Type Culture Collection. WT (parental; ATCC CRL-2991), MFN1-null, MFN2-null, OPA1-null, and MFN1/MFN2 double knockout (DKO) immortalized MEFs were a generous gift from David Chan (California Institute of Technology; Chen et al., 2003; Koshiba et al., 2004; Song et al., 2007).
The immortalized WT cells served as the parental population for CRISPR-Cas9 knockout of ELMOD2. To ensure that any phenotypes studied were not the product of off-target effects of CRISPR or random selection of clonal lines, we generated at least two null lines from at least two different guide RNAs (a minimum of four lines). Guides (20 nt) were designed using Benchling (https://benchling.com/) and cloned into the pSpCas9(BB)-2A-Puro (PX459) V2.0 vector. WT MEFs were transfected with guide plasmids, and 1 d later puromycin (3 µg/ml, Sigma #P8833) was added for 4 d to enrich for transfected cells. Clonal isolation via limited dilution was then performed in 96-well plates. Each clone was expanded and genomic DNA was obtained for screening of indels by Sanger sequencing.
Cell culture
Cells were grown in DMEM (ThermoFisher #11965) supplemented with 10% fetal bovine serum (FBS; Atlanta Biologicals #S11150) at 37°C in the presence of 5% CO2 and in the absence of antibiotics. No cells were cultured beyond 30 passages (all ELMOD2-null lines were analyzed before passage 10). Cell density, feeding, and plating were kept constant between conditions and experiments, with a target of ∼70% confluence for cell imaging. Cells were screened for mycoplasma regularly by staining with Hoechst 33342 DNA dye.
Transfection and transduction
Cells at 90% density or higher were transfected in six-well plates using the following protocols. COS7 cells were transfected with a ratio of 2 µg Lipofectamine 2000:1 µg DNA. MEFs were transfected using a similar protocol, though we found that optimal expression was obtained using a 3:1 μg ratio of Lipofectamine 2000:DNA. Cells were transfected with 0.5 µg MFN1-myc, MFN2-myc, MFN1-HA, MFN2-HA, mitoPLD-GFP, myc-MIRO1, or myc-MIRO2, 2 μg ARL2[Q70L] or mCherry Sec61β, or 4 μg of any ELMOD2-expressing plasmid. Plasmids were diluted in 250 µl Opti-MEM (Invitrogen #31985). Lipofectamine 2000 (Invitrogen #11668) was diluted in a separate tube containing 250 µl Opti-MEM, vortexed briefly, and incubated at room temperature for 5 min. The tubes were mixed and incubated for 20 min. Cell culture medium was changed to 1.5 ml of Opti-MEM, and transfection complexes (500 µl) were added to the cells dropwise. After 4 h, cells were trypsinized and replated into fresh wells or onto coverslips.
For lentiviral transduction for expression of ELMOD2-myc or ELMOD3-myc, 10,000 cells were plated into 24-well plates and allowed to settle for 1–2 h. Cells were transduced with virus (MOI of 2 × 10⁹) at a 150:1 ratio of lentivirus to cells. After 48 h of treatment, the medium was swapped with fresh DMEM + 10 FBS%.
For transfection of ELMOD2-null lines, cells were transfected with PEI at a 3:1 μg ratio of PEI to DNA. These complexes were diluted in 0% FBS DMEM and incubated at room temperature for 20 min before being added dropwise to cells immersed in 2% FBS DMEM (medium swapped from 10% FBS DMEM to 2% FBS DMEM immediately before transfection). Cells grew for 24 h before being replated onto coverslips. After 48 h, cells were fixed and prepared for immunofluorescence experiments (see below).
Immunoblotting
Cells were harvested by rinsing twice with phosphate-buffered saline (PBS), collected by incubation in 5 mM EDTA in PBS, and pelleted in a microfuge (14,000 rpm, 4°C). Cells were lysed on ice for 30 min in 1% CHAPS, 25 mM HEPES, pH 7.4, 100 mM NaCl, and 0.1% protease inhibitors (Sigma #P-2714), and the S14 was obtained by clarifying lysates by centrifugation for 30 min (14,000 rpm, 4°C). Protein concentrations were determined by Bradford Assay (Bio-Rad #5000006) using bovine serum albumin (Thermo Scientific #23209) as standard. Protein samples (20 μg/well) were separated on 11% polyacrylamide gels and transferred to nitrocellulose membranes (Bio-Rad #162–0112) at 20 V overnight. Membranes were blocked in PBST (PBS with 0.1% Tween-20) containing 5% (wt/vol) dry milk (Bio-Rad #170-6404) for 1 h. Membranes were then incubated with primary antibody in blocking buffer at 4°C overnight, followed by washing in PBST three times for 10 min each. Horseradish peroxidase (HRP)-conjugated secondary antibody (GE #NA931V) was diluted in PBST and incubated for 1 h at room temperature, followed by washing three times in PBST for 10 min each. Excess Tween-20 was removed by quickly rinsing membranes in PBS. Blots were incubated in luminol-containing solution (0.1 mM Tris-HCl, pH 8.0, 1.2 mM luminol, 0.2 mM p-coumaric acid, 0.009% hydrogen peroxide) for 1 min before exposure to film. Myc antibody was used at a dilution of 1:1000 for immunoblotting experiments.
Immunofluorescence
Cells were grown on a matrigel (BD Biosciences #356231) coated coverslip, fixed for 15 min in a prewarmed (37°C) solution of 4% paraformaldehyde in PBS (140 mM NaCl, 3 mM KCl, 10 mM Na2HPO4, 2 mM KH2PO4, pH 6.75) at room temperature, and permeabilized for 10 min with 0.1% (vol/vol) Triton X-100 in PBS at room temperature. Coverslips were blocked for 1 h at room temperature using filtered PBS containing 1% (wt/vol) bovine serum albumin (BSA) (Sigma #A3059). Primary antibodies were incubated in blocking solution at 4°C overnight, followed by 4 × 5-min washes in PBS. Secondary antibodies (1:500; Alexa fluorophores, ThermoFisher) were incubated in blocking solution for 1 h at room temperature. Secondary antibody was removed by 2 × 5-min washes in PBS. DNA was then stained with Hoechst 33342 for 4 min, followed by 2 × 5-min washes in PBS. Stained coverslips were mounted onto slides using MOWIOL. Bleedthrough of secondary antibodies between channels was monitored by staining cells regularly with secondary antibody only. Cells stained for ER were fixed in 2% paraformaldehyde and 0.05% glutaraldehyde in PHEM (68 mM PIPES, 25 mM HEPES, 15 mM EGTA [ethylene glycol-bis(β-aminoethyl ether)-N,N,N′,N′-tetraacetic acid], 3 mM MgCl2) for 10 min, and permeabilized by incubation in 0.05% (wt/vol) saponin in all subsequent buffers.
Confocal images were acquired using an Olympus FV1000 microscope and Olympus Fluoview v1.7 software, using 488- and 543-nm laser excitation and a 100× oil objective (1.45 NA). Z-stacks with a step size of 0.37 µm were acquired, which were converted to maximum image intensity projections using FIJI where indicated. The following antibody dilutions were used: rabbit monoclonal TOM20 (1:200), myc (1:2000), HSP60 (1:5000), mouse monoclonal TOM20 (1:5000), cytochrome c (1:2000), HA (1:2000), ARL2 (1:2000), and ELMOD2 (1:500).
Live-cell imaging (mito-PAGFP assay)
For MFN2-null experiments, cells were transfected with 2 µg mito-PAGFP, 1 µg mito-DsRed, and 3 µg of the indicated plasmid and replated onto 35 mm MatTek dishes (#P35GC-1.5-14-C) following 4 h of transfection, as described above. For ELMOD2-null experiments, cells were transfected using the previously described PEI protocol. Cells were transfected directly onto glass bottom dishes for 24 h with 4 µg mito-PAGFP, 2 µg mito-DsRed, and 18 µg PEI the day before imaging. For all experiments, at least 2 h before imaging, the medium was changed to prewarmed DMEM with 25 mM HEPES plus 10% FBS and without phenol red (Invitrogen #21063). Live-cell imaging was performed using a Nikon A1R confocal microscope, enclosed in a temperature control chamber at 37°C, using a 100× (NA 1.49) oil objective. A circular ROI (4 µm diameter) for photoactivation was selected near the nucleus (Karbowski et al., 2014). Photoactivation was achieved by excitation with 405 nm laser (45% power) for six cycles for a total duration of 2.16 s. Images were acquired at 1024 × 1024 pixels at 0.5 frames/s during photoactivation. Images were then acquired every 10 min over 40 min. GFP and DsRed were sequentially excited with 488- and 561-nm laser lines. Imaging data were collected using Nikon Elements software.
Quantification of the mito-PAGFP mitochondrial fusion assay was performed as previously described (Zunino et al., 2009) using FIJI. A cell was excluded from analysis if it had less than a 10-fold increase in GFP signal following photoactivation or moved from the field of view during imaging. Masks for each channel were created, and thresholding was performed using “Otsu dark” in FIJI. The number of pixels within each mask for both GFP and DsRed was measured and calculated as a ratio of GFP signal to DsRed signal. The difference in this ratio between 0 min (immediately after photoactivation) and 10, 20, 30, or 40 min after photoactivation is reported as a percent increase in green/red overlap.
Gated stimulated emission depletion (gSTED) microscopy
Cells were imaged on a Leica gSTED 3× microscope using a 100× (NA 1.4) oil objective. Cells were selected based on an apparently normal mitochondrial morphology, and a range of expressions for each construct were examined. Fluorophores were excited by 488-nm and 561-nm laser lines, which were depleted with 592- and 660-nm laser lines, respectively. Z-stacks were acquired with a step size of 0.22 μm, and were converted to maximum–image intensity projections using FIJI where indicated. For each cell, a confocal image was obtained in addition to gSTED data. Images were acquired using Leica X software.
For deconvolution (LIGHTNING Image Information Extraction+), the 3D data sets were first converted linearly into floating-point variables in an interval of [0, 1]. Using a globally effective deconvolution parameter space the deconvolution of the 3D data set was performed by a Richardson Lucy method using fast Fourier transformations (FFT). The abort procedure for the deconvolution process was based on a cross-correlation procedure that allows a continuous comparison of the image of the last iteration step performed with that of the previous iteration. The iteration was terminated as soon as the comparative images of the last two iterations showed no more differences in their image inherent properties. Finally, the deconvoluted floating-point data sets were converted back to 16-bit data sets.
To quantify the average distance between puncta, the red and green channels for each gSTED image were merged, and z-stacks were converted to maximum-intensity projections in FIJI to yield a single image per cell per condition. FIJI’s segmented line tool (linewidth of 5) was used to manually draw as many linear ROIs as necessary to cover all easily discernable mitochondria in the cell (total ROI length of at least 100 µm per cell). Mitochondria that were clustered so that individual mitochondria could not be distinguished and out of focus mitochondria were excluded. FIJI was then used to measure the red and green pixel intensities within these ROIs. These raw data were then used to generate plot profiles for graphical comparisons of staining periodicity (Microsoft Excel) and to measure the distance between peaks in pixel intensities (MATLAB).
Imaris was used to calculate the Pearson’s correlation coefficient between ARL2/ELMOD2 and several mitochondrial proteins. Because ARL2 and ELMOD2 are present at multiple cellular locations, a 3D ROI was generated around the mitochondria by selecting a surface around the mitochondrial marker (TOM20, HSP60, cytochrome c, MFN1/2, MIRO1/2, or mitoPLD). The surface was used to generate a mask that was applied to both channels, eliminating all signal outside the mask (Supplemental Figure S9). Pearson’s correlation coefficient was then calculated for the masked channels.
Reproducibility/statistics
Every experiment described has been repeated independently at least twice. Mitochondrial morphology was determined based on visual inspection of cells. The designations of “fragmented,” “short,” “tubular,” and “elongated” were defined and illustrated previously (Newman et al., 2017a). Mitochondria that appeared predominantly spherical in shape were classified as fragmented. Mitochondria were defined as short if they assumed a short tube shape. Tubular mitochondria appear mainly as longer tubes. Elongated mitochondria are also tubes, but are longer than tubular mitochondria and appear to form a much more interconnected network. If more than one type of morphology was observable in a cell, the classification was based on the morphology of the majority of the mitochondria in that cell. Dead/dying cells and extremely abnormal-looking cells were excluded. For quantification of immunofluorescence experiments, at least 100 cells per condition were analyzed per experiment. For live-cell experiments, 10 cells were analyzed per condition. For gSTED analysis, at least three cells were analyzed per condition. Error bars represent SEM. Single and double asterisks indicate statistically significant differences (calculated by one-way analysis of variance) at p < 0.05 and p < 0.01, respectively.
Supplementary Material
Acknowledgments
This work was supported by NIH Grants R35GM122568 to R.A.K. and 1F31GM111047 to L.E.N. We thank a number of colleagues for their gifts of key reagents used in these studies, including David Chan (California Institute of Technology; MFN-null MEFs, mitofusin plasmids), Pontus Aspenstrom (Karolinska Institute; MIRO plasmids), Michael Frohman (Stony Brook University; mitoPLD-GFP plasmid), Richard Youle (NIH; mito-PAGFP plasmid), and James Zheng (Emory University; mito-DsRed plasmid). This research project was supported in part by the Emory University Integrated Cellular Imaging Microscopy Core of the Emory Neuroscience NINDS Core Facilities Grant 5P30NS055077. We thank Neil Anthony (Emory University) for assistance with image quantification as well as Christopher Ott, Geoff Daniels, and Gary Schools (Leica Microsystems) for assistance with acquisition and deconvolution of gSTED images.
Abbreviations used:
- ARL2
ARF-like 2
- DRP1
dynamin-related protein 1
- ELMOD2
ELMO domain containing 2
- ER
endoplasmic reticulum
- GAP
GTPase-activating protein
- gSTED
gated stimulated emission depletion
- IMM
inner mitochondrial membrane
- IMS
intermembrane space
- MEF
mouse embryonic fibroblast
- MFN1/2
mitofusin 1 and 2
- mitoPLD
mitochondrial phospholipase D
- OMM
outer mitochondrial membrane
- OPA1
optic atrophy 1
- PAGFP
photoactivatable green fluorescent protein
- SIM
structured illumination microscopy
Footnotes
This article was published online ahead of print in MBoC in Press (http://www.molbiolcell.org/cgi/doi/10.1091/mbc.E18-12-0804) on March 13, 2019.
REFERENCES
- Antoshechkin I, Han M. (2002). The C. elegans evl-20 gene is a homolog of the small GTPase ARL2 and regulates cytoskeleton dynamics during cytokinesis and morphogenesis. Dev Cell , 579–591. [DOI] [PubMed] [Google Scholar]
- Boldogh IR, Pon LA. (2007). Mitochondria on the move. Trends Cell Biol , 502–510. [DOI] [PubMed] [Google Scholar]
- Bowzard JB, Cheng D, Peng J, Kahn RA. (2007). ELMOD2 is an Arl2 GTPase-activating protein that also acts on Arfs. J Biol Chem , 17568–17580. [DOI] [PubMed] [Google Scholar]
- Campello S, Scorrano L. (2010). Mitochondrial shape changes: orchestrating cell pathophysiology. EMBO Rep , 678–684. [DOI] [PMC free article] [PubMed] [Google Scholar]
- Chen H, Detmer SA, Ewald AJ, Griffin EE, Fraser SE, Chan DC. (2003). Mitofusins Mfn1 and Mfn2 coordinately regulate mitochondrial fusion and are essential for embryonic development. J Cell Biol , 189–200. [DOI] [PMC free article] [PubMed] [Google Scholar]
- Clarke TFT, Clark PL. (2008). Rare codons cluster. PLoS One , e3412. [DOI] [PMC free article] [PubMed] [Google Scholar]
- East MP, Bowzard JB, Dacks JB, Kahn RA. (2012). ELMO domains, evolutionary and functional characterization of a novel GTPase-activating protein (GAP) domain for Arf protein family GTPases. J Biol Chem , 39538–39553. [DOI] [PMC free article] [PubMed] [Google Scholar]
- East MP, Kahn RA. (2011). Models for the functions of Arf GAPs. Semin Cell Dev Biol , 3–9. [DOI] [PMC free article] [PubMed] [Google Scholar]
- Eura Y. (2003). Two mitofusin proteins, mammalian homologues of FZO, with distinct functions are both required for mitochondrial fusion. J Biochem , 333–344. [DOI] [PubMed] [Google Scholar]
- Francis JW, Goswami D, Novick SJ, Pascal BD, Weikum ER, Ortlund EA, Griffin PR, Kahn RA. (2017b). Nucleotide binding to ARL2 in the TBCD·ARL2·b-tubulin complex drives conformational changes in b-tubulin. J Mol Biol , 3696–3716. [DOI] [PMC free article] [PubMed] [Google Scholar]
- Francis JW, Newman LE, Cunningham LA, Kahn RA. (2017a). A trimer consisting of the tubulin-specific Chaperone D (TBCD), regulatory GTPase ARL2, and beta-tubulin is required for maintaining the microtubule network. J Biol Chem , 4336–4349. [DOI] [PMC free article] [PubMed] [Google Scholar]
- Frank S, Gaume B, Bergmann-Leitner ES, Leitner WW, Robert EG, Catez F, Smith CL, Youle RJ. (2001). The role of dynamin-related protein 1, a mediator of mitochondrial fission, in apoptosis. Dev Cell , 515–525. [DOI] [PubMed] [Google Scholar]
- Fransson A, Ruusala A, Aspenstrom P. (2003). Atypical Rho GTPases have roles in mitochondrial homeostasis and apoptosis. J Biol Chem , 6495–6502. [DOI] [PubMed] [Google Scholar]
- Gomes LC, Di Benedetto G, Scorrano L. (2011). During autophagy mitochondria elongate, are spared from degradation and sustain cell viability. Nat Cell Biol , 589–598. [DOI] [PMC free article] [PubMed] [Google Scholar]
- Hirokawa N, Takemura R. (2005). Molecular motors and mechanisms of directional transport in neurons. Nat Rev Neurosci , 201–214. [DOI] [PubMed] [Google Scholar]
- Hoppins S, Edlich F, Cleland MM, Banerjee S, McCaffery JM, Youle RJ, Nunnari J. (2011). The soluble form of Bax regulates mitochondrial fusion via MFN2 homotypic complexes. Mol Cell , 150–160. [DOI] [PMC free article] [PubMed] [Google Scholar]
- Huang H, Gao Q, Peng X, Choi SY, Sarma K, Ren H, Morris AJ, Frohman MA. (2011). piRNA-associated germline nuage formation and spermatogenesis require MitoPLD profusogenic mitochondrial-surface lipid signaling. Dev Cell , 376–387. [DOI] [PMC free article] [PubMed] [Google Scholar]
- Ishihara N, Eura Y, Mihara K. (2004). Mitofusin 1 and 2 play distinct roles in mitochondrial fusion reactions via GTPase activity. J Cell Sci , 6535–6546. [DOI] [PubMed] [Google Scholar]
- Ismail SA, Chen YX, Rusinova A, Chandra A, Bierbaum M, Gremer L, Triola G, Waldmann H, Bastiaens PI, Wittinghofer A. (2011). Arl2-GTP and Arl3-GTP regulate a GDI-like transport system for farnesylated cargo. Nat Chem Biol , 942–949. [DOI] [PubMed] [Google Scholar]
- Ivanova AA, East MP, Yi SL, Kahn RA. (2014). Characterization of recombinant ELMOD (cell engulfment and motility domain) proteins as GTPase-activating proteins (GAPs) for ARF family GTPases. J Biol Chem , 11111–11121. [DOI] [PMC free article] [PubMed] [Google Scholar]
- Karbowski M, Arnoult D, Chen H, Chan DC, Smith CL, Youle RJ. (2004). Quantitation of mitochondrial dynamics by photolabeling of individual organelles shows that mitochondrial fusion is blocked during the Bax activation phase of apoptosis. J Cell Biol , 493–499. [DOI] [PMC free article] [PubMed] [Google Scholar]
- Karbowski M, Cleland MM, Roelofs BA. (2014). Photoactivatable green fluorescent protein-based visualization and quantification of mitochondrial fusion and mitochondrial network complexity in living cells. Methods Enzymol , 57–73. [DOI] [PMC free article] [PubMed] [Google Scholar]
- Koshiba T, Detmer SA, Kaiser JT, Chen H, McCaffery JM, Chan DC. (2004). Structural basis of mitochondrial tethering by mitofusin complexes. Science , 858–862. [DOI] [PubMed] [Google Scholar]
- Kumar S, Pan CC, Shah N, Wheeler SE, Hoyt KR, Hempel N, Mythreye K, Lee NY. (2016). Activation of Mitofusin2 by Smad2-RIN1 complex during mitochondrial fusion. Mol Cell , 520–531. [DOI] [PMC free article] [PubMed] [Google Scholar]
- Lois C, Hong EJ, Pease S, Brown EJ, Baltimore D. (2002). Germline transmission and tissue-specific expression of transgenes delivered by lentiviral vectors. Science , 868–872. [DOI] [PubMed] [Google Scholar]
- McElver J, Patton D., Rumbaugh M, Liu C, Yang LJ, Meinke D. (2000). The TITAN5 gene of Arabidopsis encodes a protein related to the ADP ribosylation factor family of GTP binding proteins. Plant Cell , 1379–1392. [DOI] [PMC free article] [PubMed] [Google Scholar]
- Mishra P, Carelli V, Manfredi G, Chan DC. (2014). Proteolytic cleavage of Opa1 stimulates mitochondrial inner membrane fusion and couples fusion to oxidative phosphorylation. Cell Metab , 630–641. [DOI] [PMC free article] [PubMed] [Google Scholar]
- Muromoto R, Sekine Y, Imoto S, Ikeda O, Okayama T, Sato N, Matsuda T. (2008). BART is essential for nuclear retention of STAT3. Int Immunol , 395–403. [DOI] [PubMed] [Google Scholar]
- Newman LE, Schiavon C, Kahn RA. (2016). Plasmids for variable expression of proteins targeted to the mitochondrial matrix or intermembrane space. Cell Logist , e1247939. [DOI] [PMC free article] [PubMed] [Google Scholar]
- Newman LE, Schiavon CR, Turn RE, Kahn RA. (2017a). The ARL2 GTPase regulates mitochondrial fusion from the intermembrane space. Cell Logist , e1340104. [DOI] [PMC free article] [PubMed] [Google Scholar]
- Newman LE, Schiavon CR, Zhou C, Kahn RA. (2017b). The abundance of the ARL2 GTPase and its GAP, ELMOD2, at mitochondria are modulated by the fusogenic activity of mitofusins and stressors. PLoS One , e0175164. [DOI] [PMC free article] [PubMed] [Google Scholar]
- Newman LE, Zhou CJ, Mudigonda S, Mattheyses AL, Paradies E, Marobbio CM, Kahn RA. (2014). The ARL2 GTPase is required for mitochondrial morphology, motility, and maintenance of ATP levels. PLoS One , e99270. [DOI] [PMC free article] [PubMed] [Google Scholar]
- Radcliffe PA, Vardy L, Toda T. (2000). A conserved small GTP-binding protein Alp41 is essential for the cofactor-dependent biogenesis of microtubules in fission yeast. FEBS Lett , 84–88. [DOI] [PubMed] [Google Scholar]
- Rojo M, Legros F, Chateau D, Lombes A. (2002). Membrane topology and mitochondrial targeting of mitofusins, ubiquitous mammalian homologs of the transmembrane GTPase Fzo. J Cell Sci , 1663–1674. [DOI] [PubMed] [Google Scholar]
- Sharer JD, Shern JF, Van Valkenburgh H, Wallace DC, Kahn RA. (2002). ARL2 and BART enter mitochondria and bind the adenine nucleotide transporter. Mol Biol Cell , 71–83. [DOI] [PMC free article] [PubMed] [Google Scholar]
- Smirnova E, Griparic L, Shurland DL, van der Bliek AM. (2001). Dynamin-related protein Drp1 is required for mitochondrial division in mammalian cells. Mol Biol Cell , 2245–2256. [DOI] [PMC free article] [PubMed] [Google Scholar]
- Song Z, Chen H, Fiket M, Alexander C, Chan DC. (2007). OPA1 processing controls mitochondrial fusion and is regulated by mRNA splicing, membrane potential, and Yme1L. J Cell Biol , 749–755. [DOI] [PMC free article] [PubMed] [Google Scholar]
- Suzuki M, Murakami T, Cheng J, Kano H, Fukata M, Fujimoto T. (2015). ELMOD2 is anchored to lipid droplets by palmitoylation and regulates adipocyte triglyceride lipase recruitment. Mol Biol Cell , 2333–2342. [DOI] [PMC free article] [PubMed] [Google Scholar]
- Tanaka A, Cleland MM, Xu S, Narendra DP, Suen DF, Karbowski M, Youle RJ. (2010). Proteasome and p97 mediate mitophagy and degradation of mitofusins induced by Parkin. J Cell Biol , 1367–1380. [DOI] [PMC free article] [PubMed] [Google Scholar]
- Tian G, Thomas S, Cowan NJ. (2010). Effect of TBCD and its regulatory interactor Arl2 on tubulin and microtubule integrity. Cytoskeleton (Hoboken) , 706–714. [DOI] [PMC free article] [PubMed] [Google Scholar]
- Watzlich D, Vetter I, Gotthardt K, Miertzschke M, Chen YX, Wittinghofer A, Ismail S. (2013). The interplay between RPGR, PDEdelta and Arl2/3 regulate the ciliary targeting of farnesylated cargo. EMBO Rep , 465–472. [DOI] [PMC free article] [PubMed] [Google Scholar]
- Wurm CA, Neumann D, Lauterbach MA, Harke B, Egner A, Hell SW, Jakobs S. (2011). Nanoscale distribution of mitochondrial import receptor Tom20 is adjusted to cellular conditions and exhibits an inner-cellular gradient. Proc Natl Acad Sci USA , 13546–13551. [DOI] [PMC free article] [PubMed] [Google Scholar]
- Zanna C, Ghelli A, Porcelli AM, Karbowski M, Youle RJ, Schimpf S, Wissinger B, Pinti M, Cossarizza A, Vidoni S, et al. (2008). OPA1 mutations associated with dominant optic atrophy impair oxidative phosphorylation and mitochondrial fusion. Brain , 352–367. [DOI] [PubMed] [Google Scholar]
- Zhang Y, Liu X, Bai J, Tian X, Zhao X, Liu W, Duan X, Shang W, Fan HY, Tong C. (2016). Mitoguardin regulates mitochondrial fusion through MitoPLD and is required for neuronal homeostasis. Mol Cell , 111–124. [DOI] [PubMed] [Google Scholar]
- Zhou C, Cunningham L, Marcus AI, Li Y, Kahn RA. (2006). Arl2 and Arl3 regulate different microtubule-dependent processes. Mol Biol Cell , 2476–2487. [DOI] [PMC free article] [PubMed] [Google Scholar]
- Zunino R, Braschi E, Xu L, McBride HM. (2009). Translocation of SenP5 from the nucleoli to the mitochondria modulates DRP1-dependent fission during mitosis. J Biol Chem , 17783–17795. [DOI] [PMC free article] [PubMed] [Google Scholar]
Associated Data
This section collects any data citations, data availability statements, or supplementary materials included in this article.