

Abstract
This study examined the acute effects of the bench press exercise with low and moderate loads as well as with two predetermined movement velocity loss percentages on bench press throw performance and surface electromyographic (sEMG) activity. Ten trained men completed 5 main trials in randomized and counterbalanced order one week apart. Mean propulsive velocity (MPV), peak velocity (PV) and sEMG activity of prime movers were evaluated before and periodically for 12 minutes of recovery under five conditions: using loads of 40 or 60% of 1 RM, until mean velocity dropped to 90 or 70%, as well as a control condition (CTRL). MPV and PV were increased 4-12 min into recovery by 4.5-6.8% only after the 60%1RM condition during which velocity dropped to 90% and total exercise volume was the lowest of all conditions (p < 0.01, Hedges’ g = 0.8-1.7). When peak individual responses were calculated irrespective of time, MPV was increased by 9.2 ± 4.4 (p < 0.001, Hedges’ g = 1.0) and 6.1 ± 3.6% (p < 0.001, Hedges’ g = 0.7) under the two conditions with the lowest total exercise volume irrespective of the load, i.e. under the conditions of 40 and 60% 1RM where velocity was allowed to drop to 90%. sEMG activity of the triceps was significantly greater when peak individual responses were taken into account only under the 60%1RM condition when velocity dropped to 90% (p < 0.05, Hedges’ g = 0.4). This study showed that potentiation may be maximized by taking into account individual fatigue profiles using velocity-based training.
Key words: velocity loss, mean propulsive velocity, peak velocity, EMG activity
Introduction
The force or power exerted by a muscle may be increased or decreased depending on its preceding activity, due to the parallel development of postactivation potentiation (PAP) and fatigue (Hodgson et al., 2005; Rassier and Macintosh, 2000; Tillin and Bishop, 2009). Sports coaches employ conditioning activities, i.e. muscle actions aiming to enhance force and power output during complex training (Docherty and Hodgson, 2007), as well as during competition or a high quality training session, in order to maximize training gains and performance (Bogdanis et al., 2017; Kontochristopoulos et al., 2019).
During resistance training, coaches take advantage of PAP by performing “complex training” protocols, consisting of a resistance exercise followed shortly by a plyometric exercise (Bauer et al., 2019; Seitz and Haff, 2016). The characteristics of the preceding resistance exercise (i.e. volume and intensity) and recovery period play an important role in the balance between potentiation and fatigue, and determine the
timing and the magnitude of potentiation during the following plyometric exercise (French et al., 2003; Gilbert and Lees, 2007; Gullich and Schmidtbleicher, 1996; Wilson et al., 2013). In some cases, fatigue may prevail and subsequent muscle power performance may be decreased instead of increased (Bogdanis et al., 2014; Hamada et al., 2003; Tsoukos et al., 2016). Also, the time required for acute performance improvement may range from 1 to 12 min or even longer (Jo et al., 2010; Kilduff et al., 2007, 2008; Terzis et al., 2009).
Regarding the intensity of the conditioning activity (CA), a wide range of loads has been found to potentiate subsequent performance. Some authors reported that only high loads induced PAP (>90% of 1RM) compared with lower loads (40-70% of 1RM) (McBride et al., 2005; Rahimi, 2007), whereas others reported that low or moderate loads (25-60% of 1RM) may also improve subsequent muscle power (Smilios et al., 2005; Sotiropoulos et al., 2010). Thus, as a wide range of loads may acutely improve muscle power, it may be hypothesized that the volume of the CA is the most important factor, since it determines the magnitude of fatigue which masks PAP and reduces performance (Hamada et al., 2003). Regarding the mechanisms by which potentiation is achieved, there are myogenic and neural factors involved, with the latter being readily assessed by surface electromyography (sEMG) (Tillin and Bishop, 2009). However, there is conflicting evidence regarding changes in sEMG in parallel with force or power potentiation, with some researchers reporting an increase and others no change (Esformes et al., 2011; Gullich and Schmidtbleicher, 1996; Hodgson et al., 2008; Sotiropoulos et al., 2010).
A practical method for monitoring and quantifying the intensity and volume of resistance exercise, and therefore to control fatigue, is velocity-based resistance training (VBRT) (González-Badillo et al., 2011; Pareja-Blanco et al., 2017, 2019; Pérez-Castilla et al., 2018). This method involves the utilization of a linear position encoder or a linear velocity transducer or an accelerometer, to monitor the velocity of movement of the barbell in every repetition when the participant is performing resistance exercise (Balsalobre-Fernández et al., 2016; Garnacho-Castaño et al., 2015). The percentage of velocity loss from the first (usually faster) repetition to the last (usually slower) repetition, during a set of resistance exercise, is an indicator of neuromuscular fatigue (González-Badillo et al., 2017; Sanchez-Medina and Gonzalez-Badillo, 2011). Thus, VBRT may be employed in conditioning protocols, as it provides the opportunity to quantify fatigue and thus equalize it among participants who have different fatigue resistance characteristics, so that the effects of PAP on performance can be studied under “controlled” and “equalized” fatigue.
Taking into consideration the above and the results of several studies reporting that potentiation of performance following a CA is highly individual (Bogdanis et al., 2014; Gołaś et al., 2016; Kilduff et al., 2008; Maszczyk et al., 2016; Till and Cooke, 2009), it may be hypothesized that if the CA is performed up to a specific percentage of velocity loss, then fatigue will be controlled and equalized according to each participants’ fatigue resistance characteristics. This may partially separate the effects of fatigue and PAP on subsequent muscle performance, allowing for the determination of more effective conditioning protocols using different loads. Manipulation of the total exercise volume and thus fatigue is better achieved by using submaximal (25-60% of 1RM), rather than higher resistive loads (>85-90% 1 RM), as the number of repetitions that can be performed using heavy loads is very low. Thus, the purpose of the present study was to examine the acute effects of the bench press exercise with low (40% of 1RM) and moderate (60% of 1RM) loads as well as with two predetermined velocity loss percentages (i.e. a drop of 10 and 30% of the respective movement velocity) on performance of bench press throws (BPT) performed during the next 12 min. Surface electromyography (sEMG) of the pectoralis major and triceps Brachii muscles was also measured to examine changes in muscle activation during the BPT trials.
Methods
Participants
Power calculations indicated a minimum sample size of 8 participants would be needed to detect an effect size (ES) of 0.4, obtained from the average ES reported in the meta-analysis of Wilson et al. (2013) for the effects of CA on muscle power (repeated measures ANOVA power = 0.80, alpha = 0.05, correlation between repeated measures r = 0.5; G-Power 3.1.9.2).
Ten physically active men (age: 26.4 ± 6.5 years, body height: 1.82 ± 0.05 m, body mass: 84.7 ± 13.3 kg, % of body fat: 13.9 ± 5.9, 1 RM bench press: 106.0 ± 21.7 kg, relative strength: 1.26 ± 0.21 kg·kg-1) took part in the study. Participants had a training background in strength and power training of at least 3 years and were involved in recreational (gym training) and team sports (handball, soccer and basketball). All participants had no musculoskeletal injuries for at least 1 year prior to the study and were not taking any nutritional supplements or drugs. The study was conducted during the start of the transition period. Participants were moderately trained (3 days per week). After a thorough explanation of the testing protocol, the possible risks involved and the right to cease the participation at will, a written informed consent form was obtained from each participant. The study was approved by the local Institutional Review Board (Approval no. 1084/3-10-2018) and all procedures were in accordance with the Code of Ethics of the World Medical Association (Declaration of Helsinki of 1964, as revised in 2013).
Design and Procedures
A randomized and counterbalanced repeated measures design was used to examine the acute effects of bench press exercise performed on four separate occasions on subsequent bench press throw (BPT) performance and sEMG activity. The four different conditions involved two different loads and two predetermined velocity loss percentages. A low (40% of 1RM) and a moderate (60% of 1RM) load were employed, while participants performed repetitions as fast as possible, until mean movement velocity dropped by 10% (i.e. to 90% of mean velocity) or by 30% (i.e. to 70% of mean velocity).
Participants took part in four preliminary sessions. In the first preliminary visit, anthropometric data were obtained and participants were familiarized with the bench press throw exercise. In the second preliminary visit, the maximum dynamic bench press strength (1RM) was measured. In the next two visits, participants were familiarized with the CA performed against resistances of 40 and 60% of 1 RM, until mean velocity dropped to 90 or 70% of the peak attained during the respective resistance (90%v or 70%v). Participants were instructed to move the barbell as fast as possible during all phases of movement, i.e. eccentric-transition-concentric (Wilk et al., 2019), from the first repetition, and when mean velocity dropped to 90%v or 70%v, an audible beep was heard from the Tendo device and the set was immediately terminated.
Figure 1 shows the schematic representation of the study protocol. Five main trials were conducted 5-7 days apart in random and counterbalanced order. The conditions were as follows:
Figure 1.
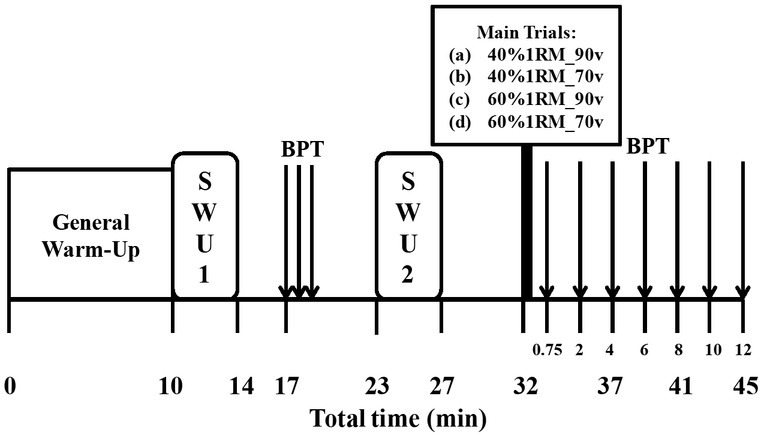
Schematic representation of the experimental trials. BPT: bench press throw, SWU: Specific Warm-Up.
-
(a)
40% of 1 RM, until mean velocity dropped to 90% of that attained (40%1RM_90v),
-
(b)
40% of 1 RM, until mean velocity dropped to 70% of that attained (40%1RM_70v),
-
(c)
60% of 1RM until mean velocity dropped to 90% of that attained (60%1RM_90v),
-
(d)
60% of 1RM until mean velocity dropped to 70% of that attained (60%1RM_70v), and
-
(e)
Control condition in which participants did not perform any CA, but only the BPT (CTRL).
After the standardized general and specific warm-up 1 (Figure 1), participants rested for 3 minutes and then performed 3 bench press throws with 30 s of recovery in between. The best performance was kept as baseline. Four minutes later the specific warm-up 2 was executed and then participants rested for five minutes. Subsequently, participants performed the CA or rested for 5 minutes (CTRL condition). After the CA, BPT performance was re-evaluated at the following time points: 45 s, 2, 4, 6, 8, 10 and 12 min. The dependent variables were BPT mean propulsive velocity and peak velocity, as well as the sEMG activity of the pectoralis major and triceps Brachii muscles during the 12 min following the CA.
General and Specific warm-up
Prior to each preliminary or experimental session, participants performed a standardized warm-up which consisted of 5 minutes of light cycling on a cycle ergometer (50-60 watt) and 5 minutes of dynamic stretching (Leone et al., 2014). After the general warm-up participants performed two specific warm-ups: one before the baseline measurements of the BPT and the other before performing the CA (Figure 1). The first specific warm-up (SWU 1) included two sets of BPT repetitions, against a resistance of 15% 1RM (6 repetitions) and 30% 1RM (4 repetitions) interspersed with a 3 min rest interval. The second specific warm-up (SWU 2) included one set of eight repetitions with 50% of the load that followed (40% or 60% 1RM) and one set of five repetitions with 75% of the load that followed (40% or 60% 1RM), with a 3 min rest interval in between.
Measurements
Anthropometric measurements
Anthropometric measurements were taken on the first preliminary visit. Body height was measured to the nearest 0.1 cm using a stadiometer (Charder HM-200P Portstad). Body mass was measured to the nearest 0.1 kg by a scale (TBF-300A Body Composition Analyzer-Tanita) and body fat content was estimated from 7 skinfold thicknesses (Jackson and Pollock, 1985) using a Harpenden skinfold calliper (British Indicators Ltd., Herts, England).
Maximum dynamic strength (1 RM)
Maximum dynamic strength (1 repetition maximum: 1 RM) in the bench press exercise was assessed (Brown and Weir, 2001) on the second preliminary visit on a Smith machine according to the procedures outlined by the National Strength and Conditioning Association (Haff and Triplett, 2016). Three body segments were supported by the bench, the head, shoulders and hips and the feet were placed flat on the floor with a knee angle of approximately 90°. Participants were instructed to use a closed pronated grip and were assisted by two experienced spotters who were strength & conditioning coaches. The spotters verbally encouraged participants and ensured their safety. The ICC for the 1RM measurement in the laboratory was 0.92 (Zaras et al., 2013).
Movement velocity measurements
Movement velocities were measured with a linear position transducer (Tendo Power Analyzer System v. 314, TENDO Sports Machines, Trencin, Slovak Republic). The validity and reliability of this system have been presented elsewhere (Garnacho-Castaño et al., 2015). Mean and peak velocities for each repetition were monitored during the CA. Mean propulsive velocity (MPV) and peak velocity during the concentric phase were measured during the bench press throws (BPT). Mean propulsive velocity has been defined as the mean velocity from the beginning of the concentric phase of the repetition until the instant at which peak velocity is reached (Sanchez-Medina et al., 2010). The ICCs for these measurements were as follows: mean velocity [0.983 (95%CI: 0.962-0.995], peak velocity [0.971 (95%CI: 0.932-0.992)], MPV in the BPT [0.985 (95%CI: 0.968-0.996)], peak velocity in the BPT [0.984 (95%CI: 0.966-0.995)].
Bench press throw (BPT)
The bench press throw exercise was performed on a Smith machine. Participants were instructed to hold the bar with the elbows fully extended. From this starting position they performed a fast counter-movement and then threw the bar as fast and as high as possible (West et al., 2013). Participants were asked to accelerate the barbell until the end of the range of motion, to keep their head and core in contact with the bench and their feet with the floor (West et al., 2013). After the execution of the BPT two spotters caught and lowered the loaded bar in order to ensure the safety of the participants (Brown and Weir, 2001; García-Ramos et al., 2018; West et al., 2013).
Surface electromyographic (sEMG) activity
Surface electromyographic (sEMG) activity of the pectoralis major (pars sternocostalis) and triceps brachii (lateral head) muscles of the right side of the body was recorded (Biopac MP35, systems Inc., Santa Barbara, CA) and analyzed (Acqknowledge 4.2.0, Biopac Systems Inc., Santa Barbara, CA). Bipolar Ag/AgCl electrodes were attached to the skin (inter-electrode distance: 20 mm) according to the recommendations of SENIAM (Hermens et al., 2000). The ground electrode for the recorded muscles was placed on the clavicle. The surface of the skin was shaved, cleaned using alcohol, and rubbed with fine sandpaper to keep the impedance between the two electrodes low. sEMG recordings were sampled at 1000 Hz, amplified (gain = 1000), and filtered (band pass = 10-500). sEMG activity of the muscles was calculated as Root Mean Square (RMS) value between the onset and the end of the burst. The onset of each burst was defined when the mean baseline sEMG activity exceeded the threshold value of 3 standard deviations. The RMS values of both muscles during BPTs were normalized to the RMS values during the 1 RM bench press (Schick et al., 2010). The ICCs for the sEMG activity measurement for pectoralis major and triceps brachii were 0.974 (95%CI: 0.943-0.992) and 0.982 (95%CI: 0.961-0.995).
Statistical analyses
Statistical analyses were carried out using the SPSS Statistics Ver. 23 (IBM Corporation, USA). All data are presented as means and standard deviations (SD). The acute effects of the conditioning bench press exercise on the dependent variables were examined by three-way repeated measures ANOVA (load x velocity drop x time). Two-way repeated measures ANOVA was also conducted to determine differences between the experimental conditions for the CA variables (load x velocity drop). A Tukey’s post– hoc test was performed when a significant main effect or interaction was observed. The effect sizes for main effects and interactions were determined by Partial eta squared (η2) values. Partial eta squared (η2) values were classified as small (0.01 to 0.059), moderate (0.06 to 0.137) and large (>0.137). For pairwise comparisons, the effect size (ES) was determined by Hedges’ g (small, <0.3; medium, 0.3–0.8; large, >0.8). The intraclass correlation coefficient (ICC) was calculated using a two-way mixed model to determine test-retest reliability for all dependent variables. A paired samples t-test was conducted to compare the load used during the 40 and 60%1RM conditions. Relationships between variables were obtained by calculating the Pearson product-moment correlation coefficient. Statistical significance was set at p < 0.05.
Results
Conditioning activity variables during the bench press
During the main trials the lifted load in the bench press exercise during the 60% 1RM condition was significantly greater than the load lifted during the 40% 1RM condition (Table 1) (t = 15.4; p < 0.001; Hedges’ g = 1.8). The total number of repetitions was significantly different between conditions (p < 0.01; η2 = 0.82). Tukey post hoc tests showed that all repetitions across the conditions differed (p < 0.001; Hedges’ g = 2.5-6.7) except the comparison of the 40%1RM_90v with 60%1RM_70v (Table 1) (p = 0.70). The volume load, calculated as the product of the load lifted multiplied by the number of repetitions, was significantly different between conditions (p<0.05; η2 = 0.37). Tukey post hoc tests showed that all the volumes across all the conditions differed (p < 0.03; Hedges’ g = 0.9-2.8).
Table 1.
Characteristics of the Conditioning Activity (CA) across main trials. Values are presented as mean ± SD. Max and min numbers of repetitions refer to the highest and lowest valued recorded in the individual data
| Experimental Conditions | ||||
|---|---|---|---|---|
| Variables | 60%1RM_90v | 40%1RM_90v | 60%1RM_70v | 40%1RM_70v |
| Lifted Load (kg) | 63.6 ± 13.0* | 42.4 ± 8.7 | 63.6 ± 13.0* | 42.4 ± 8.7 |
| Number of repetitions | 6.8 ± 1.8§ | 14.4 ± 3.4# | 15.4 ± 4.4# | 31.3 ± 4.7§ |
| Volume load (kg) | 433 ± 131¥ | 629 ± 251¥ | 971 ± 312¥ | 1345 ± 423¥ |
| Max number of repetitions | 10 | 20 | 24 | 39 |
| Min number of repetitions | 4 | 7 | 11 | 25 |
*: p < 0.001 from 40%1RM conditions §: p < 0.01 from all other conditions #: p < 0.01 from 60%1RM_90v and 40%1RM _70v ¥: p < 0.05 from all other conditions
Mean velocity of the first and the last repetition in the bench press exercise during the CA is presented in Figure 2 (top panel). The 3-way ANOVA did not show a significant interaction (p = 0.20; η2=0.18). However, there was a significant interaction between velocity x time (p < 0.001; η2 = 0.77). Follow-up 2-way ANOVA (velocity x time) revealed a significant interaction for 60%1RM (p < 0.01; η2 = 0.83) as well as for 40%1RM (p < 0.01; η2 = 0.62) conditions, respectively. Tukey post hoc tests showed a significant decrement in mean velocity from the first to the last repetition for 60%1RM_90v (p < 0.01; Hedges’ g = 0.8), 60%1RM_70v (p < 0.01; Hedges’ g = 2.6) and 40%1RM_70v (p < 0.01; Hedges’ g = 2.5) (Figure 2). No significant difference was observed under the 40%1RM_90v condition (p = 0.19). There was a significant difference in mean velocity between the last repetitions for 60%1RM_90v and 60%1RM_70v (p < 0.01; Hedges’ g = 2.2) as well as between 40%1RM_90v and 40%1RM_70v (p < 0.01; Hedges’ g = 2.5). No difference was observed between the first repetitions for 60%1RM_90v and 60%1RM_70v in the mean velocity (p > 0.01) as well as between the first repetitions for 40%1RM_90v and 40%1RM_70v (p > 0.01).
Figure 2.
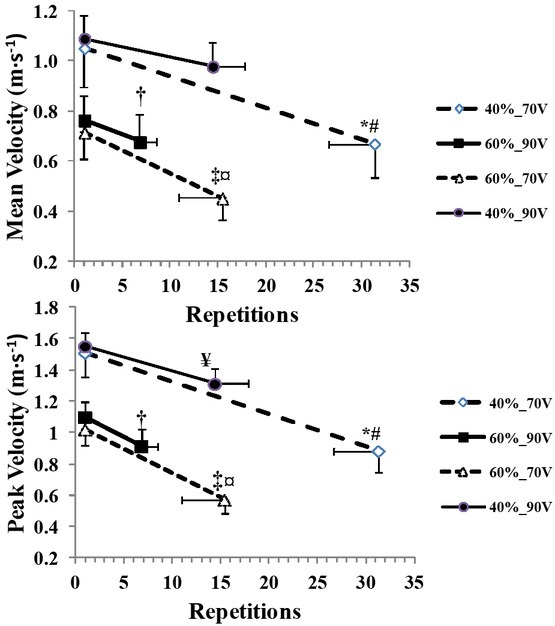
Mean and peak velocity of the first and last repetitions during the conditioning activity (CA) across the experimental conditions compared with the number of repetitions. Values are presented as mean ± SD. *: p < 0.01 between the first and the last repetition under the 40%_70v condition. #: p < 0.01 between the last repetitions of 40%_90v and 40%_70v. †: p < 0.01 between the first and the last repetition under the 60%_90v condition. ‡: p < 0.01 between the first and the last repetition under the 60%_70v condition. ¤: p < 0.01 between the last repetitions of 60%_90v and 60%_70v. ¥: p < 0.01 difference between the first and the last repetition under the 40%_90v condition.
Peak velocity of the first and last repetitions in the bench press exercise during the CA is presented in Figure 2 (bottom panel). The 3-way ANOVA did not present a significant interaction (p = 0.12; η2 = 0.25). However, there was a significant interaction between velocity and time (p < 0.001; η2 = 0.81). Follow-up 2-way ANOVA revealed a significant interaction (velocity x time) for 60% (p < 0.01; η2 = 0.81) as well as for 40% (p < 0.01; η2 = 0.73) conditions, respectively (Figure 2). Tukey post hoc tests showed a significant decrement in the peak velocity from the first to the last repetition for the 60%1RM_90v (p < 0.01; Hedges’ g = 1.2), 60%1RM_70v (p < 0.01; Hedges’ g =3.1), 40%1RM_90v (p < 0.01; Hedges’ g = 1.7) and 40%1RM_70v (p < 0.01; Hedges’ g = 3.4) condition (Figure 2). There was a significant difference between the last repetitions for 60%1RM_90v and 60%1RM_70v (p < 0.01; Hedges’ g = 2.4) as well as between 40%1RM_90v and 40%1RM_70v (p < 0.01; Hedges’ g = 2.8). No difference was observed between the first repetitions for 60%1RM_90v and 60%1RM_70v (p > 0.01) as well as between the first repetitions for 40%1RM_90v and 40%1RM_70v (p > 0.01).
Time course of mean propulsive velocity (MPV) during bench press throws
The time course of changes in MPV performance during the main trials is shown in Figure 3. Baseline values were similar in all five main trials (p > 0.05). The 3-way ANOVA revealed a significant interaction velocity x load x time points (p < 0.001, η2 = 0.29). Also, there was a significant 3-way ANOVA interaction for the best MPV performance irrespective of the time point (p < 0.001, η2 = 0.41).
Figure 3.
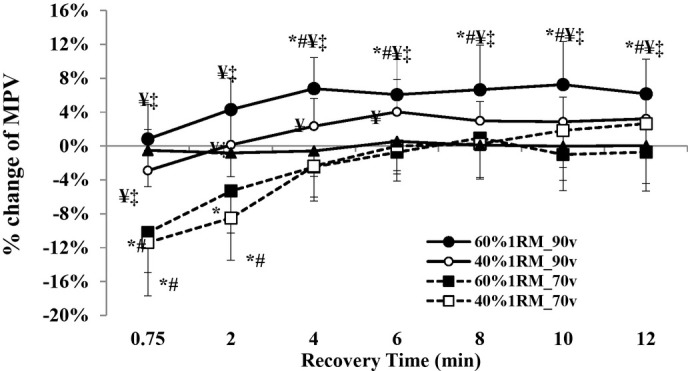
Time course of changes of mean propulsive velocity (MPV) performance during the bench press throws. Values are expressed as percent changes compared to baseline values. *: p < 0.01 from the corresponding baseline value. #: p < 0.01 from the corresponding value under the control condition. ¥: p < 0.01 from the corresponding value under the 60%_70v condition. ‡: p < 0.05 from the corresponding value under the 40%_70v condition.
60%1RM_90v
Tukey post-hoc tests showed that MPV performance was improved compared to baseline only under the 60%1RM_90v condition from the 4th (+6.8 ± 3.7%, p < 0.01, Hedges’ g = 0.8) to the 12th minute of recovery (+6.2 ± 4.1%, p < 0.01, Hedges’ g = 0.7). Also MPV performance during the 60%1RM_90v condition was greater compared to the CTRL condition from the 2nd (p = 0.02, Hedges’ g = 1.5) to the 12th minute of recovery (p < 0.001, Hedges’ g = 1.4). MPV performance was significantly greater under the 60%_90v condition compared to:
-
(a)
the 60%1RM_70v condition in all time points (p < 0.001, g > 1.1)
-
(b)
the 40%1RM_70v condition in all time points (p < 0.001, g > 1.1) except the 12th time point of recovery (p = 0.56).
The best MPV performance (Figure 4) during recovery for each participant irrespective of time was 9.2 ± 4.4% greater than baseline (p < 0.01, Hedges’ g = 1.0), and was observed at the 8.0 ± 2.8 minute of recovery. Also, the best MPV performance during recovery of the 60%1RM_90v condition was greater compared with the CTRL (p < 0.01, Hedges’ g = 1.6), 60%1RM_70v (p < 0.01, Hedges’ g = 1.6) and 40%1RM_70v (p < 0.05, Hedges’ g = 1.3). Although there was no statistically significant difference between the best MPV performance improvement under the 60%1RM_90v and 40%1RM_90v conditions (p = 0.41), the effect size of this comparison was moderate (Hedges’ g = 0.73)
Figure 4.
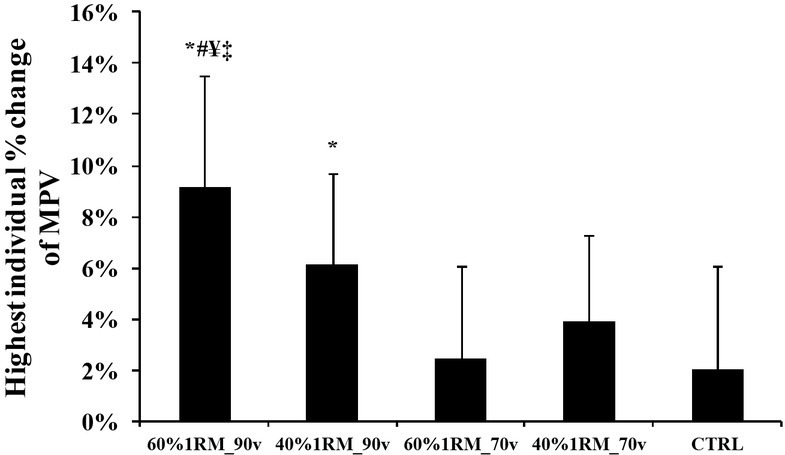
Percent change of mean propulsive velocity (MPV) during the bench press throws between baseline (PRE) and the best MPV, irrespective of the time attained during recovery. *: p < 0.01 from the corresponding baseline value. #: p < 0.01 from the corresponding value under the control condition. ¥: p < 0.01 from the corresponding value under the 60%_70v condition. ‡: p < 0.05 from the corresponding value under the 40%_70v condition. CTRL: control condition.
40%1RM_90v
Tukey post-hoc tests showed that only the best MPV performance irrespective of time was significantly better than baseline under the 40%1RM_90v condition by 6.1 ± 3.6% (p < 0.01, Hedges’ g = 0.7) and was observed at the 8.4 ± 3.1 minute of recovery. MPV performance was greater under the 40%1RM_90v condition compared to:
-
(a)
the 60%1RM_70v condition from the 0.75 (p < 0.001, Hedges’ g = 1.1) to the 6th time point (p < 0.05, Hedges’ g = 1.3).
-
(b)
the 40%1RM_70v condition at the 0.75 (p < 0.001, Hedges’ g = 1.9) and the 2nd (p < 0.001, Hedges’ g = 1.7) time point.
60%1RM_70v and 40%1RM_70v
The time course of MPV performance in the 60%1RM_70v was similar to 40%1RM_70v. Both conditions showed significant decreases compared to baseline immediately after the CA in the 0.75 and 2nd time points from -11.4 ± 3.5% (p < 0.001, Hedges’ g = 1.4) to -5.3 ± 5% (p < 0.001, Hedges’ g = 0.6). However, compared to the CTRL condition, only under the 40%1RM_70v condition MPV performance showed a significant decrease in 0.75 and 2nd time points of recovery, respectively (p < 0.001, Hedges’ g = 2.7 and 1.8, respectively), whereas the 60%1RM_70v condition showed a significant difference compared with the CTRL condition only in the 0.75 time point (p < 0.001, Hedges’ g = 1.5).
Time course of peak velocity during bench press throws
The time course of changes in peak velocity during the main trials is shown in Figure 5. Baseline values were similar in all five main trials (p > 0.05). The 3-way ANOVA revealed a significant interaction of velocity x load x time points (p < 0.001, η2 = 0.33). Also, there was a significant 3-way ANOVA interaction for the best peak velocity achieved irrespective of the time point (p < 0.001, η2 = 0.51).
Figure 5.
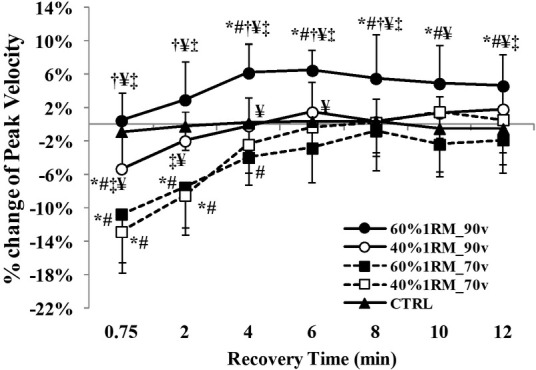
Time course of changes of peak velocity (PV) performance during the bench press throws. Values are expressed as percent changes compared to baseline values. *: p < 0.05 from the corresponding baseline value. #: p < 0.01 from the corresponding value under the control condition. ¥: p < 0.05 from the corresponding value under the 60%_70v condition. ‡: p < 0.01 from the corresponding value under the 40%_70v condition. †: p < 0.01 from the corresponding value under the 40%_90v condition.
60%1RM_90v
Tukey post-hoc tests showed that peak velocity was increased (Figure 5) compared to baseline only under the 60%1RM_90_v condition from the 4th (+6.2 ± 3.6%, p < 0.01, Hedges’ g = 0.7) to the 12th minute of recovery (+4.6 ± 3.8%, p < 0.01, Hedges’ g = 0.5). Also peak velocity during the 60%1RM_90_v condition was greater compared to the CTRL condition from the 4th (p < 0.001, Hedges’ g = 1.7) to the 12th minute of recovery (p < 0.001, Hedges’ g = 1.2). Peak velocity was significantly higher under the 60%_90_v condition compared to:
-
(a)
the 40%1RM_90v condition from the 0.75 (p < 0.001, Hedges’ g = 1.5) till the 8th minute (p < 0.001, Hedges’ g = 1.2) of recovery
-
(b)
(b) the 60%1RM_70v condition in all time points (p < 0.001, g > 1.2)
-
(c)
the 40%1RM_70v condition in all time points (p < 0.05, g > 1.2) except the 10th time point of recovery (p = 0.29).
Peak velocity during recovery for each participant irrespective of time was 7.5 ± 4.2% greater than baseline (p < 0.01, Hedges’ g = 0.8) (Figure 6) and was observed on the 7.0 ± 2.4 min of recovery. Also, the best PV performance during recovery of the 60%1RM_90v condition was greater compared with the CTRL (p < 0.05, Hedges’ g = 1.2) and 60%1RM_70v (p < 0.01, Hedges’ g = 1.7). Although there was no statistically significant difference between the best MPV performance improvement under the 60%1RM_90v and 40%1RM_90v conditions (p = 0.23), the effect size of this comparison was large (Hedges’ g = 1.0). A strong correlation was observed between the number of repetitions and time when the best individual response was attained under the 60%1RM_90v condition (r = 0.58; p = 0.04).
Figure 6.

Percent change of peak velocity (PV) during the bench press throws between baseline and the highest peak velocity, irrespective of the time achieved during recovery. *: p < 0.01 significantly different from the corresponding baseline value. #: p < 0.05 significantly different from the corresponding value under the control condition. ¥: p < 0.01 significantly different from the corresponding value under the 60%_70v condition. CTRL: control condition
40%1RM _90v
Tukey post-hoc tests showed that only the best peak velocity irrespective of time, was significantly higher (Figure 6) than baseline under the 40%_90_v condition by 3.9 ± 2.3% (p = 0.01, Hedges’ g = 0.4). This was observed on the 9.6 ± 3.1 minute of recovery.
Also the 0.75 time point peak velocity was significantly decreased than baseline under the 40%1RM_90_v condition (p < 0.001, Hedges’ g = 0.6) and compared with the CTRL condition (p < 0.05, Hedges’ g = 1.0). Peak velocity was higher under the 40%1RM_90v condition compared with the 40%1RM_70v condition at the 0.75 (p < 0.001, Hedges’ g = 1.6) and the 2nd (p < 0.001, Hedges’ g = 1.5) time point. Peak velocity under the 40%1RM_90v condition was significantly higher compared with the 60%1RM_70v condition at the 0.75 (p < 0.001, Hedges’ g = 1.0), the 2nd (p < 0.001, Hedges’ g = 1.3) and the 6th time points (p < 0.05, Hedges’ g = 1.1).
60%1RM _70v and 40%1RM _70v
The time course of peak velocity under the 60%1RM_70v condition was similar to the 40%1RM_70v. Both conditions showed significant decreases compared to baseline immediately after the CA at the 0.75 and 2nd time points from -12.8 ± 5.0% (p < 0.001, Hedges’ g = 1.4) to -7.5 ± 4.8% (p < 0.001, Hedges’ g = 0.9). Compared to the CTRL condition, the 60%1RM_70v condition presented significant decreases from the 0.75 (p < 0.001, Hedges’ g = 1.8) to the 4th time point (p < 0.05, Hedges’ g = 1.2), whereas the 40%1RM_70v condition showed a significant decrease only at the 0.75 (p < 0.001, Hedges’ g = 2.4) and the 2nd time point (p < 0.001, Hedges’ g = 2.0). No significant difference was observed between the two conditions at any time point (p > 0.05).
Time course of sEMG activity (RMS) of the pectoralis major and triceps brachii muscles
The time course of changes of sEMG activity (RMS) of the pectoralis major muscle during the main trials is shown in Table 2. The 3-way ANOVA showed a non-significant 3-way interaction (velocity x load x time, p = 0.83, η2 = 0.07). Furthermore, no 3-way interaction was observed in the ANOVA where only the baseline and the sEMG pectoralis major muscle activity during the best MPV performance (irrespective of the time point of recovery) was considered (p = 0.98, η2 < 0.01).
Table 2.
Time course of changes of sEMG activity (RMS) of the pectoralis major muscle. Values are normalized as a percentage to 1RM sEMG activity (RMS) and expressed as mean ± SD. The BEST time point refers to the sEMG activity of the best mean propulsive velocity (MPV) performance during recovery.
| EMG activity of the Pectoralis Major | |||||
|---|---|---|---|---|---|
| Conditions | |||||
| Time Points (min) | 60%1RM_90V | 40%1RM_90V | 60%1RM_70V | 40%1RM_70V | CTRL |
| PRE | 39.9 ± 20.5 | 37.4 ± 15.5 | 34.9 ± 14.8 | 37.1 ± 18.2 | 40.9 ± 20.3 |
| 0.75 | 40.9 ± 19.0 | 36.8 ± 15.7 | 34.2 ± 16.1 | 36.7 ± 20.9 | 42.7 ± 22.9 |
| 2 | 45.4 ± 26.3 | 41.7 ± 19.6 | 39.8 ± 22.5 | 38.5 ± 20.6 | 43.0 ± 25.1 |
| 4 | 45.3 ± 23.3 | 40.8 ± 18.6 | 38.6 ± 18.1 | 39.9 ± 26.3 | 38.2 ± 17.0 |
| 6 | 45.0 ± 24.1 | 38.8 ± 17.1 | 38.3 ± 19.9 | 41.7 ± 22.4 | 45.4 ± 22.3 |
| 8 | 43.9 ± 20.8 | 39.2 ± 16.1 | 38.1 ± 18.7 | 40.3 ± 23.6 | 41.6 ± 22.3 |
| 10 | 42.1 ± 19.9 | 40.6 ± 19.9 | 37.9 ± 18.1 | 36.6 ± 21.1 | 44.5 ± 23.8 |
| 12 | 43.8 ± 25.4 | 39.6 ± 16.8 | 38.3 ± 17.4 | 38.8 ± 20.3 | 46.2 ± 23.7 |
| BEST | 44.5 ± 20.3 | 38.3 ± 14.3 | 39.2 ± 18.8 | 38.8 ± 21.0 | 44.4 ± 22.1 |
The time course of changes of sEMG activity (RMS) of the triceps brachii muscle during the main trials is shown in Table 3. The 3-way ANOVA showed a non-significant interaction (velocity x load x time, p = 0.15, η2 = 0.17). However, there was a significant 3-way interaction in the ANOVA when only the baseline and the sEMG triceps brachii muscle activity during the best MPV performance (irrespective of the time point of recovery) was considered (p < 0.02, η2 = 0.43). Tukey post hoc tests revealed that the sEMG activity of the triceps brachii under the 60%1RM_90v condition was greater when compared with baseline (p < 0.001, Hedges’ g = 0.4), CTRL (p < 0.001, Hedges’ g = 0.3) and with the 40%1RM_70v condition (p < 0.001, Hedges’ g = 0.2).
Table 3.
Time course of changes of sEMG activity (RMS) of the triceps brachii muscle. Values are normalized as a percentage to 1RM sEMG activity (RMS) and expressed as mean ± SD. The BEST time point refers to the sEMG activity of the best mean propulsive velocity (MPV) performance.
| EMG activity of the Triceps Brachii | |||||
|---|---|---|---|---|---|
| Conditions | |||||
| Time Points (min) | 60%1RM_90v | 40%1RM_90v | 60%1RM_70v | 40%1RM_70v | CTRL |
| PRE | 39.5 ± 21.3 | 44.1 ± 22.3 | 42.7 ± 19.3 | 39.5 ± 21.1 | 43.8 ± 24.6 |
| 0.75 | 42.3 ± 22.4 | 44.3 ± 24.6 | 38.9 ± 19.6 | 38.5 ± 17.8 | 41.7 ± 23.8 |
| 2 | 45.9 ± 23.4 | 49.6 ± 28.0 | 37.7 ± 15.4 | 43.1 ± 24.4 | 45.0 ± 27.9 |
| 4 | 47.4 ± 25.0 | 48.2 ± 24.5 | 42.5 ± 19.4 | 43.9 ± 26.4 | 45.2 ± 25.2 |
| 6 | 45.6 ± 28.4 | 52.2 ± 28.4 | 44.3 ± 20.3 | 45.6 ± 23.1 | 41.6 ± 24.6 |
| 8 | 45.7 ± 21.7 | 50.6 ± 26.9 | 43.5 ± 21.5 | 42.6 ± 21.1 | 44.6 ± 30.5 |
| 10 | 48.9 ± 23.8 | 53.0 ± 30.5 | 42.8 ± 19.7 | 44.2 ± 23.5 | 46.5 ± 25.7 |
| 12 | 45.7 ± 24.7 | 47.4 ± 23.9 | 44.3 ± 17.8 | 46.2 ± 24.4 | 43.9 ± 27.1 |
| BEST | 50.8 ± 28.1*#§ | 49.5 ± 29.3 | 45.5 ± 17.6 | 44.7 ± 22.9 | 42.2 ± 23.9 |
*: p < 0.001 from baseline #: p < 0.01 from CTRL §: p < 0.05 from 40%1RM_70v
Discussion
The main finding of the present study was that BPT performance enhancement depended on the combination of the load and the degree of fatigue, i.e. drop of movement velocity, during the conditioning protocols. More specifically, the protocols that involved a lower level of fatigue, i.e. when mean movement velocity was allowed to decrease to 90% of that attained during the first repetitions, resulted in an improvement of performance of the order of 7-9% (Figures 4 and 6) In contrast, when participants were allowed to develop significant fatigue (i.e. when mean velocity dropped to 70%), fatigue prevailed over PAP and performance remained below or at baseline levels throughout the recovery period. Another main finding was that changes in the sEMG activity of the triceps and pectoralis major muscles, which are considered prime movers during the BPT, were observed only when sEMG during the individual best performances of MPV was examined and only for the triceps brachii muscle (Table 3).
One possible explanation for the improvements observed under the conditions where lower fatigue levels were reached, may be the low volume load of exercise performed (repetitions x load). The two conditions where the lower volume load was found were the ones that resulted in mean and peak velocity increases (Table 1). Despite the different load used (40 vs. 60% 1RM) and the two-fold higher number of repetitions performed under the 40%1RM_90v compared with the 60%1RM_90v condition (Table 1), there was an improvement in both PV and MPV that tended to be higher (p = 0.41 and 0.23 and Hedge’s g = 0.73 and 1.0, respectively) when the total load was lower (Figures 4 and 6) This may suggest that the most important factor for potentiation of performance during complex training is the volume load, rather than resistive load, at least for the loads used in the present study (40 vs. 60% 1RM). This is supported by the findings of several studies, reporting significant potentiation of performance using lower rather than high volumes of resistance training exercises (Rahimi, 2007; Ruben et al., 2010; Yetter and Moir, 2008). For example, Ruben et al. (2010) investigated the effects of an ascending squat protocol that consisted of 5 repetitions at 30% of 1 RM, 3 repetitions at 70% of 1RM, and 3 repetitions at 90% of 1RM on several performance variables during horizontal jumps and concluded that the main reason that there was no statistically significant improvement in performance was the relatively high training volume (1109.4 ± 234.2 kg). Those authors compared their findings with the results of the study of Yetter and Moir (2008) who found that back squats with a volume of 796.3 kg (which was 39.2% lower than that used in their study), improved 10 m and 40 m sprint performance. On the other hand, Rahimi (2007) reported that 40 m sprint time was improved more (2.98% vs. 1.09%) when the CA consisted of 2 sets of 4 repetitions each, using heavier (85% 1RM) vs. lighter (60% 1RM) loads. However, in that study the speed of movement was not controlled, and our findings suggest that performing the CA as fast as possible against each load may be an important variable in PAP using dynamic movements, as previously suggested (Wilk et al., 2019). Also, the results of the present study indicate the importance of minimizing fatigue during the CA by controlling the degree of velocity loss and thus total volume. For example, it may be hypothesized that reducing the total volume during the 40%1RM_90v protocol, in order to reach the volume load of 60%1RM_90v, may result in even greater improvement of performance, irrespective of the low load used, but this should be examined in future research.
Under the two conditions where significant fatigue was developed and movement velocity dropped to 70% of the mean velocity of the first repetition, BPT performance was decreased below the baseline values and remained at that level throughout recovery (Figures 3 and 5). It has been suggested that muscle performance following a CA during complex training depends on the balance between PAP and fatigue (Tillin and Bishop, 2009) and, as shown above and suggested by others (French et al., 2003; Hamada et al., 2003; Ruben et al., 2010; Yetter and Moir, 2008), the volume load of the conditioning exercise is decisive. The volume load during the conditions under which the velocity was allowed to decrease to 70% of the peak attained during the set, was more than 2-fold higher compared with the conditions where velocity was decreased to 90% (Table 1). The negative effects of an increased volume load of exercise are evident in the study of Hamada et al. (2003), who used a protocol of sixteen maximal voluntary isometric contractions of five seconds each to examine force changes. A large (126.4%) increase in twitch peak torque was evident in the second repetition of the protocol, when the volume load was still low, while a decrease of 32% below baseline was seen towards the end of the protocol, when the volume was high. This confirms that when the volume load is small, PAP is greater than fatigue and performance is enhanced, whereas when fatigue prevails, performance is decreased, despite the existence of PAP. Similarly, the results of the present study suggest that when the volume load is low, PAP is predominant over fatigue and performance is greater than baseline, while under the conditions when a large velocity loss is allowed fatigue prevails over PAP and performance is diminished.
As shown in Tables 2 and 3, there was no increase in the sEMG (RMS) activity of prime mover muscles under any condition during the time course of recovery. However, when individual responses of the best performance irrespective of the time attained were considered, the sEMG activity of the triceps brachii was found to be significantly higher under the 60%1RM_90v condition compared with baseline as well as with the 40%1RM_70v and the CTRL conditions. Changes in EMG activity during PAP protocols have been inconsistent in different studies (Esformes et al., 2011; Gullich and Schmidtbleicher, 1996; Hodgson et al., 2008; Sotiropoulos et al., 2010). For example, Esformes et al. (2011) examined the acute effects of different muscle conditioning contractions of the upper body on BPT performance, along with the EMG activity of the same muscles measured in the present study (pectoralis major and triceps brachii). The isometric protocol that they used produced significantly greater peak power 12 minutes after the CA compared with the baseline values, while EMG activity was not different. In agreement with the results of the previous study, Hodgson et al. (2008) investigated the effects of 3 sets of 5 s maximal isometric contractions on peak twitch torque, the rate of force development and H-reflex. Twitch peak torque and the rate of force development were significantly increased (p < 0.05), while H-reflex amplitudes remained unchanged. The authors concluded that PAP was unrelated to neural factors and was present peripherally at the level of muscle. In contrast, Sotiropoulos et al. (2010) found that during complex training using low and moderate loads (25-65% of 1 RM), EMG activity increased by 5.98.5%. However, all the above studies examined and compared EMG activity and performance responses at the different time-points during recovery, and therefore ignored individual responses regarding the time when peak values were attained for each participant. When the best individual responses during recovery irrespective of time were taken into account in the present study, increases in sEMG activity of the triceps brachii was evident under the condition where a significant performance increase was found, i.e. the 60%1RM_90v (Table 3). This finding is in agreement with a conclusion of a recent review of literature (Stastny et al., 2017) and with a recent study of Haun et al. (2017) showing that greater EMG amplitudes are related to higher force output. In addition, fatigue caused by performing a large volume of resistance exercise using a moderate load (50% 1RM, 4 sets of 20 repetitions) resulted in lower subsequent muscle performance and decreased EMG activity for 30 minutes into recovery (Smilios et al., 2010). Thus, it may be concluded that, at least under the 60%1RM_90v condition, part of the improvement of BPT performance was related to neural mechanisms, as indicated by the higher EMG activity of the triceps brachii. On the other hand, several studies have shown that elevated regulatory myosin light-chain phosphorylation is an important “myogenic” mechanism inducing PAP (Smith and Fry, 2007; Tillin and Bishop, 2009). Thus, the improvement of BPT performance under the 40%1RM_90v condition, as well as part of the improvement under the 60%1RM_90v condition, may be due to increased myosin light-chain phosphorylation, caused by the preceding muscle activity.
As also found in several previous studies, improvement in performance was observed between the 4th and the 12th minute of recovery (Bevan et al., 2009; Crewther et al., 2011; Kilduff et al., 2007; West et al., 2013). However, the magnitude of improvement in the present study was greater than that reported in previous studies. For example, Crewther et al. (2011) found that a single heavy (3 RM) set of back squat exercise improved vertical jump performance from the 4th to the 12th minute of recovery by 33.8%, whereas West et al. (2013) reported that peak power output of the arms improved 8 minutes after both heavy and light loads (87% of the bench press vs. 30% of the BPT) by approximately 3.6%. In the present study, MPV improvement during the 60%1RM_90v protocol was almost 2-fold higher compared with these studies (6.1-7.2%, see Figure 3). Even when the best individual improvement, irrespective of time, was calculated in the study of Crewther et al. (2011), the peak individual increase in vertical jump height (6.4 ± 2.1%) was 30% lower compared with the individual improvement in MPV (9.2 ± 4.4%, Hedge’s g for this comparison: 0.76; see Figure 4). The superior potentiation of performance in the present study may imply that measuring movement velocity and controlling fatigue during the CA maximize the gains in performance on an individual basis. This velocity-based method allows the individual fatigue profiles of participants to be taken into account when the aim is to maximize the benefits of complex training (Tillin and Bishop, 2009). Thus, velocity-based training may be used as a simple, but powerful method to potentiate muscle performance during complex training, by controlling total exercise volume according to the fatigue profile of each individual.
In the present study we observed large significant reductions of MPV and PV immediately after the conditions when fatigue was greater, i.e. when velocity of movement dropped to 70% of the peak attained. A recent similar study (Pareja-Blanco et al., 2019) compared four different protocols in terms of load (60 and 80%) and velocity loss (20 and 40%) in the squat exercise and measured the countermovement vertical jump, 20m sprint time and movement velocity against the load that elicited a 1 m·s-1 velocity, before and 10 s, 6 h, 24 h and 48 h later. Those authors observed that a larger exercise volume load, resulting from a greater velocity loss (by 40%) and the lower load of 60% of 1RM resulted not only in greater acute fatigue, but also in decreased vertical jump performance 6 and 24 h later. Those results suggest that a large volume of exercise results in greater fatigue and may impair subsequent performance, possibly due to metabolic fatigue (González-Badillo et al., 2011).
In conclusion, this study highlighted the effects of the volume load and the explosive execution of the conditioning exercise on subsequent explosive performance. Most importantly, it was shown that performance gains may be maximized by taking into account individual fatigue profiles, using velocity-based training. An increase in the conditioning exercise volume, irrespective of the load, may cause excessive fatigue and result in impaired performance. Due to the variability in individual responses to the conditioning protocols, it is advised to take into account the best individual improvement, irrespective of the time attained. The results of the present study provide useful data which may help strength and conditioning coaches to prescribe effective training programs during complex training, before competition or a high quality training session, in order to maximize training gains and performance. This will be achieved by individualizing the volume load of the conditioning exercise according to the fatigue profiles and by taking into account the time when peak performance occurs for each participant.
References
- Balsalobre-Fernández C, Kuzdub M, Poveda-Ortiz P, Campo-Vecino J Del. Validity and Reliability of the PUSH Wearable Device to Measure Movement Velocity During the Back Squat Exercise. J Strength Cond Res. 2016;30:1968–1974. doi: 10.1519/JSC.0000000000001284. [DOI] [PubMed] [Google Scholar]
- Bauer P, Uebellacker F, Mitter B, Aigner AJ, Hasenoehrl T, Ristl R, Tschan H, Seitz LB. Combining higher-load and lower-load resistance training exercises: A systematic review and meta-analysis of findings from complex training studies. J Sci Med Sport. 2019;22:838–851. doi: 10.1016/j.jsams.2019.01.006. [DOI] [PubMed] [Google Scholar]
- Bevan HR, Owen NJ, Cunningham DJ, Kingsley MIC, Kilduff LP. Complex training in professional rugby players: influence of recovery time on upper-body power output. J Strength Cond Res. 2009;23:1780–1785. doi: 10.1519/JSC.0b013e3181b3f269. [DOI] [PubMed] [Google Scholar]
- Bogdanis GC, Tsoukos A, Veligekas P. Improvement of long-jump performance during competition using a plyometric exercise. Int J Sports Physiol Perform. 2017;12:235–240. doi: 10.1123/ijspp.2016-0116. [DOI] [PubMed] [Google Scholar]
- Bogdanis GC, Tsoukos A, Veligekas P, Tsolakis C, Terzis G. Effects of muscle action type with equal impulse of conditioning activity on postactivation potentiation. J Strength Cond Res. 2014;28:2521–2528. doi: 10.1519/JSC.0000000000000444. [DOI] [PubMed] [Google Scholar]
- Brown L, Weir J. ASEP procedures recommendation I: accurate assessment of muscular strength and power. J Exerc Physiol Online. 2001;4:1–21. [Google Scholar]
- Crewther BT, Kilduff LP, Cook CJ, Middleton MK, Bunce PJ, Yang GZ. The acute potentiating effects of back squats on athlete performance. J Strength Cond Res. 2011;25:3319–3325. doi: 10.1519/JSC.0b013e318215f560. [DOI] [PubMed] [Google Scholar]
- Docherty D, Hodgson MJ. The application of postactivation potentiation to elite sport. Int J Sports Physiol Perform. 2007;2:439–444. doi: 10.1123/ijspp.2.4.439. [DOI] [PubMed] [Google Scholar]
- Esformes JI, Keenan M, Moody J, Bampouras TM. Effect of different types of conditioning contraction on upper body postactivation potentiation. J Strength Cond Res. 2011;25:143–148. doi: 10.1519/JSC.0b013e3181fef7f3. [DOI] [PubMed] [Google Scholar]
- French DN, Kraemer WJ, Cooke CB. Changes in dynamic exercise performance following a sequence of preconditioning isometric muscle actions. J Strength Cond Res. 2003;17:678–685. doi: 10.1519/1533-4287(2003)017<0678:cidepf>2.0.co;2. [DOI] [PubMed] [Google Scholar]
- García-Ramos A, Haff GG, Jiménez-Reyes P, Pérez-Castilla A. Assessment of Upper-Body Ballistic Performance Through the Bench Press Throw Exercise: Which Velocity Outcome Provides the Highest Reliability? J Strength Cond Res. 2018;32:2701–2707. doi: 10.1519/JSC.0000000000002616. [DOI] [PubMed] [Google Scholar]
- Garnacho-Castaño MV, López-Lastra S, Maté-Muñoz JL. Reliability and validity assessment of a linear position transducer. J Sports Sci Med. 2015;14:128–136. [PMC free article] [PubMed] [Google Scholar]
- Gilbert G, Lees A. Changes in the force development characteristics of muscle following repeated maximum force and power exercise. Ergonomics. 2007;48:1576–1584. doi: 10.1080/00140130500101163. [DOI] [PubMed] [Google Scholar]
- Gołaś A, Maszczyk A, Zajac A, Mikołajec K, Stastny P. Optimizing post activation potentiation for explosive activities in competitive sports. J Hum Kinet. 2016;52:95–106. doi: 10.1515/hukin-2015-0197. [DOI] [PMC free article] [PubMed] [Google Scholar]
- González-Badillo J, Marques M, Sánchez-Medina L. The Importance of Movement Velocity as a Measure to Control Resistance Training Intensity. J Hum Kinet. 2011;29:15–19. doi: 10.2478/v10078-011-0053-6. [DOI] [PMC free article] [PubMed] [Google Scholar]
- González-Badillo JJ, Yañez-García JM, Mora-Custodio R, Rodríguez-Rosell D. Velocity Loss as a Variable for Monitoring Resistance Exercise. Int J Sports Med. 2017;38:217–225. doi: 10.1055/s-0042-120324. [DOI] [PubMed] [Google Scholar]
- Gullich A, Schmidtbleicher D. MVC-induced short-term potentiation of explosive force. New Studies in Athletics. 1996:67–81. [Google Scholar]
- Haff GG, Triplett NT. Essentials of Strength Training and Conditioning. Champaign, IL: Human Kinetics; 2016. 4th ed. [Google Scholar]
- Hamada T, Sale DG, MacDougall JD, Tarnopolsky MA. Interaction of fibre type, potentiation and fatigue in human knee extensor muscles. Acta Physiol Scand. 2003;178:165–173. doi: 10.1046/j.1365-201X.2003.01121.x. [DOI] [PubMed] [Google Scholar]
- Haun CT, Mumford PW, Roberson PA, Romero MA, Mobley CB, Kephart WC, Anderson RG, Colquhoun RJ, Muddle TWD, Luera MJ, Mackey CS, Pascoe DD, Young KC, Martin JS, DeFreitas JM, Jenkins NDM, Roberts MD. Molecular, neuromuscular, and recovery responses to light versus heavy resistance exercise in young men. Physiol Rep. 2017;5:e13457. doi: 10.14814/phy2.13457. [DOI] [PMC free article] [PubMed] [Google Scholar]
- Hermens HJ, Freriks B, Disselhorst-Klug C, Rau G. Development of recommendations for SEMG sensors and sensor placement procedures. J Electromyogr Kinesiol. 2000;10:361–374. doi: 10.1016/s1050-6411(00)00027-4. [DOI] [PubMed] [Google Scholar]
- Hodgson M, Docherty D, Robbins D. Post-activation potentiation: underlying physiology and implications for motor performance. Sports Med. 2005;35:585–595. doi: 10.2165/00007256-200535070-00004. [DOI] [PubMed] [Google Scholar]
- Hodgson MJ, Docherty D, Zehr EP. Postactivation potentiation of force is independent of H-reflex excitability. Int J Sports Physiol Perform. 2008;3:219–231. doi: 10.1123/ijspp.3.2.219. [DOI] [PubMed] [Google Scholar]
- Jackson AS, Pollock ML. Practical Assessment of Body Composition. Phys Sportsmed. 1985;13:76–90. doi: 10.1080/00913847.1985.11708790. [DOI] [PubMed] [Google Scholar]
- Jo E, Judelson DA, Brown LE, Coburn JW, Dabbs NC. Influence of recovery duration after a potentiating stimulus on muscular power in recreationally trained individuals. J Strength Cond Res. 2010;24:343–347. doi: 10.1519/JSC.0b013e3181cc22a4. [DOI] [PubMed] [Google Scholar]
- Kilduff LP, Bevan HR, Kingsley MIC, Owen NJ, Bennett MA, Bunce PJ, Hore AM, Maw JR, Cunningham DJ. Postactivation potentiation in professional rugby players: optimal recovery. J Strength Cond Res. 2007;21:1134–1138. doi: 10.1519/R-20996.1. [DOI] [PubMed] [Google Scholar]
- Kilduff LP, Owen N, Bevan H, Bennett M, Kingsley MIC, Cunningham D. Influence of recovery time on post-activation potentiation in professional rugby players. J Sports Sci. 2008;26:795–802. doi: 10.1080/02640410701784517. [DOI] [PubMed] [Google Scholar]
- Kontochristopoulos N, Bogdanis GC, Paradisis G, Tsolakis C. Effect of a Supplementary Periodized Complex Strength Training and Tapering Period on Postactivation Potentiation of Sport-Specific Explosive Performance in Adolescent National-Level Fencers. J Strength Cond Res. 2019 doi: 10.1519/JSC.0000000000002967. Published Ahead of Print doi. [DOI] [PubMed] [Google Scholar]
- Leone DCPG, Pezarat P, Valamatos MJ, Fernandes O, Freitas S, Moraes AC. Upper body force production after a low-volume static and dynamic stretching. Eur J Sport Sci. 2014;14:69–75. doi: 10.1080/17461391.2012.729089. [DOI] [PubMed] [Google Scholar]
- Maszczyk A, Golas A, Czuba M, Krol H, Wilk M, Stastny P, Goodwin J, Kostrzewa M, Zajac A. EMG Analysis and Modelling of Flat Bench Press Using Artificial Neural Networks. SAJRSPER. 2016;38(1):91–103. [Google Scholar]
- McBride JM, Nimphius S, Erickson TM, Science E, Crosse L. The Acute Effects of Heavy-Load Squats and Loaded Countermovement Jumps on Sprint Performance. J Strength Cond Res. 2005;19:893–897. doi: 10.1519/R-16304.1. [DOI] [PubMed] [Google Scholar]
- Pareja-Blanco F, Rodríguez-Rosell D, Sánchez-Medina L, Sanchis-Moysi J, Dorado C, Mora-Custodio R, Yáñez-García JM, Morales-Alamo D, Pérez-Suárez I, Calbet JAL, González-Badillo JJ. Effects of velocity loss during resistance training on athletic performance, strength gains and muscle adaptations. Scand J Med Sci Sports. 2017;27:724–735. doi: 10.1111/sms.12678. [DOI] [PubMed] [Google Scholar]
- Pareja-Blanco F, Villalba-Fernández A, Cornejo-Daza PJ, Sánchez-Valdepeñas J, González-Badillo JJ. Time Course of Recovery Following Resistance Exercise with Different Loading Magnitudes and Velocity Loss in the Set. Sports (Basel) 2019;7:59. doi: 10.3390/sports7030059. [DOI] [PMC free article] [PubMed] [Google Scholar]
- Pérez-Castilla A, García-Ramos A, Padial P, Morales-Artacho AJ, Feriche B. Effect of different velocity loss thresholds during a power-oriented resistance training program on the mechanical capacities of lower-body muscles. J Sports Sci. 2018;36:1331–1339. doi: 10.1080/02640414.2017.1376900. [DOI] [PubMed] [Google Scholar]
- Rahimi R. The Acute Effects of Heavy versus Light-Load Squats on Sprint Performance. Phys Educ Sport. 2007;5:163–169. [Google Scholar]
- Rassier DE, Macintosh BR. Coexistence of potentiation and fatigue in skeletal muscle. Braz J Med Biol Res. 2000;33:499–508. doi: 10.1590/s0100-879x2000000500003. [DOI] [PubMed] [Google Scholar]
- Ruben RM, Molinari MA, Bibbee CA, Childress MA, Harman MS, Reed KP, Haff GG. The acute effects of an ascending squat protocol on performance during horizontal plyometric jumps. J Strength Cond Res. 2010;24:358–369. doi: 10.1519/JSC.0b013e3181cc26e0. [DOI] [PubMed] [Google Scholar]
- Sanchez-Medina L, Gonzalez-Badillo JJ. Velocity loss as an indicator of neuromuscular fatigue during resistance training. Med Sci Sports Exerc. 2011;43:1725–34. doi: 10.1249/MSS.0b013e318213f880. [DOI] [PubMed] [Google Scholar]
- Sanchez-Medina L, Perez CE, Gonzalez-Badillo JJ. Importance of the Propulsive Phase in Strength Assessment. Int J Sports Med. 2010;31:123–129. doi: 10.1055/s-0029-1242815. [DOI] [PubMed] [Google Scholar]
- Schick EE, Coburn JW, Brown LE, Judelson DA, Khamoui A V, Tran TT, Uribe BP. A Comparison of Muscle Activation Between a Smith Machine and Free Weight Bench Press. J Strength Cond Res. 2010;24:779–784. doi: 10.1519/JSC.0b013e3181cc2237. [DOI] [PubMed] [Google Scholar]
- Seitz LB, Haff GG. Factors Modulating Post-Activation Potentiation of Jump, Sprint, Throw, and Upper-Body Ballistic Performances: A Systematic Review with Meta-Analysis. Sports Med. 2016;46:231–240. doi: 10.1007/s40279-015-0415-7. [DOI] [PubMed] [Google Scholar]
- Smilios I, Häkkinen K, Tokmakidis SP. Power Output and Electromyographic Activity During and After a Moderate Load Muscular Endurance Session. J Strength Cond Res. 2010;24:2122–2131. doi: 10.1519/JSC.0b013e3181a5bc44. [DOI] [PubMed] [Google Scholar]
- Smilios I, Pilianidis T, Sotiropoulos K, Antonakis M, Tokmakidis S. Short-term effects of selected exercise and load in contrast training on vertical jump performance. J Strength Cond Res. 2005;19:135–139. doi: 10.1519/14463.1. [DOI] [PubMed] [Google Scholar]
- Smith JC, Fry AC. Effects of a ten-second maximum voluntary contraction on regulatory myosin light-chain phosphorylation and dynamic performance measures. J Strength Cond Res. 2007;21:73–76. doi: 10.1519/00124278-200702000-00014. [DOI] [PubMed] [Google Scholar]
- Sotiropoulos K, Smilios I, Christou M, Barzouka K, Spaias A, Douda H, Tokmakidis SP. Effects of Warm-up on Vertical Jump Performance and Muscle Electrical Activity Using Half-Squats at Low and Moderate Intensity. J Sports Sci Med. 2010;1:326–331. [PMC free article] [PubMed] [Google Scholar]
- Stastny P, Gołaś A, Blazek D, Maszczyk A, Wilk M, Pietraszewski P, Petr M, Uhlir P, Zając A. A systematic review of surface electromyography analyses of the bench press movement task. PLoS One. 2017;12:e017163. doi: 10.1371/journal.pone.0171632. [DOI] [PMC free article] [PubMed] [Google Scholar]
- Terzis G, Spengos K, Karampatsos G, Manta P, Georgiadis G. Acute effect of drop jumping on throwing performance. J Strength Cond Res. 2009;23:2592–2597. doi: 10.1519/JSC.0b013e3181b1b1a3. [DOI] [PubMed] [Google Scholar]
- Till K, Cooke C. The effects of postactivation potentiation on sprint and jump performance of male academy soccer players. J Strength Cond Res. 2009;23:1960–1967. doi: 10.1519/JSC.0b013e3181b8666e. [DOI] [PubMed] [Google Scholar]
- Tillin NA, Bishop D. Factors modulating post-activation potentiation and its effect on performance of subsequent explosive activities. Sports Med. 2009;39:147–166. doi: 10.2165/00007256-200939020-00004. [DOI] [PubMed] [Google Scholar]
- Tsoukos A, Bogdanis GC, Terzis G, Veligekas P. Acute Improvement of Vertical Jump Performance After Isometric Squats Depends on Knee Angle and Vertical Jumping Ability. J Strength Cond Res. 2016;30:2250–2257. doi: 10.1519/JSC.0000000000001328. [DOI] [PubMed] [Google Scholar]
- West DJ, Cunningham DJ, Crewther BT, Cook CJ, Kilduff LP. Influence of ballistic bench press on upper body power output in professional rugby players. J Strength Cond Res. 2013;27:2282–2287. doi: 10.1519/JSC.0b013e31827de6f1. [DOI] [PubMed] [Google Scholar]
- Wilk M, Krzysztofik M, Drozd M, Zajac A. Changes of Power Output and Velocity During Successive Sets of the Bench Press with Different Duration of Eccentric Movement. Int J Sports Physiol Perform. 2019;8:1–19. doi: 10.1123/ijspp.2019-0164. [DOI] [PubMed] [Google Scholar]
- Wilson JM, Duncan NM, Marin PJ, Brown LE, Loenneke JP, Wilson SMC, Jo E, Lowery RP, Ugrinowitsch C, Urginowitsch C. Meta-analysis of postactivation potentiation and power: Effects of conditioning activity, volume, gender, rest periods, and training status. J Strenght Cond Res. 2013;27:854–859. doi: 10.1519/JSC.0b013e31825c2bdb. [DOI] [PubMed] [Google Scholar]
- Yetter M, Moir GL. The acute effects of heavy back and front squats on speed during forty-meter sprint trials. J Strength Cond Res. 2008;22:159–65. doi: 10.1519/JSC.0b013e31815f958d. [DOI] [PubMed] [Google Scholar]
- Zaras N, Spengos K, Methenitis S, Papadopoulos C, Karampatsos G, Georgiadis G, Stasinaki A, Manta P, Terzis G. Effects of strength vs. Ballistic-power training on throwing performance. J Sports Sci Med. 2013;12:130–137. [PMC free article] [PubMed] [Google Scholar]