

Abstract
Identifying transcription factor (TF) binding to noncoding variants, uncharacterized DNA motifs, and repetitive genomic elements has been technically and computationally challenging. Current experimental methods, such as chromatin immunoprecipitation, generally test one TF at a time, and computational motif algorithms often lead to false-positive and -negative predictions. To address these limitations, we developed an experimental approach based on enhanced yeast one-hybrid assays. The first variation of this approach interrogates the binding of >1000 human TFs to repetitive DNA elements, while the second evaluates TF binding to single nucleotide variants, short insertions and deletions (indels), and novel DNA motifs. Using this approach, we detected the binding of 75 TFs, including several nuclear hormone receptors and ETS factors, to the highly repetitive Alu elements. Further, we identified cancer-associated changes in TF binding, including gain of interactions involving ETS TFs and loss of interactions involving KLF TFs to different mutations in the TERT promoter, and gain of a MYB interaction with an 18-bp indel in the TAL1 superenhancer. Additionally, we identified TFs that bind to three uncharacterized DNA motifs identified in DNase footprinting assays. We anticipate that these enhanced yeast one-hybrid approaches will expand our capabilities to study genetic variation and undercharacterized genomic regions.
The study of transcription factor (TF) binding to different genomic regions, and how TF binding is affected by noncoding variants, is critical for understanding the mechanisms by which gene expression is controlled in normal and pathogenic conditions (Gerstein et al. 2012; Fuxman Bass et al. 2015). Chromatin immunoprecipitation followed by high-throughput sequencing (ChIP-seq) has been instrumental in identifying the genomic regions occupied by TFs and for studying TF function (Robertson et al. 2007; Gerstein et al. 2012). However, it has been challenging to use ChIP-seq to address many central human functional genomics problems such as determining whether disease-associated single nucleotide variants (SNVs) and short insertions/deletions (indels) in noncoding regions alter TF binding, as well as identifying TFs that bind to specific DNA motifs and repetitive genomic DNA elements.
Experimentally determining whether TF binding is altered by genomic variants associated with genetic diseases or cancer has been challenging as this cannot be performed using ChIP-seq without a priori TF candidates. This is because all ∼1500 human TFs would have to be evaluated individually and because samples from the appropriate tissues and conditions from healthy and sick individuals need to be obtained and compared (Fuxman Bass et al. 2015; Gan et al. 2018). Thus, the most widely used approach to prioritize TFs consists of using known DNA-binding specificities (available for ∼50% of human TFs) (Weirauch et al. 2014) and motif search algorithms such as FIMO, BEEML-PBM, or TFM-PVALUE to compare predicted TF binding between the different noncoding alleles (Touzet and Varré 2007; Grant et al. 2011; Zhao and Stormo 2011; Weirauch et al. 2014; Rheinbay et al. 2017). However, this approach often results in multiple false positive and false negative predictions given that: (1) DNA motifs are missing for nearly half of the known human TFs (Weirauch et al. 2014); (2) most predicted DNA motifs in the genome are not occupied by the TF in vivo (Zia and Moses 2012); (3) multiple genomic regions occupied by TFs do not contain the corresponding TF binding sites (Gheorghe et al. 2019); and (4) sequence preferences determined using naked DNA may be different for sequence preference on nucleosomal DNA (Talebzadeh and Zare-Mirakabad 2014; Zhu et al. 2018).
Many genomic regions identified by DNase I or ATAC-seq footprinting studies are occupied by unidentified proteins, which in many cases are bound in a sequence-specific manner (Neph et al. 2012; Ramirez et al. 2017). Indeed, using genome-wide DNase I footprinting, the ENCODE Project identified 683 de novo motifs, 289 of which could not be matched to any TF based on known DNA-binding specificities (Neph et al. 2012). Due to the lack of TF candidates, it is nearly impossible to use ChIP-seq to identify the TFs interacting with these genomic sites, as hundreds of TFs would need to be tested in each of the cell lines where the footprints were found. Thus, most of the novel DNA motifs derived from DNase I footprinting remain uncharacterized.
More than half of the human genome is comprised of tandem or interspaced repetitive DNA elements, many located within promoter, enhancer, and silencer sequences (International Human Genome Sequencing Consortium 2001). It is challenging to study TF binding to these repetitive genomic elements by ChIP-seq, not only because hundreds of TFs need to be assayed, but also because repetitive DNA sequences are difficult to map to the reference genome and are thus often filtered out in most bioinformatics analysis pipelines (Rozowsky et al. 2009; Chung et al. 2011). This is particularly true for highly repetitive DNA elements such as the Alu short interspaced nuclear elements, which are present in more than one million copies in the human genome (Deininger 2011).
Enhanced yeast one-hybrid (eY1H) assays provide an alternative approach to ChIP-seq, where physical interactions between TFs and DNA regions are tested in the milieu of the yeast nucleus using reporter genes (Reece-Hoyes et al. 2011; Sewell and Fuxman Bass 2018). eY1H assays involve two components: a ‘DNA-bait’ (e.g., a genomic variant, a novel DNA motif, or a repetitive element) and a ‘TF-prey.’ DNA-baits are cloned upstream of two reporter genes (HIS3 and LacZ) and integrated into the yeast genome. The DNA-bait yeast strains are then mated with TF-prey strains that express TFs fused to the yeast Gal4 activation domain (AD) to generate diploid yeast containing both bait and prey. If the TF-prey binds to the DNA-bait, the AD will induce reporter expression which can be measured by the conversion of the colorless X-gal to a blue compound (by the β-galactosidase enzyme encoded by LacZ), and by the ability of the yeast to grow on media lacking histidine even in the presence of 3-amino-1,2,4-triazole (a competitive inhibitor of the His3 enzyme [also known as His3p]). As TFs are fused to the Gal4 AD, interactions with both activators and repressors can be detected (Deplancke et al. 2006; Fuxman Bass et al. 2015, 2016a).
Given that eY1H assays can be used to analyze the DNA-binding activity of more than 1000 TFs in a single experiment, this framework is particularly well-suited to identify the set of TFs that bind to a DNA region of interest (rather than the sets of DNA regions bound by TFs as in ChIP-seq). In particular, eY1H assays (and other variations of the assay) have been used to identify the repertoire of TFs that potentially bind to gene promoters and enhancers in humans, mice, nematodes, flies, and plants (Brady et al. 2011; Hens et al. 2011; Gubelmann et al. 2013; Reece-Hoyes et al. 2013; Burdo et al. 2014; Fuxman Bass et al. 2015, 2016a). Recently, we generated a resource of 1086 (of ∼1500) human TFs representing all major TF families (Fuxman Bass et al. 2015). Using this resource, we have detected interactions involving 293 TFs against DNA sequences corresponding to ∼0.3 Mb of the human genome (Fuxman Bass et al. 2015; Carrasco Pro et al. 2018). Of the major human TF families involved in these interactions, only Cys2His2 zinc fingers were underrepresented (50% of expected), whereas homeodomains and nuclear hormone receptors were overrepresented.
Using eY1H assays, we have also determined altered TF binding to 109 SNVs associated with different genetic diseases, including immune disorders, developmental malformations, cancer, and neurological disorders (Fuxman Bass et al. 2015). This pipeline was based on PCR from human genomic DNA using wild-type and mutated primers to generate the DNA-baits. As a consequence, the approach used was not well-suited to clone and study indels (unless patient DNA samples are used), as using primers containing multiple mismatches often leads to PCR failure when using genomic DNA as template, or to study novel DNA motifs derived from footprinting studies using tandem copies. In addition, the eY1H pipeline was not previously adapted to clone repetitive DNA elements en masse given that the cloning steps were optimized for primers annealing to unique genomic DNA regions. Here, we present an eY1H-based approach that overcomes these limitations which we use to evaluate TF binding to repetitive DNA elements such as Alu sequences and to short DNA sequences to study SNVs, indels, and novel DNA motifs. Overall, this eY1H-based approach provides a new toolkit to answer genomic questions that have been challenging to address using current experimental and computational approaches.
Results
TF binding to repetitive DNA elements
To illustrate the power of eY1H assays to identify TFs that bind to repetitive elements, we evaluated Alu sequences, a type of short interspaced nuclear element present in more than one million copies in the human genome (Batzer and Deininger 2002). These sequences are classified in three main families: the ancestral AluJ, the derived AluS, and the more recently evolved AluY elements, and can differ up to 20% from their consensus sequence due to SNVs, indels, and truncations (Deininger et al. 1981; Batzer and Deininger 2002). Studying TF binding to Alu sequences is particularly important given that these sequences are embedded within gene promoters, enhancers, and introns and have been shown to play key roles in gene regulation (Batzer and Deininger 2002; Deininger 2011). In addition, Alu sequences are often silenced by mechanisms that are not fully understood, which could in part be mediated by transcriptional repressors (Humphrey et al. 1996; Kondo and Issa 2003).
To evaluate TF binding to these repetitive elements, we cloned 20 random Alu sequences into our eY1H pipeline (Fig. 1; Supplemental Table S1). This was performed using degenerate primers complementary to the 5′ and 3′ ends of Alu sequences, which allowed us to obtain clones belonging to different Alu families (AluJ, AluS, and AluY) (Supplemental Fig. S1). Using eY1H assays, we identified 75 TFs that bind to at least one Alu sequence and 34 TFs that bind to at least 20% of the 20 Alu sequences tested (Fig. 2A; Supplemental Table S2). Alu sequences are enriched in binding to TFs belonging to the nuclear hormone receptor (NHR), zinc finger DHHC (ZF-DHHC), ETS, and regulatory factor X (RFX) families compared to the array of TFs tested (Fig. 2B). Of note, we did not detect interactions with NHR or ZF-DHHC TFs for the two AluJ and a subset of AluS sequences tested, suggesting that binding sites for these TFs arose sometime during AluS divergence. Other than this, differences in TF binding between Alu sequences do not seem to cluster by Alu family, likely because of differences in deletions and truncations within family members (Supplemental Fig. S1).
Figure 1.
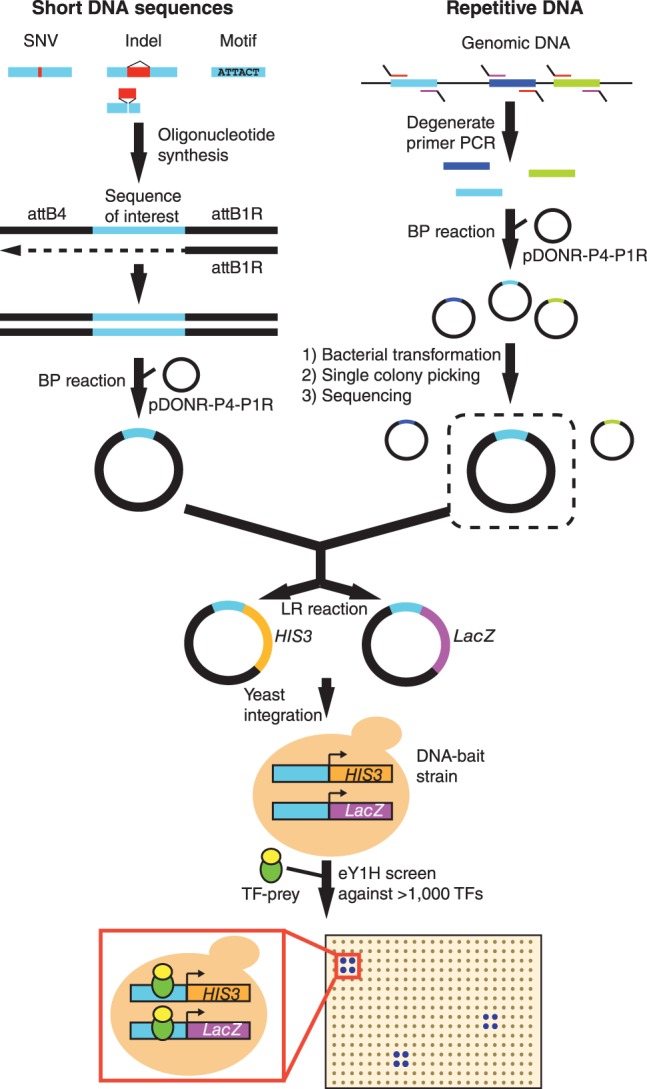
eY1H assays to test short DNA sequences and repetitive DNA elements. Short DNA sequences are synthesized flanked by the attB4 and attB1R Gateway sites. The reverse strand is synthesized by primer extension (attB1R). The double-stranded DNA generated is cloned into the pDONR-P4-P1R vector by Gateway BP reaction. Repetitive DNA sequences are amplified from genomic DNA using degenerate primers flanked by the attB4 (forward) or the attB1R (reverse) sites. The repetitive element DNA library generated is cloned en masse into the pDONR-P4-P1R vector, and individual sequences are selected after bacterial transformation and picking of individual colonies. Both short DNA sequences and repetitive DNA are then transferred into eY1H reporter vectors (HIS3 and LacZ) and integrated into the yeast genome to generate chromatinized DNA-bait strains. DNA-bait strains are tested for interactions against an array of 1086 human TF-preys (TFs fused to the yeast Gal4 activation domain) by mating. Interactions are identified by the ability of yeast colonies to grow in the absence of histidine and in the presence of the His3p inhibitor 3-amino-1,2,4-triazole and to turn blue in the presence of the β-galactosidase substrate X-gal. Interactions are tested in quadruplicate.
Figure 2.

Identification of TFs that interact with Alu sequences. (A) TFs that interact with 20% or more of the Alu sequences tested were identified using eY1H assays. TFs and Alu sequences are ordered by family. (B) Distribution by family for TFs that interact with at least 20% of the Alu sequences tested, compared to the distribution of TFs in the eY1H array. (NHR) nuclear hormone receptor, (ZF-DHHC) zinc finger DHHC, (ZF-C2H2) zinc finger Cys2His2, (HD) homeodomain, (ETS) E26 transformation-specific, (HMG) high mobility group, (RFX) regulatory factor X, (bHLH) basic helix-loop-helix, (bZIP) basic leucine zipper domain. (*) P < 0.05 by proportion comparison test after Bonferroni correction. (C,D) The number of Alu sequences in ChIP-seq peaks (C) and the average number of Alu sequences per peak (D) are plotted for TFs that bind at least 20% of Alu sequences by eY1H assays (red) and TFs for which we did not detect binding to Alu sequences (blue). ChIP-seq data was obtained from the ENCODE Project for the K562 and HepG2 cell lines. Violin plots are shown, and the median is indicated by a solid black line. Statistical significance determined by two-tailed Student's t-test with Welch's correction for unequal variances. (E) Comparison between the number of protein-DNA interactions (PDIs) detected per element for Alu and alphoid sequences. Violin plots are shown, and the median is indicated by a solid black line. Statistical significance determined by two-tailed Mann–Whitney U test.
To determine whether the identified TFs can bind Alu sequences in vivo, we determined the overlap between Alu sequences and ChIP-seq peaks from the ENCODE Project (The ENCODE Project Consortium 2012). We found that ChIP-seq peaks from TFs that interacted with at least 20% of Alu sequences by eY1H assays overlap with thousands of Alu sequences in K562 and HepG2 cells (Fig. 2C). Further, we found that Alu-binding TFs overlap with more Alu sequences than non-Alu binding TFs in K562 cells (Fig. 2C). Although for HepG2 cells this difference was not significant, likely because of a small sample size, it shows the same trend as K562 cells. Furthermore, we did find a significant difference in HepG2 cells between Alu binding and non-Alu binding TFs when we compared the average number of Alu sequences per ChIP-seq peak (Fig. 2D). Overall, this suggests that the TFs we found binding to Alu sequences by eY1H assays can bind to Alu sequences in vivo.
The widespread TF binding to Alu sequences that we observed is not a general feature of repetitive elements or of eY1H assays, as screening alphoid DNA (i.e., centromeric DNA sequences) only led to marginal TF binding (Fig. 2E). Indeed, while on average Alu sequences interacted with 6.8 TFs per 100 bp, alphoid DNA sequences interacted with only 1.3 TFs per 100 bp. Further, we only found three TFs (GMEB1, ZNF710, and ZNF711) that bound more than 20% of the 10 alphoid sequences tested (Supplemental Table S2), compared to 34 TFs for the Alu sequences, even though the median pairwise sequence identity is similar for both sets of sequences (79.1% for Alu elements vs. 77.4% for alphoid DNA). The infrequent binding of TFs to alphoid DNA is consistent with previous findings showing that alphoid DNA recruits multiple centromeric and heterochromatin proteins but not TFs (Buxton et al. 2017). Taken together, our results show that eY1H assays can identify specific TF binding to highly repetitive genomic sequences such as Alu sequences. Whether these TFs globally affect the function of Alu sequences or the function of Alu sequences at specific loci remains to be determined.
Identifying TFs binding to novel DNA motifs
Different experimental methods, including protein-binding microarrays, SELEX, bacterial one-hybrid assays, and ChIP-seq, have identified DNA-binding motifs for hundreds of human TFs (Noyes et al. 2008; Jolma et al. 2013; Weirauch et al. 2014). However, 289 (out of 683) de novo DNA motifs identified by genome-wide footprinting using DNase I by the ENCODE Project (Neph et al. 2012) remain orphan (i.e., no TF has been predicted to bind these motifs). This can stem from the lack of DNA-binding motifs for many human TFs (∼50%), from differences between DNA motifs determined in vitro and those occupied in vivo, from motif quality, from limitations in prediction algorithms, or from DNase I cleavage biases.
To determine whether eY1H assays can identify TFs that bind to some of these orphan DNA motifs, we tested seven 8-bp DNA motifs with high information content in all positions that were identified by DNase I footprints by the ENCODE Project (Neph et al. 2012) and that were not previously matched to any human TF (Supplemental Table S3). To do this, we developed a pipeline using synthesized short oligonucleotides containing the sequence of interest flanked by the Gateway attB4 and attB1R sites for cloning purposes (Fig. 1). Each DNA motif was tested using three tandem repeats and a 2-nt mutated version of the motif as control (Fig. 3A). For three motifs (UW.Motif.0118, UW.Motif.0146, and UW.Motif.0167) of seven tested, we identified TFs that could interact with the wild-type but not with the mutant motifs. For UW.Motif.0118 (GCTGATAA), we found that GATA4, GATA5, and DMBX1 bind to the wild-type but not the mutant DNA motif (Fig. 3B). Indeed, UW.Motif.0118 matches the DNA-binding motifs for GATA4 and GATA5, which were reported by later publications (Fig. 3C; Jolma et al. 2013; Kulakovskiy et al. 2013). Further, we found that gene promoters that contain one or more copies of UW.Motif.0118 are enriched in ChIP-seq peaks for GATA4 (Fig. 3D). DMBX1 can be discarded as a candidate to bind UW.Motif.0118 as the DMBX1 motif matches the junction between two motif copies in the tandem repeat rather than the motif itself (Fig. 3E).
Figure 3.

Identification of TFs that bind to novel DNA motifs. (A) Motifs were tested by eY1H assays as three tandem copies. Motifs with two mutated bases were tested as controls. (B,F,I) eY1H screen against 1086 TFs of three motifs identified by DNase I footprinting by the ENCODE Project. Tested sequences are indicated. Each interaction was tested in quadruplicate. Control: empty AD-vector. (C,E,J) Alignment of motif logos from Cis-BP to the tested sequences. (D) Fraction of genes with ChIP-seq peaks for GATA4 and ZBTB26 in their promoters as a function of the number of UW.Motif.0118 and UW.Motif.0146 motifs, respectively. (*) P < 0.001 versus absence of motif by proportion comparison test. (G) Predicted ZBTB26 motif based on the amino acid sequence of zinc fingers 1–3 and highest scoring motif derived from ChIP-seq data. (H) Location of the ZBTB26 motif derived from ChIP-seq data within the peaks. (K) Predicted ZNF646 motif based on the amino acid sequence of zinc fingers 1–3, 4–6, 11–13, 14–16, 20–22, or 23–25. (L) Percentile cleavage preference by DNase I at each position for UW.Motif.0012, UW.Motif.0038, UW.Motif.0053, and UW.Motif.0292.
We also determined that UW.Motif.0146 (ATTTCTGG), but not the mutated motif, binds the zinc finger TF ZBTB26 (Fig. 3F). The DNA-binding motif for ZBTB26 is not available in Cis-BP nor in JASPAR (Weirauch et al. 2014; Khan et al. 2018). We used two approaches to determine the ZBTB26 motif. First, using a position weight matrix prediction algorithm designed for Cys2His2 zinc finger TFs (Persikov and Singh 2014), we predicted a recognition motif based on the amino acid sequence of zinc fingers 1–3. Second, we determined the ZBTB26 motif from ChIP-seq data from the ENCODE Project (Gerstein et al. 2012). We found that both ZBTB26 motifs closely resembled UW.Motif.0146 (Fig. 3G), and the motif determined by ChIP-seq is enriched at the midpoint of the peaks (Fig. 3H). Further, gene promoters that contain one or more copies of UW.Motif.0146 are enriched in ChIP-seq peaks for ZBTB26, further validating our approach (Fig. 3D).
Finally, for UW.Motif.0167 (ACAAAAGA), we found that multiple SOX TFs and ZNF646 bind to the wild-type but not the mutant motif in eY1H assays (Fig. 3I). This DNA motif partially matches SOX motifs (Fig. 3J), while motifs are not available for ZNF646, a protein with 31 zinc fingers according to UniProt. For several clusters of three ZNF646 zinc fingers, we predicted a CAAAA binding preference, a sequence present in UW.Motif.0167 (Fig. 3K). This suggests that ZNF646 binds the tandem repeats of the motif used in the eY1H assays rather than a single copy of the motif which are more frequent in the genome.
To determine whether the TFs that bind to the orphan DNA motifs are functionally related to their potential respective target genes, we determined the biological process Gene Ontology terms associated with genes that contain more than one copy of the motif in their promoter. We found that these genes are associated with similar functions to those determined for the TFs that bind the DNA motifs in eY1H assays (Supplemental Table S4). For example, genes that contain more than one copy of the UW.Motif.0118 in their promoters are associated with cardiovascular and neuronal development. This is consistent with the role of GATA4 and GATA5 in heart development and angiogenesis and the role of GATA4 in neuronal development and function (Lawson and Mellon 1998; Holtzinger and Evans 2007; Walsh and Shiojima 2007; Ang et al. 2016). Similarly, genes that contain more than one copy of the UW.Motif.0167 in their promoters are associated with dendritic spine development, among other biological processes, as are SOX2, SOX5, and SOX11 (Whitney et al. 2014; Hoshiba et al. 2016; Naudet et al. 2018). Altogether, this shows that our approach can identify TFs that bind to uncharacterized motifs, including zinc fingers, which are generally difficult to study, and that the TFs identified are likely to be functionally related to their potential target genes.
Four motifs (UW.Motif.0012, UW.Motif.0038, UW.Motif.0053, and UW.Motif.0292) out of seven tested (Supplemental Table S3) did not produce any interacting TF. This may be due to limitations of eY1H assays including: (1) 25% of the TF missing from the human TF array, which would not be detected in the screen; (2) TFs that do not fold properly in yeast or fused to AD; and (3) TFs that require posttranslational modifications or heterodimerization to bind to DNA (Sewell and Fuxman Bass 2018). Alternatively, some of these motifs may result from sequence bias in DNase I cleavage rather than from nuclease protection by a TF, as has been widely reported (Koohy et al. 2013; Lazarovici et al. 2013; He et al. 2014). Indeed, based on published 6-mer sequence preferences for DNase I (Lazarovici et al. 2013), cleavage within the GAAAAAAA sequence of UW.Motif.0038 is expected to be low (Fig. 3L). This suggests that the footprints driving UW.Motif.0038 result from a lower ability of DNase I to cleave within this motif rather than from TF protection.
Identifying altered TF binding to noncoding SNVs and indels
Previously, we used eY1H assays to identify altered TF binding to noncoding SNVs (Fuxman Bass et al. 2015). That approach used DNA sequences generated by PCR from human genomic DNA as a template and primers containing wild-type or mutant sequences to introduce the allele variants (Fuxman Bass et al. 2015). As a consequence, our previous cloning strategy presented several limitations: (1) the requirement of human DNA samples; (2) indels could not be successfully evaluated (unless genomic DNA was obtained from patient samples) as primers containing indels would fail to anneal to the wild-type DNA template; and (3) the introduction of unwanted mutations during PCR even when using high-fidelity polymerases, thus reducing the efficiency to generate DNA-baits without spurious mutations.
To address these limitations, we leveraged the cloning strategy used for testing novel DNA motifs and synthesized oligonucleotides containing a short sequence of interest flanked by the attB4 and attB1R Gateway cloning sites (Fig. 1). To establish the optimal oligonucleotide length to evaluate TF binding to SNVs and indels, we analyzed eY1H data previously collected for 168 sequences of 61 bp (Fuxman Bass et al. 2015). We determined the number of motifs spanning the indicated position relative to the attB1R primer and the fraction of motifs with the corresponding eY1H interaction (Fig. 4A). We found that the number of motifs detected at positions −50 to −10 is relatively stable and is markedly reduced close to the 5′ and 3′ ends of the sequences (Fig. 4A). In addition, we found that the relative fraction of motifs detected by eY1H assays varies up to 30% depending on the position within the sequence, with a minimum at −20 from the attB1R site that increases up to position −4 (Fig. 4A). Based on these observations, we determined that testing SNVs and indels within ±10 bp of their genomic sequence context (21-bp sequences for SNVs, and 20 bp + indel length for indels) would capture most motifs and provide high sensitivity.
Figure 4.

Identification of altered TF binding to a TAL1 superenhancer insertion. (A) Relative fraction of motifs spanning the indicated position relative to the attB1R site (orange line) and the relative fraction of motifs for which eY1H interactions were detected (green line) for 168 sequences of 61 bp tested by eY1H assays. Sliding windows of 3 bp were used. (B) eY1H screen for an 18-bp insertion in a TAL1 superenhancer associated with T cell acute lymphoblastic leukemia. Wild type and an (AT)9 sequence replacement (for the 18-bp insertion) were screened as controls. Each interaction was tested in quadruplicate. Control: empty AD-vector. (C) Luciferase assays to validate the differential TF interactions with the TAL1 superenhancer wild-type and insertion alleles. HEK293T cells were cotransfected with reporter plasmids containing the wild-type or insertion TAL1 superenhancer region cloned upstream of the firefly luciferase reporter gene and expression vectors for the indicated TFs (fused to the activation domain VP160). After 48 h, cells were harvested and luciferase assays were performed. Relative luciferase activity is plotted as fold change compared to cells cotransfected with the wild-type TAL1 superenhancer construct and the VP160 vector (control). A representative experiment of three is shown. The average of three replicates is indicated by the black line. (*) P < 0.05 by one-tailed log-transformed Student's t-test with Benjamini-Hochberg correction. (D) Motifs obtained from Cis-BP that match the differential TFs identified by eY1H assays.
To evaluate this approach, we tested eight noncoding somatic mutations found in cancer patients: an 18-bp indel in a superenhancer of TAL1 and seven single- or di-nucleotide mutations in the TERT promoter (Supplemental Tables S3, S5). First, we evaluated whether there is altered TF binding caused by an 18-bp insertion in a TAL1 superenhancer found in a patient with T cell acute lymphoblastic leukemia (Mansour et al. 2014). This indel leads to the recruitment of CREBBP and increased TAL1 expression (Mansour et al. 2014). We detected interactions of TFs ELK1, GABPA, ELF2, ELF3, and MYB with the insertion allele but not with the wild-type sequence or an altered sequence where the 18-bp insertion was replaced by an (AT)9 repeat (Fig. 4B). This control replacing the insertion with a different sequence is important as differences in TF binding between wild-type and insertion alleles could arise from differences in distance relative to the minimal promoter of the reporter genes or in nucleosome occlusion. To validate the differential TF-DNA interactions found, we performed reporter assays by cotransfecting HEK293T cells with a reporter plasmid carrying a ∼0.5-kb TAL1 enhancer sequence containing either the wild-type or indel alleles driving luciferase expression and an expression plasmid for the indicated TFs fused to the VP160 (10 copies of VP16) activation domain. The interaction between MYB and the TAL1 insertion allele was confirmed in human cells by luciferase assays (Fig. 4C), consistent with a previous study that found that this 18-bp insertion creates a binding site for MYB (Mansour et al. 2014). However, the eY1H interactions between the TAL1 insertion allele and the ETS factors ELK1, GABPA, ELF2, and ELF3 were not confirmed by the reporter assays (Fig. 4C), even though these TFs are predicted to bind outside the indel region (Fig. 4D). This difference between eY1H assays (and motif predictions) and luciferase assays may be related to differences in chromatin context (i.e., eY1H assays test interactions within chromatinized DNA versus luciferase assays in episomal vectors) or differences in cellular context (i.e., interactions tested in yeast for eY1H assays vs. human cells in luciferase assays). Additional experiments in the endogenous locus using genome edited cell lines will ultimately determine whether ETS factors affect TAL1 gene expression caused by the insertion.
We next applied eY1H assays to test seven single- and di-nucleotide mutations in the TERT promoter that lead to telomerase reactivation in different types of cancers including melanoma, bladder cancer, and thyroid cancer (Fig. 5A; Supplemental Table S5). Previously, two TERT promoter mutations, −124 G→A and −146 G→A were shown to lead to new interactions with the ETS factor GABPA using reporter assays and TF knockdown experiments (Bell et al. 2015). Consistent with this, we found that the −146 G→A mutation leads to gain of eY1H interactions with GABPA and ERF, another ETS factor, which were confirmed by motif analysis and luciferase reporter assays, further validating our approach (Fig. 5A). We found that a 2-nt mutation (GG→AA) in the TERT promoter at position −138/−139 found in patients with melanoma and bladder cancer (Horn et al. 2013; Wu et al. 2014), for which TF binding was not tested experimentally, leads to gain of interactions with the ETS factors GABPA, ELK1, ELK4, ETV1, ELF2, and ERF (Fig. 5B). Indeed, the −138/−139 GG→AA mutation creates binding sites for these TFs (Fig. 5C) but not for other ETS factors such as SPI1 and ETV7 that have slightly different DNA-binding specificities (Supplemental Fig. S2). We found that GABPA, ELK1, ELK4, ETV1, and ERF lead to a stronger activation of the mutant promoter in luciferase reporter assays in human cells, whereas ELF2 did not induce reporter expression (Fig. 5D). In addition, we found that a −94 A→C mutation in the TERT promoter also leads to gain of interactions with GABPA both by eY1H and luciferase assays (Fig. 5A). Overall, these results suggest that binding sites for GABPA (and other ETS factors) created by single or di-nucleotide mutations at different positions in the TERT promoter are responsible for TERT reactivation in tumors derived from different cancer patients.
Figure 5.

Identification of altered TF binding to single- and di-nucleotide mutations in the TERT promoter. (A) Gain and loss of protein-DNA interactions (PDIs) with seven TERT single- and di-nucleotide mutations in the TERT promoter were identified by eY1H assays. Mutation position is relative to the initiation codon. Blue line: gain of PDIs, red line: loss of PDIs. Full lines indicate validation by motif analysis. Thick lines indicate validation by luciferase assays. (B,E) eY1H screen for wild type and a −138/−139 GG→AA (B) or a −80 G→A (E) mutation in the TERT promoter associated with cancer. Each interaction was tested in quadruplicate. Control: empty AD-vector. (C,F) Motifs obtained from Cis-BP that match the differential TFs identified by eY1H assays. (D,G) Luciferase assays to validate the differential TF interactions with the TERT promoter alleles. Relative luciferase activity is plotted as fold change compared to cells cotransfected with the wild-type TERT promoter construct and the VP160 vector (control). A representative experiment of three is shown. The average of three replicates is indicated by the black line. (*) P < 0.05 by one-tailed log-transformed Student's t-test with Benjamini-Hochberg correction.
In addition to the gain of interactions with ETS factors, TERT promoter mutations can also affect the binding of other TFs. For example, using eY1H assays, we found that a −80 G→A mutation leads to loss of interactions with KLF2/3/4, GMEB1, HES5, and ZBTB14 (Fig. 5E). Loss of interaction with the KLF factors was confirmed by motif analysis and/or luciferase assays, whereas loss of interaction with GMEB1 and HES5 was only confirmed by luciferase assays (Fig. 5A,F,G). KLF2 and KLF4 have been shown to repress TERT expression in normal T cells and lung cancer cells, respectively, although through binding sites that do not overlap with position −80 (Hara et al. 2015; Hu et al. 2016). Further, high KLF2/3/4 expression levels are associated with a favorable prognosis in liver, renal, and lung cancer (Hu et al. 2016; Uhlen et al. 2017). Overall, these results suggest that TERT reactivation can occur either due to low expression of KLF factors or by mutations in KLF binding sites.
Discussion
In this study, we used eY1H assays to evaluate TF binding to short DNA sequences (e.g., SNVs, indels, and novel DNA motifs) and repetitive elements. Testing these types of sequences has previously been challenging due to limitations in ChIP-seq and DNA motif analyses. For example, motif analyses using Cis-BP (Weirauch et al. 2014) led to the prediction of 123 and 56 differential TF interactions with the TAL1 superenhancer 18-bp insertion and the TERT −138/−139 GG→AA mutation, respectively (34 and 26 involving TFs for which we had previously detected interactions by eY1H assays). Our approach greatly reduced the number of different TFs that required validation, which is technically important given that mammalian cell reporter assays, ChIP, and TF knockdowns followed by RT-qPCR are generally low-throughput. However, it is important to note that eY1H assays may fail to detect interactions involving some TFs (e.g., TFs absent from the array, heterodimers, misfolded TFs in yeast, or TFs that require posttranslational modifications to bind to DNA) and, thus, eY1H assays should be used together with in silico predictions and other experimental assays.
Our eY1H approach enables the identification of TF-DNA binding even in the absence of a priori TF candidates or a human DNA template, as in the case of novel DNA motifs identified by DNase I footprinting assays. For example, we identified TFs that bind to three of seven orphan motifs identified by DNase I footprinting, which is consistent with available or in silico predicted motifs, ChIP-seq data, and functional enrichment of target genes. Although some orphan motifs may result from DNase I cleavage bias as previously shown (He et al. 2014) and as we have observed for UW.Motif.0038, our results show that orphan motifs may indeed result from TF protection.
Our eY1H approach can also be applied to DNA motifs enriched in the regulatory regions of functionally related genes, in particular when these DNA motifs cannot be assigned to any TF. Several factors need to be considered when designing sequences to test motifs by eY1H assays. First, using multiple tandem copies (three in our case) of a motif increases the sensitivity of the assay. Second, TF interactions may not only occur within the motif but also with the junction between motifs, the junction between the motifs and the Gateway attB4 or attB1R sites, or with two consecutive motifs in case of TFs that bind as homodimers or that have more than one domain that recognizes the motif. Thus, it is recommended to also test a mutated version of the motif affecting one or more high information content positions and to perform motif analysis with the full oligonucleotide sequence (including the Gateway attB sequences) to exclude TFs that do not bind to the motif itself. Finally, if the motif contains low information content positions, multiple alternative sequences may need to be tested: either all possible variations of the motif, or selected examples from loci of interest.
Using eY1H assays, we also identified 34 TFs that bind to at least 20% of the repetitive Alu sequences tested. These TFs may be involved in regulating the expression of nearby genes or silencing Alu sequences. Alu sequences may also act as sinks for some TFs, reducing their effective nuclear concentration. However, we did not detect a significantly higher number of raw sequencing reads matching Alu sequences in ChIP-seq data sets from the ENCODE Project corresponding to Alu-binding TFs than in ChIP-seq data sets corresponding to non-Alu-binding TFs (Supplemental Fig. S3). This could be due to epigenetic silencing of many Alu sequences, which would prevent TF binding to chromatin in human cells in most tissues and conditions. Indeed, most Alu sequences have been found to be enriched in the H3K9me mark and to be actively silenced in somatic tissues (Kondo and Issa 2003; Ward et al. 2013). Nevertheless, thousands of Alu sequences in the human genome contain active histone marks and may be permissive for TF binding, which could contribute to the transcriptional control of nearby genes in specific cells and conditions (Deininger 2011; Bouttier et al. 2016). For example, a recent study found that de novo ChIP-seq peaks for the H3K4me1 mark in macrophages infected with Mycobacterium tuberculosis contain Alu sequences enriched for binding sites of several TFs including ETS and NHR factors, consistent with our findings by eY1H assays (Bouttier et al. 2016). Further, we detected a higher enrichment of Alu sequences in ChIP-seq peaks for TFs detected by eY1H assays to bind to our set of 20 Alu sequences tested. However, depending on the parameter used to measure such enrichment, significance was detected in either K562 or HepG2 cells. It is important to note that this could be related to the few ChIP-seq experiments available for Alu-binding TFs or to some of the TFs for which we failed to detect interactions to the 20 Alu sequences tested actually binding to other Alu sequences in the genome. We anticipate that the approach we developed to study TF binding to Alu and alphoid sequences will shed light on the role of other repetitive elements in gene regulation and/or the establishment of heterochromatin.
Overall, the eY1H approaches described here demonstrate their utility for characterizing altered TF binding to different types of genomic variants and for studying the role of TFs in regulating the function of repetitive genomic elements.
Methods
eY1H assays
DNA-baits were generated using different approaches depending on the type of sequence cloned (Fig. 1). For repetitive DNA elements, DNA-baits were generated by PCR using human genomic DNA (Clontech) as a template, Platinum Taq DNA Polymerase High Fidelity (Thermo Fisher Scientific), and degenerate primers complementary to different family members of Alu elements (Alu-Fw and Alu-Rv) (Supplemental Table S3) or different variations of alphoid DNA (Alphoid-Fw and Alphoid-Rv) (Supplemental Table S3; Fig. 1). These primers include the attB4 and attB1R sequences for Gateway cloning. The PCR cycle involved an initial denaturation step of 2 min at 94°C, 35 cycles of 30 sec at 94°C, 15 sec at 58°C, and 75 sec at 72°C, followed by a final extension for 7 min at 72°C. The random libraries containing the Alu sequences or the alphoid DNA were cloned into the pDONR-P4-P1R vector (Thermo Fisher Scientific) by Gateway cloning using the BP Clonase II (Thermo Fisher Scientific) and transformed into DH5α bacteria. Individual colonies were picked and sequenced to identify the sequences cloned (Supplemental Table S1). Each sequence was then transferred to the pMW#2 and pMW#3 vectors (Addgene) using the LR Clonase II (Thermo Fisher Scientific), upstream of two reporter genes (HIS3 and LacZ). Both reporter constructs were integrated into the Y1HaS2 yeast strain (Reece-Hoyes et al. 2011) genome by site-specific recombination to generate chromatinized DNA-bait strains as previously described (Fuxman Bass et al. 2016b,c). The DNA-bait yeast strains were then sequenced to verify the identity of the yeast integrants.
DNA-baits corresponding to genomic variants (SNVs and indels) and novel DNA motifs were synthesized as oligonucleotides (Thermo Fisher Scientific) flanked by the attB4 and attB1R sequences for cloning using the Gateway recombination system (Fig. 1; Supplemental Table S3). Double-stranded oligonucleotides were generated by primer extension using Taq polymerase (Thermo Fisher Scientific) and a primer complementary to the attB1R site (Supplemental Table S3) using an initial denaturation step of 3 min at 95°C, 10 cycles of 30 sec at 55°C and 30 sec at 72°C, followed by one cycle of 5 min at 72°C. The double-stranded oligonucleotides were then cloned into the pDONR-P4-P1R (Thermo Fisher Scientific) by Gateway cloning, transferred to the pMW#2 and pMW#3 vectors, and then integrated into the Y1HaS2 strain genome.
DNA-bait strains were mated with an array of yeast strains expressing 1086 human TF-preys using a Singer RoToR robotic platform, as previously described (Reece-Hoyes et al. 2011; Fuxman Bass et al. 2015). This TF array includes members from all major human TF families and is available upon request (Fuxman Bass et al. 2015). Each interaction was tested in quadruplicate in the same plate, and positive colonies were detected using the MyBrid webtool as previously described (Reece-Hoyes et al. 2013). MyBrid accounts for unevenness in background due to colony position in the plate (e.g., distance from the borders). Following detection with MyBrid, each interaction was curated by two independent researchers to remove false positive predictions or add missing interactions. Only interactions detected with at least two colonies were considered positive (Fig. 1). As previously observed, ∼90% of interactions were detected by all four replicates (Reece-Hoyes et al. 2011; Fuxman Bass et al. 2015, 2016a).
Overlap between ChIP-seq peaks and Alu sequences
ChIP-seq peak coordinates for TFs that have been detected in the current or previous works by eY1H assays were obtained from the ENCODE Project (The ENCODE Project Consortium 2012). ChIP-seq peaks were overlapped with the coordinates of Alu sequences (±100 bp to reduce the impact of mapping issues) using the intersect option from BEDTools (Quinlan and Hall 2010). For TFs with multiple experiments in a particular cell line, the experiment with the highest number of total peaks was considered. The total number of Alu sequences that overlap with ChIP-seq peaks was compared between TFs that bind at least 20% of Alu sequences tested and TFs that do not bind to Alu sequences by eY1H assays. Statistical significance was determined in the log-transformed data using Student's t-test with Welch's correction for unequal variances. In addition, we compared the average number of Alu sequences per ChIP-seq peak and determined statistical significance using Student's t-test with Welch's correction.
Transient transfections and luciferase assays
TF interactions with noncoding alleles were validated by luciferase assays in HEK293T cells. Given that testing the noncoding alleles in the short sequence context (20–40 bp) used in eY1H assays led to luciferase activity barely above background levels, DNA-bait luciferase reporter clones were generated corresponding to the ∼0.5-kb genomic sequence surrounding the noncoding alleles (Supplemental Table S6). Wild-type sequences were generated by PCR using human genomic DNA (Clontech) as a template, Platinum High Fidelity or SuperFi Taq polymerases (Thermo Fisher Scientific), and primers flanking the noncoding alleles. Mutant sequences were generated from the wild-type sequence by PCR stitching using primers that contain the mutated nucleotide. DNA-bait luciferase reporter clones were generated by cloning the noncoding regions upstream of the firefly luciferase into a Gateway-compatible vector generated from pGL4.23[luc2/minP] (Fuxman Bass et al. 2015). TF-prey clones were generated by Gateway-cloning the TF coding sequence into the pEZY3-VP160 vector, where TFs are fused to 10 copies of the strong transcriptional activator VP16 (Carrasco Pro et al. 2018).
HEK293T cells were plated in 96-well white opaque plates (∼1 × 10⁴ cells/well) 24 h prior to transfection in 100 µL DMEM supplemented with 10% FBS and 1% Antibiotic-Antimycotic 100× (Thermo Fisher Scientific). Cells were transfected with Lipofectamine 3000 (Thermo Fisher Scientific) according to the manufacturer's protocol using 20 ng of the DNA-bait pGL4.23[luc2/minP] luciferase reporter vector, 80 ng of the TF-pEZY3-VP160 vector, and 10 ng of Renilla luciferase control vector pGL4.74[hRluc/TK] (Promega). The empty pEZY3-VP160 vector cotransfected with the recombinant firefly luciferase plasmid was used as a normalization control. Forty-eight hours after transfection, firefly and Renilla luciferase activities were measured using the Dual-Glo Luciferase Assay System (Promega) according to the manufacturer's protocol. Nontransfected cells were used to subtract background luciferase activities, followed by normalizing firefly luciferase activity to Renilla luciferase activity.
ChIP-seq analysis for novel motifs
ChIP-seq peaks for GATA4 (ENCSR590CNM) and ZBTB26 (ENCSR229DYF) were obtained from the ENCODE Project (The ENCODE Project Consortium 2012). A peak was assigned to a gene promoter if the midpoint of the peak was located within −2 kb to +250 bp of the transcription start site (according to GENCODE v19). In addition, promoter positions overlapping with coding regions were excluded from this analysis. The midpoint of peaks overlapping with promoter regions was calculated using the intersect option from BEDTools (Quinlan and Hall 2010). The fraction of genes with GATA4 and ZBTB26 peaks in their promoters was calculated as a function of the number of UW.Motif.0118 and UW.Motif.0146 motifs, respectively.
Prediction of DNA-binding motif for zinc finger proteins
DNA motif prediction for the Cys2His2 zinc finger TFs ZBTB26 and ZNF646 was performed using an expanded support vector machine model available at http://zf.princeton.edu/fingerSelect.php (Persikov and Singh 2014). For ZNF646, zinc fingers 1–3, 4–6, 11–13, 14–16, 20–22, and 23–25 were used for predictions. For ZBTB26, zinc fingers 1–3 were used for in silico predictions. In addition, we determined the motif for ZBTB26 using ChIP-seq data (experiment ENCFF153JOG) from the ENCODE Project (Gerstein et al. 2012). Sequences ±250 bp of the midpoint of the ChIP-seq peaks were analyzed using MEME-ChIP with default settings (Machanick and Bailey 2011). The best matching motif is shown.
Gene Ontology enrichment
For each of the DNA motifs derived from DNase I footprints, the biological process Gene Ontology enrichment was determined using the Gene Ontology Consortium enrichment analysis tool (http://geneontology.org/page/go-enrichment-analysis) for genes with at least two motifs in their promoter regions and using all human genes as background. For each cluster of terms, only the term with the highest fold enrichment (>2) was considered. For each of the TFs found to bind to the DNA motifs in eY1H assays (except ZBTB26 and ZNF646, for which no or few publications are available), the association between the TF and the Gene Ontology terms was annotated (Supplemental Table S4).
DNase cleavage preference
DNase I cleavage expected preferences within each 8-bp motif were calculated using previously determined 6-mer cleavage frequencies (Lazarovici et al. 2013). For cleavage sites at positions −4, −3, and −2 from the center of the motif, the average cleavage frequency was calculated between 6-mers NNNXXX, NNXXXX, and NXXXXX, respectively, where N is any nucleotide and X corresponds to a nucleotide in the motif. For cleavage sites at positions 2, 3, 4 from the center of the motif, the average cleavage frequency was calculated between 6-mers XXXXXN, XXXXNN, and XXXNNN, respectively. The percentile cleavage preference at each position was determined by comparing to all the averaged frequencies at their respective positions.
Selection of oligonucleotide length to test SNVs and indels
To determine the optimal oligonucleotide length to evaluate TF binding to SNVs and indels, the motifs present and the published eY1H interactions detected in 168 sequences of 61 bp were analyzed (Fuxman Bass et al. 2015). For each position relative to the attB1R cloning site (which is proximal to the minimal promoter of the reporter genes), the number of motifs spanning the indicated position and the fraction of motifs with the corresponding eY1H interaction were calculated. Reported values are relative to the maximum and correspond to sliding windows of 3 bp (except at positions −1 and −61).
Data access
The protein-DNA interactions from this study (i.e., the interactions with Alu sequences and the differential interactions with the TAL1 and TERT mutations) have been submitted to the IMEx (http://www.imexconsortium.org) consortium through IntAct (Orchard et al. 2014) and assigned the identifier IM-26689.
Supplementary Material
Acknowledgments
We thank Drs. Trevor Siggers and Thomas Gilmore for critically reading the manuscript. This work was supported by the National Institutes of Health (NIH) Grants R00-GM114296 and R35-GM128625 to J.I.F.B. J.A.S. was supported by NIH training grant 5T32HL007501-34 and M.M. by a National Science Foundation REU (BIO-1659605).
Author contributions: J.I.F.B., J.A.S., S.S., E.F., and M.M. performed eY1H assays. S.S. and C.S.S. performed luciferase assays. J.I.F.B. and S.C.P. performed the data analyses. J.I.F.B. conceived the project and wrote the manuscript. All authors approved the content of the manuscript.
Footnotes
[Supplemental material is available for this article.]
Article, supplemental material, and publication date are at http://www.genome.org/cgi/doi/10.1101/gr.248823.119.
References
- Ang YS, Rivas RN, Ribeiro AJS, Srivas R, Rivera J, Stone NR, Pratt K, Mohamed TMA, Fu JD, Spencer CI, et al. 2016. Disease model of GATA4 mutation reveals transcription factor cooperativity in human cardiogenesis. Cell 167: 1734–1749.e22. 10.1016/j.cell.2016.11.033 [DOI] [PMC free article] [PubMed] [Google Scholar]
- Batzer MA, Deininger PL. 2002. Alu repeats and human genomic diversity. Nat Rev Genet 3: 370–379. 10.1038/nrg798 [DOI] [PubMed] [Google Scholar]
- Bell RJ, Rube HT, Kreig A, Mancini A, Fouse SD, Nagarajan RP, Choi S, Hong C, He D, Pekmezci M, et al. 2015. Cancer. The transcription factor GABP selectively binds and activates the mutant TERT promoter in cancer. Science 348: 1036–1039. 10.1126/science.aab0015 [DOI] [PMC free article] [PubMed] [Google Scholar]
- Bouttier M, Laperriere D, Memari B, Mangiapane J, Fiore A, Mitchell E, Verway M, Behr MA, Sladek R, Barreiro LB, et al. 2016. Alu repeats as transcriptional regulatory platforms in macrophage responses to M. tuberculosis infection. Nucleic Acids Res 44: 10571–10587. 10.1093/nar/gkw782 [DOI] [PMC free article] [PubMed] [Google Scholar]
- Brady SM, Zhang L, Megraw M, Martinez NJ, Jiang E, Yi CS, Liu W, Zeng A, Taylor-Teeples M, Kim D, et al. 2011. A stele-enriched gene regulatory network in the Arabidopsis root. Mol Syst Biol 7: 459 10.1038/msb.2010.114 [DOI] [PMC free article] [PubMed] [Google Scholar]
- Burdo B, Gray J, Goetting-Minesky MP, Wittler B, Hunt M, Li T, Velliquette D, Thomas J, Gentzel I, dos Santos Brito M, et al. 2014. The Maize TFome–development of a transcription factor open reading frame collection for functional genomics. Plant J 80: 356–366. 10.1111/tpj.12623 [DOI] [PMC free article] [PubMed] [Google Scholar]
- Buxton KE, Kennedy-Darling J, Shortreed MR, Zaidan NZ, Olivier M, Scalf M, Sridharan R, Smith LM. 2017. Elucidating protein–DNA interactions in human alphoid chromatin via hybridization capture and mass spectrometry. J Proteome Res 16: 3433–3442. 10.1021/acs.jproteome.7b00448 [DOI] [PMC free article] [PubMed] [Google Scholar]
- Carrasco Pro S, Dafonte Imedio A, Santoso CS, Gan KA, Sewell JA, Martinez M, Sereda R, Mehta S, Fuxman Bass JI. 2018. Global landscape of mouse and human cytokine transcriptional regulation. Nucleic Acids Res 46: 9321–9337. 10.1093/nar/gky787. [DOI] [PMC free article] [PubMed] [Google Scholar]
- Chung D, Kuan PF, Li B, Sanalkumar R, Liang K, Bresnick EH, Dewey C, Keles S. 2011. Discovering transcription factor binding sites in highly repetitive regions of genomes with multi-read analysis of ChIP-seq data. PLoS Comput Biol 7: e1002111 10.1371/journal.pcbi.1002111 [DOI] [PMC free article] [PubMed] [Google Scholar]
- Deininger P. 2011. Alu elements: Know the SINEs. Genome Biol 12: 236 10.1186/gb-2011-12-12-236 [DOI] [PMC free article] [PubMed] [Google Scholar]
- Deininger PL, Jolly DJ, Rubin CM, Friedmann T, Schmid CW. 1981. Base sequence studies of 300 nucleotide renatured repeated human DNA clones. J Mol Biol 151: 17–33. 10.1016/0022-2836(81)90219-9 [DOI] [PubMed] [Google Scholar]
- Deplancke B, Mukhopadhyay A, Ao W, Elewa AM, Grove CA, Martinez NJ, Sequerra R, Doucette-Stamm L, Reece-Hoyes JS, Hope IA, et al. 2006. A gene-centered C. elegans protein-DNA interaction network. Cell 125: 1193–1205. 10.1016/j.cell.2006.04.038 [DOI] [PubMed] [Google Scholar]
- The ENCODE Project Consortium. 2012. An integrated encyclopedia of DNA elements in the human genome. Nature 489: 57–74. 10.1038/nature11247 [DOI] [PMC free article] [PubMed] [Google Scholar]
- Fuxman Bass JI, Sahni N, Shrestha S, Garcia-Gonzalez A, Mori A, Bhat N, Yi S, Hill DE, Vidal M, Walhout AJ. 2015. Human gene-centered transcription factor networks for enhancers and disease variants. Cell 161: 661–673. 10.1016/j.cell.2015.03.003 [DOI] [PMC free article] [PubMed] [Google Scholar]
- Fuxman Bass JI, Pons C, Kozlowski L, Reece-Hoyes JS, Shrestha S, Holdorf AD, Mori A, Myers CL, Walhout AJ. 2016a. A gene-centered C. elegans protein–DNA interaction network provides a framework for functional predictions. Mol Syst Biol 12: 884 10.15252/msb.20167131 [DOI] [PMC free article] [PubMed] [Google Scholar]
- Fuxman Bass JI, Reece-Hoyes JS, Walhout AJ. 2016b. Gene-centered yeast one-hybrid assays. Cold Spring Harb Protoc 2016: pdb top077669 10.1101/pdb.top077669 [DOI] [PMC free article] [PubMed] [Google Scholar]
- Fuxman Bass JI, Reece-Hoyes JS, Walhout AJ. 2016c. Generating bait strains for yeast one-hybrid assays. Cold Spring Harb Protoc 2016: pdb prot088948 10.1101/pdb.prot088948 [DOI] [PMC free article] [PubMed] [Google Scholar]
- Gan KA, Carrasco Pro S, Sewell JA, Fuxman Bass JI. 2018. Identification of single nucleotide non-coding driver mutations in cancer. Front Genet 9: 16 10.3389/fgene.2018.00016 [DOI] [PMC free article] [PubMed] [Google Scholar]
- Gerstein MB, Kundaje A, Hariharan M, Landt SG, Yan KK, Cheng C, Mu XJ, Khurana E, Rozowsky J, Alexander R, et al. 2012. Architecture of the human regulatory network derived from ENCODE data. Nature 489: 91–100. 10.1038/nature11245 [DOI] [PMC free article] [PubMed] [Google Scholar]
- Gheorghe M, Sandve GK, Khan A, Chèneby J, Ballester B, Mathelier A. 2019. A map of direct TF–DNA interactions in the human genome. Nucleic Acids Res 47: e21 10.1093/nar/gky1210. [DOI] [PMC free article] [PubMed] [Google Scholar]
- Grant CE, Bailey TL, Noble WS. 2011. FIMO: scanning for occurrences of a given motif. Bioinformatics 27: 1017–1018. 10.1093/bioinformatics/btr064 [DOI] [PMC free article] [PubMed] [Google Scholar]
- Gubelmann C, Waszak SM, Isakova A, Holcombe W, Hens K, Iagovitina A, Feuz JD, Raghav SK, Simicevic J, Deplancke B. 2013. A yeast one-hybrid and microfluidics-based pipeline to map mammalian gene regulatory networks. Mol Syst Biol 9: 682 10.1038/msb.2013.38 [DOI] [PMC free article] [PubMed] [Google Scholar]
- Hara T, Mizuguchi M, Fujii M, Nakamura M. 2015. Kruppel-like factor 2 represses transcription of the telomerase catalytic subunit human telomerase reverse transcriptase (hTERT) in human T cells. J Biol Chem 290: 8758–8763. 10.1074/jbc.M114.610386 [DOI] [PMC free article] [PubMed] [Google Scholar]
- He HH, Meyer CA, Hu SS, Chen MW, Zang C, Liu Y, Rao PK, Fei T, Xu H, Long H, et al. 2014. Refined DNase-seq protocol and data analysis reveals intrinsic bias in transcription factor footprint identification. Nat Methods 11: 73–78. 10.1038/nmeth.2762 [DOI] [PMC free article] [PubMed] [Google Scholar]
- Hens K, Feuz JD, Isakova A, Iagovitina A, Massouras A, Bryois J, Callaerts P, Celniker SE, Deplancke B. 2011. Automated protein-DNA interaction screening of Drosophila regulatory elements. Nat Methods 8: 1065–1070. 10.1038/nmeth.1763 [DOI] [PMC free article] [PubMed] [Google Scholar]
- Holtzinger A, Evans T. 2007. Gata5 and Gata6 are functionally redundant in zebrafish for specification of cardiomyocytes. Dev Biol 312: 613–622. 10.1016/j.ydbio.2007.09.018 [DOI] [PMC free article] [PubMed] [Google Scholar]
- Horn S, Figl A, Rachakonda PS, Fischer C, Sucker A, Gast A, Kadel S, Moll I, Nagore E, Hemminki K, et al. 2013. TERT promoter mutations in familial and sporadic melanoma. Science 339: 959–961. 10.1126/science.1230062 [DOI] [PubMed] [Google Scholar]
- Hoshiba Y, Toda T, Ebisu H, Wakimoto M, Yanagi S, Kawasaki H. 2016. Sox11 balances dendritic morphogenesis with neuronal migration in the developing cerebral cortex. J Neurosci 36: 5775–5784. 10.1523/JNEUROSCI.3250-15.2016 [DOI] [PMC free article] [PubMed] [Google Scholar]
- Hu W, Jia Y, Xiao X, Lv K, Chen Y, Wang L, Luo X, Liu T, Li W, Li Y, et al. 2016. KLF4 downregulates hTERT expression and telomerase activity to inhibit lung carcinoma growth. Oncotarget 7: 52870–52887. 10.18632/oncotarget.9141 [DOI] [PMC free article] [PubMed] [Google Scholar]
- Humphrey GW, Englander EW, Howard BH. 1996. Specific binding sites for a pol III transcriptional repressor and pol II transcription factor YY1 within the internucleosomal spacer region in primate Alu repetitive elements. Gene Expr 6: 151–168. [PMC free article] [PubMed] [Google Scholar]
- International Human Genome Sequencing Consortium. 2001. Initial sequencing and analysis of the human genome. Nature 409: 860–921. 10.1038/35057062 [DOI] [PubMed] [Google Scholar]
- Jolma A, Yan J, Whitington T, Toivonen J, Nitta KR, Rastas P, Morgunova E, Enge M, Taipale M, Wei G, et al. 2013. DNA-binding specificities of human transcription factors. Cell 152: 327–339. 10.1016/j.cell.2012.12.009 [DOI] [PubMed] [Google Scholar]
- Khan A, Fornes O, Stigliani A, Gheorghe M, Castro-Mondragon JA, van der Lee R, Bessy A, Cheneby J, Kulkarni SR, Tan G, et al. 2018. JASPAR 2018: update of the open-access database of transcription factor binding profiles and its web framework. Nucleic Acids Res 46: D260–D266. 10.1093/nar/gkx1126 [DOI] [PMC free article] [PubMed] [Google Scholar]
- Kondo Y, Issa JP. 2003. Enrichment for histone H3 lysine 9 methylation at Alu repeats in human cells. J Biol Chem 278: 27658–27662. 10.1074/jbc.M304072200 [DOI] [PubMed] [Google Scholar]
- Koohy H, Down TA, Hubbard TJ. 2013. Chromatin accessibility data sets show bias due to sequence specificity of the DNase I enzyme. PLoS One 8: e69853 10.1371/journal.pone.0069853 [DOI] [PMC free article] [PubMed] [Google Scholar]
- Kulakovskiy IV, Medvedeva YA, Schaefer U, Kasianov AS, Vorontsov IE, Bajic VB, Makeev VJ. 2013. HOCOMOCO: a comprehensive collection of human transcription factor binding sites models. Nucleic Acids Res 41: D195–D202. 10.1093/nar/gks1089 [DOI] [PMC free article] [PubMed] [Google Scholar]
- Lawson MA, Mellon PL. 1998. Expression of GATA-4 in migrating gonadotropin-releasing neurons of the developing mouse. Mol Cell Endocrinol 140: 157–161. 10.1016/S0303-7207(98)00044-6 [DOI] [PubMed] [Google Scholar]
- Lazarovici A, Zhou T, Shafer A, Dantas Machado AC, Riley TR, Sandstrom R, Sabo PJ, Lu Y, Rohs R, Stamatoyannopoulos JA, et al. 2013. Probing DNA shape and methylation state on a genomic scale with DNase I. Proc Natl Acad Sci 110: 6376–6381. 10.1073/pnas.1216822110 [DOI] [PMC free article] [PubMed] [Google Scholar]
- Machanick P, Bailey TL. 2011. MEME-ChIP: motif analysis of large DNA datasets. Bioinformatics 27: 1696–1697. 10.1093/bioinformatics/btr189 [DOI] [PMC free article] [PubMed] [Google Scholar]
- Mansour MR, Abraham BJ, Anders L, Berezovskaya A, Gutierrez A, Durbin AD, Etchin J, Lawton L, Sallan SE, Silverman LB, et al. 2014. Oncogene regulation. An oncogenic super-enhancer formed through somatic mutation of a noncoding intergenic element. Science 346: 1373–1377. 10.1126/science.1259037 [DOI] [PMC free article] [PubMed] [Google Scholar]
- Naudet N, Moutal A, Vu HN, Chounlamountri N, Watrin C, Cavagna S, Malleval C, Benetollo C, Bardel C, Dronne MA, et al. 2018. Transcriptional regulation of CRMP5 controls neurite outgrowth through Sox5. Cell Mol Life Sci 75: 67–79. 10.1007/s00018-017-2634-6 [DOI] [PMC free article] [PubMed] [Google Scholar]
- Neph S, Vierstra J, Stergachis AB, Reynolds AP, Haugen E, Vernot B, Thurman RE, John S, Sandstrom R, Johnson AK, et al. 2012. An expansive human regulatory lexicon encoded in transcription factor footprints. Nature 489: 83–90. 10.1038/nature11212 [DOI] [PMC free article] [PubMed] [Google Scholar]
- Noyes MB, Christensen RG, Wakabayashi A, Stormo GD, Brodsky MH, Wolfe SA. 2008. Analysis of homeodomain specificities allows the family-wide prediction of preferred recognition sites. Cell 133: 1277–1289. 10.1016/j.cell.2008.05.023 [DOI] [PMC free article] [PubMed] [Google Scholar]
- Orchard S, Ammari M, Aranda B, Breuza L, Briganti L, Broackes-Carter F, Campbell NH, Chavali G, Chen C, del-Toro N, et al. 2014. The MIntAct project—IntAct as a common curation platform for 11 molecular interaction databases. Nucleic Acids Res 42: D358–D363. 10.1093/nar/gkt1115 [DOI] [PMC free article] [PubMed] [Google Scholar]
- Persikov AV, Singh M. 2014. De novo prediction of DNA-binding specificities for Cys2His2 zinc finger proteins. Nucleic Acids Res 42: 97–108. 10.1093/nar/gkt890 [DOI] [PMC free article] [PubMed] [Google Scholar]
- Quinlan AR, Hall IM. 2010. BEDTools: a flexible suite of utilities for comparing genomic features. Bioinformatics 26: 841–842. 10.1093/bioinformatics/btq033 [DOI] [PMC free article] [PubMed] [Google Scholar]
- Ramirez RN, El-Ali NC, Mager MA, Wyman D, Conesa A, Mortazavi A. 2017. Dynamic gene regulatory networks of human myeloid differentiation. Cell Syst 4: 416–429.e3. 10.1016/j.cels.2017.03.005 [DOI] [PMC free article] [PubMed] [Google Scholar]
- Reece-Hoyes JS, Diallo A, Lajoie B, Kent A, Shrestha S, Kadreppa S, Pesyna C, Dekker J, Myers CL, Walhout AJ. 2011. Enhanced yeast one-hybrid assays for high-throughput gene-centered regulatory network mapping. Nat Methods 8: 1059–1064. 10.1038/nmeth.1748 [DOI] [PMC free article] [PubMed] [Google Scholar]
- Reece-Hoyes JS, Pons C, Diallo A, Mori A, Shrestha S, Kadreppa S, Nelson J, Diprima S, Dricot A, Lajoie BR, et al. 2013. Extensive rewiring and complex evolutionary dynamics in a C. elegans multiparameter transcription factor network. Mol Cell 51: 116–127. 10.1016/j.molcel.2013.05.018 [DOI] [PMC free article] [PubMed] [Google Scholar]
- Rheinbay E, Parasuraman P, Grimsby J, Tiao G, Engreitz JM, Kim J, Lawrence MS, Taylor-Weiner A, Rodriguez-Cuevas S, Rosenberg M, et al. 2017. Recurrent and functional regulatory mutations in breast cancer. Nature 547: 55–60. 10.1038/nature22992. [DOI] [PMC free article] [PubMed] [Google Scholar]
- Robertson G, Hirst M, Bainbridge M, Bilenky M, Zhao Y, Zeng T, Euskirchen G, Bernier B, Varhol R, Delaney A, et al. 2007. Genome-wide profiles of STAT1 DNA association using chromatin immunoprecipitation and massively parallel sequencing. Nat Methods 4: 651–657. 10.1038/nmeth1068 [DOI] [PubMed] [Google Scholar]
- Rozowsky J, Euskirchen G, Auerbach RK, Zhang ZD, Gibson T, Bjornson R, Carriero N, Snyder M, Gerstein MB. 2009. PeakSeq enables systematic scoring of ChIP-seq experiments relative to controls. Nat Biotechnol 27: 66–75. 10.1038/nbt.1518 [DOI] [PMC free article] [PubMed] [Google Scholar]
- Sewell JA, Fuxman Bass JI. 2018. Options and considerations when using a yeast one-hybrid system. Methods Mol Biol 1794: 119–130. 10.1007/978-1-4939-7871-7_8 [DOI] [PubMed] [Google Scholar]
- Talebzadeh M, Zare-Mirakabad F. 2014. Transcription factor binding sites prediction based on modified nucleosomes. PLoS One 9: e89226 10.1371/journal.pone.0089226 [DOI] [PMC free article] [PubMed] [Google Scholar]
- Touzet H, Varré JS. 2007. Efficient and accurate P-value computation for Position Weight Matrices. Algorithms Mol Biol 2: 15 10.1186/1748-7188-2-15 [DOI] [PMC free article] [PubMed] [Google Scholar]
- Uhlen M, Zhang C, Lee S, Sjostedt E, Fagerberg L, Bidkhori G, Benfeitas R, Arif M, Liu Z, Edfors F, et al. 2017. A pathology atlas of the human cancer transcriptome. Science 357: eaan2507 10.1126/science.aan2507 [DOI] [PubMed] [Google Scholar]
- Walsh K, Shiojima I. 2007. Cardiac growth and angiogenesis coordinated by intertissue interactions. J Clin Invest 117: 3176–3179. 10.1172/JCI34126 [DOI] [PMC free article] [PubMed] [Google Scholar]
- Ward MC, Wilson MD, Barbosa-Morais NL, Schmidt D, Stark R, Pan Q, Schwalie PC, Menon S, Lukk M, Watt S, et al. 2013. Latent regulatory potential of human-specific repetitive elements. Mol Cell 49: 262–272. 10.1016/j.molcel.2012.11.013 [DOI] [PMC free article] [PubMed] [Google Scholar]
- Weirauch MT, Yang A, Albu M, Cote AG, Montenegro-Montero A, Drewe P, Najafabadi HS, Lambert SA, Mann I, Cook K, et al. 2014. Determination and inference of eukaryotic transcription factor sequence specificity. Cell 158: 1431–1443. 10.1016/j.cell.2014.08.009 [DOI] [PMC free article] [PubMed] [Google Scholar]
- Whitney IE, Keeley PW, St John AJ, Kautzman AG, Kay JN, Reese BE. 2014. Sox2 regulates cholinergic amacrine cell positioning and dendritic stratification in the retina. J Neurosci 34: 10109–10121. 10.1523/JNEUROSCI.0415-14.2014 [DOI] [PMC free article] [PubMed] [Google Scholar]
- Wu S, Huang P, Li C, Huang Y, Li X, Wang Y, Chen C, Lv Z, Tang A, Sun X, et al. 2014. Telomerase reverse transcriptase gene promoter mutations help discern the origin of urogenital tumors: a genomic and molecular study. Eur Urol 65: 274–277. 10.1016/j.eururo.2013.10.038 [DOI] [PubMed] [Google Scholar]
- Zhao Y, Stormo GD. 2011. Quantitative analysis demonstrates most transcription factors require only simple models of specificity. Nat Biotechnol 29: 480–483. 10.1038/nbt.1893 [DOI] [PMC free article] [PubMed] [Google Scholar]
- Zhu F, Farnung L, Kaasinen E, Sahu B, Yin Y, Wei B, Dodonova SO, Nitta KR, Morgunova E, Taipale M, et al. 2018. The interaction landscape between transcription factors and the nucleosome. Nature 562: 76–81. 10.1038/s41586-018-0549-5 [DOI] [PMC free article] [PubMed] [Google Scholar]
- Zia A, Moses AM. 2012. Towards a theoretical understanding of false positives in DNA motif finding. BMC Bioinformatics 13: 151 10.1186/1471-2105-13-151 [DOI] [PMC free article] [PubMed] [Google Scholar]
Associated Data
This section collects any data citations, data availability statements, or supplementary materials included in this article.