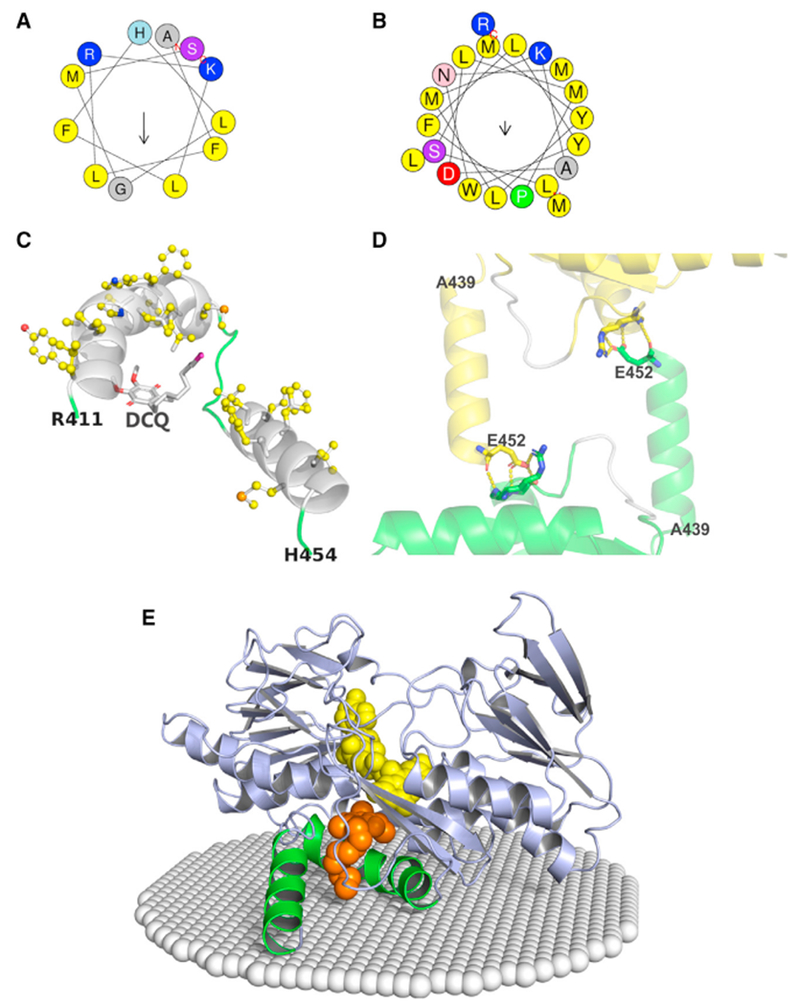
Figure 3. The C-Terminal Membrane-Binding Domain of SQOR.

(A and B) Helical wheels of the C-terminal (A) and penultimate C-terminal (B) helices. Residues are color coded according to the type of amino acid: nonpolar (yellow); polar (purple or pink); positively charged (blue); negatively charged (red). Arrows represent hydrophobic moments. Analysis was performed using heliQuest (http://heliquest.ipmc.cnrs.fr/) (Gautier et al., 2008).
(C) The cartoon diagram provides a view from the membrane interior of the C-terminal and penultimate C-terminal helices (white), adjacent loop regions (green), and DCQ (sticks); nonpolar residues are shown as balls and sticks with carbons colored yellow. The decyl tail of DCQ points toward the membrane-facing surface; the tip of the tail (colored magenta) protrudes from the CoQ binding cavity.
(D) Crystallographic packing constraints on the C-terminal helix (Ala439-Glu452). Chain A from one asymmetric unit and an adjacent symmetry-related chain D are shown as cartoons colored green and yellow, respectively, except for a portion of a loop (400-405), which is colored white in both chains. The C-terminal helix touches loop 400-405, but makes no specific contacts. Glu452, the Arg411- Ser413 peptide backbone, and the side chains of Arg411 and Ser413 are shown as sticks. Hydrogen bonds are indicated by the yellow dotted lines.
(E) The cartoon diagram shows the spatial position of SQOR in the inner mitochondrial membrane (white spheres) that was calculated using the PPM server (http://opm.phar.umich.edu/server.php) (Lomize et al., 2011). The C-terminal and penultimate C-terminal helices are colored green; all other regions are colored blue. FAD and DCQ are shown as spheres, colored yellow and gold, respectively.
