

SUMMARY
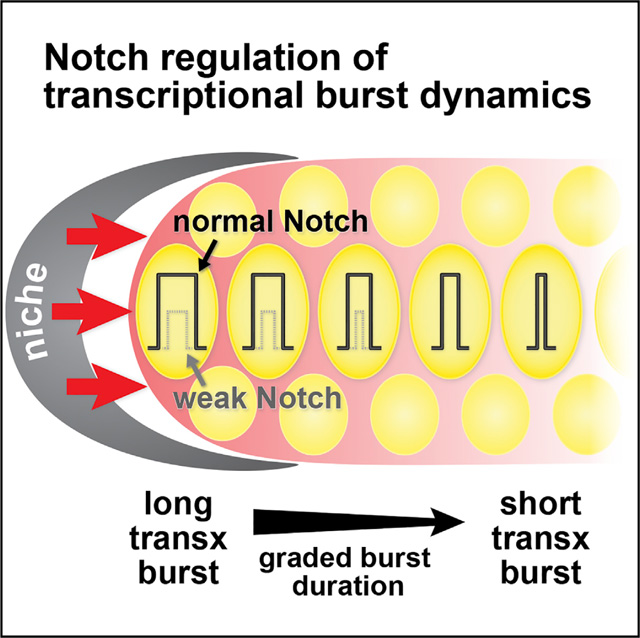
Transcription is well known to be inherently stochastic and episodic, but the regulation of transcriptional dynamics is not well understood. Here, we analyze how Notch signaling modulates transcriptional bursting during animal development. Our focus is Notch regulation of transcription in germline stem cells of the nematode C. elegans. Using the MS2 system to visualize nascent transcripts and live imaging to record dynamics, we analyze bursting as a function of position within the intact animal. We find that Notch-dependent transcriptional activation is indeed “bursty”; that wild-type Notch modulates burst duration (ON-time) rather than duration of pauses between bursts (OFF-time) or mean burst intensity; and that a mutant Notch receptor, which is compromised for assembly into the Notch transcription factor complex, primarily modifies burst size (duration 3 intensity). These analyses thus visualize the effect of a canonical signaling pathway on meta-zoan transcriptional bursting in its native context.
In Brief
Lee et al. assay Notch regulation of transcription in C. elegans germline stem cells within the intact animal. They find that Notch signaling modulates the duration of transcriptional burst and not the intensity of signaling or the time between bursts.
Graphical Abstract
INTRODUCTION
Transcriptional dynamics have entered a new era (Liu and Tjian, 2018; Nicolas et al., 2017). Classical studies discovered dynamic transcriptional responses to metabolites (Jacob and Monod, 1961) as well as dynamic spatiotemporal transcriptional patterns during development (De Robertis et al., 2000; McGinnis and Krumlauf, 1992). Yet the past decade of now neo-classical studies revealed that nascent transcripts are generated in dynamic “bursts” in virtually all cells from bacteria to humans (Chubb et al., 2006; Golding et al., 2005; Raj et al., 2006). This universal phenomenon raises new and exciting questions about how bursting is modulated by transcriptional regulators. Although progress has been made on this front (Corrigan and Chubb, 2014; Kafri et al., 2016; Larson et al., 2013; Molina et al., 2013; Senecal et al., 2014), most studies have relied on indirect measures (e.g., luminescence of reporter protein) and have been conducted in non-native systems (e.g., tissue culture cells). Only a few pioneering studies have visualized transcriptional bursting in the native context of Drosophila embryos (Bothma et al., 2014; Fukaya et al., 2016; Lucas et al., 2013). A major gap in our understanding is how intercellular signaling and dedicated transcriptional regulators modulate bursting in an intact meta-zoan as they guide development in its native context.
Here we address this gap by analyzing the dynamics of the transcriptional response to Notch signaling—in an intact animal as Notch maintains stem cells within their niche. Notch signaling is central to many aspects of development across metazoan phylogeny, and when aberrant can cause human disease (Artavanis-Tsakonas et al., 1999; Kopan and Ilagan, 2009). The backbone of the Notch molecular mechanism is conserved across animal phylogeny (Bray, 2016; Kovall et al., 2017). Briefly, the binding of Notch ligands expressed on the surface of the signaling cell to Notch receptors expressed on the surface of the receiving cell triggers receptor cleavage. The liberated Notch intracellular domain (NICD) then enters the nucleus and assembles into a complex to activate transcription of Notch-dependent genes. Many studies have analyzed the Notch transcriptional response in vivo (Hoyle and Ish-Horowicz, 2013; Ilagan et al., 2011; Imayoshi et al., 2013; Jenkins et al., 2015; Kershner et al., 2014; Shimojo et al., 2008), but only one smFISH study had sufficient resolution to reveal its probabilistic nature (Lee et al., 2016). Notch is thus a prime candidate for understanding how a canonical signaling pathway regulates the dynamics of transcriptional bursting. A recent study reported that different Notch ligands elicit responses with distinct dynamics, but this was done in cultured cells and did not directly assess transcriptional bursting (Nandagopal et al., 2018). An approach that directly assesses Notch-dependent transcriptional dynamics in its in vivo context is therefore timely.
We focus our study on GLP-1/Notch signaling in the C. elegans gonad (Figures 1A and 1B) for several reasons. First, its biological context is both important and conserved. Notch maintains stem and progenitor cells from nematodes to vertebrates (Austin and Kimble, 1987; Duncan et al., 2005; Gaiano and Fishell, 2002; van Es et al., 2005). In the nematode, GLP-1/Notch signaling is the major regulator that maintains germline stem cells (GSCs) (Austin and Kimble, 1987). Second, the tissue architecture is simple, well defined, and accessible to imaging within an intact transparent animal. Notch ligands are expressed in a well-defined mesenchymal cell that provides the niche (Henderson et al., 1994; Nadarajan et al., 2009; Tax et al., 1994), whereas GLP-1/Notch receptors are expressed in GSCs (Crittenden et al., 1994). Third, the key downstream genes are known. GLP-1/Notch activates transcription of sygl-1 and lst-1, which are themselves crucial for stem cell maintenance (Kershner et al., 2014; Shin et al., 2017). Indeed, GLP-1/Notch and its key targets maintain a pool of 50 germ cells in a naïve stem cell-like state (Cinquin et al., 2010). Fourth, signaling is sustained throughout the life of the animal to continuously maintain stem cells (Austin and Kimble, 1987). This system therefore provides an exceptionally tractable platform to analyze how GLP-1/Notch regulates transcriptional bursting.
Figure 1. Live Imaging of Notch-Dependent Transcriptional Activation.

(A) Diagram of C. elegans adult. GLP-1/Notch signaling (red) from the niche (dark gray) maintains a pool of germline stem cells (GSCs, yellow) at the distal end of U-shaped gonadal arms (light gray).
(B) Diagram of distal gonad with GLP-1/Notch sending and receiving cells. The single-celled niche (dark gray) expresses Notch ligands; the GLP-1/Notch receptor is expressed in naive germ cells in the GSC pool (yellow) as well as in transit cells as they move along the distal to proximal axis toward overt differentiation (green to blue). These naive and transit pools make up the progenitor zone. The GSC pool ends 6–8 germ cell diameters (gcd) on average from the niche (downward black arrow) while the progenitor zone (PZ) ends 19–22 gcd from the niche (double arrow). smFISH revealed a gradient of GLP-1/Notch-dependent active transcription sites across the GSC pool (graded red) (Lee et al., 2016).
(C) MS2 system. MS2 coat protein (MCP) fused to GFP binds to MS2 loops in RNA. Note that MCP binds as a dimer, and the number of MS2 loops is actually 24, neither of which are depicted for simplicity.
(D) Transgenes for MS2 system used in this work. Exons are boxes, introns are connecting lines. Above, operon encoding MCP::superfolder GFP to visualize sygl-1 transcripts and H2B::mCherry to mark nuclei. The operon is driven by the mex-5 germline promoter, but trans-spliced to produce two transcripts. SL2, trans-spliced leader. Below, sygl-1 gene with 24 MS2 loops inserted into the sygl-1 5’ UTR, just before start codon. Exons include untranslated (gray) and coding regions (yellow).
(E) Visualization of Notch-dependent sygl-1 nascent transcripts in the distal gonad of a living adult (24 h post mid-L4 stage), using the MS2 system and confocal imaging. Asterisk marks the distal end of the gonad, where the niche resides; dashed lines mark the gonadal outlines. Scale bar, 5 mm.
(F) Montages of boxed regions (1 or 2) in (E). Each arrow or arrowhead traces a single MCP::GFP dot over time, as seen in the time-lapse movie (Video S1). Time points are shown in each image.
The stage was set for this current work by a single-molecule FISH (smFISH) analysis of the Notch transcriptional response at endogenous sygl-1 and lst-1 loci in GSCs (Lee et al., 2016). Both nascent transcripts and mature mRNAs were visualized at high resolution and quantitated as a function of cell position within the GSC pool. The generation of active transcription sites (ATS) at both sygl-1 and lst-1 was Notch dependent and stochastic, as predicted; yet the probability of their activation was unexpectedly graded across the pool, and that gradation was found to reflect a gradient in Notch signaling strength (Figure 1B). The sygl-1 and lst-1 mRNAs and proteins, by contrast, were expressed more uniformly (Lee et al., 2016; Shin et al., 2017), highlighting the need to focus specifically on nascent transcripts to analyze the graded Notch effect on transcriptional bursting.
Here, we use the C. elegans gonad to understand how Notch modulates transcriptional bursting in a native context. In this work, we focus on live imaging of sygl-1 nascent transcripts to confirm the existence of transcriptional bursting and to quantitate burst features as a function of position within the stem cell pool. Arguably our most important conclusion is that wild-type Notch signaling modulates or “tunes” the duration of active transcriptional bursts, but has little or no effect on duration of the inactive pauses between bursts or burst intensity. This result contrasts with conclusions of other studies, mostly in tissue culture, which highlight burst frequency as the primary target of regulation (see Discussion).
RESULTS
Live Imaging of Notch-Dependent Transcriptional Activation
To visualize the dynamics of Notch-dependent transcription, we implemented the MS2 system in the C. elegans germline. This system relies on a high-affinity interaction between MS2 coat protein (MCP) and MS2 RNA loops to bring GFP to transcripts (Figure 1C) (Bertrand et al., 1998; Larson et al., 2009). We used two integrated transgenes to express the system in germ cells (Figure 1D). The first is an operon that employs a strong germline promoter, mex-5, to drive expression of two proteins, MCP fused to superfolder GFP (MCP::GFP hereafter) to detect nascent transcripts and histone subunit H2B fused to mCherry to mark nuclei. The second carries a Notch target gene, sygl-1, plus 24 MS2 loops inserted into its 5’ UTR. Without MS2 loops, this transgene rescues a sygl-1 null mutant, but with MS2 loops, it makes no SYGL-1 protein (Figure S1A). Therefore, overall SYGL-1 abundance is likely not affected.
Our MS2 system allows visualization of sygl-1 nascent transcripts in living animals (Figures 1E and 1F). To image them over time, we immobilized intact animals on a microscope slide, using microbeads and serotonin as previously reported for other C. elegans live imaging (Kim et al., 2013; Rog and Dernburg, 2015). This treatment impeded body movement, but not pharyngeal pumping or egg laying (see STAR Methods). Moreover, in the distal third (1–7 germ cell diameters, gcd) of the progenitor zone (PZ), our region of interest for this study, this treatment did not affect either the rate of germ cell movement along the distal-proximal axis or the frequency of germ cell divisions (see STAR Methods), both consistent with previous studies (Crittenden et al., 2006; Gerhold et al., 2015; Rosu and Cohen-Fix, 2017). Once immobilized, we used a confocal microscope equipped with a temperature-controlled stage, set at 20 C, to image the distal two-thirds of the PZ in live animals. Images were initially taken at intervals of 1, 2, 5, or 10 min (see STAR Methods). The vast majority of ON- and OFF-times were greater than 5 min, and we therefore chose the 5-min interval as optimal to capture results with minimal light exposure. Subsequent analyses were done over extended periods (3–9 h). MCP::GFP dots and H2B::mCherry nuclei were both easily detected (Figures 1E and 1F; Videos S1 and S2) and overlapped with the H2B::mCherry nuclear marker (106 dots from 6 gonads traced over time, e.g., Figure 1F). Next, we treated animals with a-amanitin, a Pol II inhibitor that abolishes transcription (Lindell et al., 1970). All MCP::GFP dots disappeared after a-amanitin treatment, and then reappeared after a wash to remove a-amanitin (Figure S1B). Therefore, the MCP::GFP dots reflect transcription.
To ask if Notch-dependent transcriptional activation occurs in bursts, we traced MCP::GFP dots in 3D for several hours and recorded their signal intensities over time (n = 177 dots in 10 gonads). GFP signal intensities oscillated between well above background (“ON”) and indistinguishable from background (“OFF”) (Videos S1 and S2). Because the MCP::GFP dots did not move dramatically within their nucleus (see STAR Methods), we were able to identify individual loci through consecutive bursts.
Importantly, the dynamic MCP::GFP dots were scored at 5-mm intervals across and beyond the GSC pool within the PZ; these 5-mm intervals were then translated to the more traditional measure of number of gcd from the distal end. The vast majority of MCP::GFP dots were restricted to the GSC pool region (1 to ~35 mm, or 1 to 6–8 gcd from the distal end), similar to the restriction of sygl-1 ATS in fixed samples (Lee et al., 2016). The rare MCP::GFP dots found outside that region were just beyond, and no dots were seen proximal to 40 mm or 9 gcd from the distal end. By contrast, nuclei marked with H2B::mCherry were seen throughout the gonad, as expected, given the germline promoter (Figure 1E; Videos S1 and S2). We conclude that Notch-dependent activation occurs in bursts within germ cells known to be regulated by GLP-1/Notch signaling from the niche, and that low level or “noisy” bursting was undetectable beyond those cells.
A Gradient in Duration of Notch-Dependent Transcriptional Bursts
Next, we analyzed the key dynamic burst features (Figure 2A) for each Notch-dependent burst and did so as a function of position along the gonadal axis (Figure 2B). Transcriptional bursts are episodic with periods of activity (ON-times) punctuated by periods of inactivity (OFF-times). From the intensity of MCP::GFP nuclear signals recorded over time and their normalization to background (see STAR Methods), we determined the duration of ON-time and OFF-time in addition to mean signal intensity over the transcriptionally active period. Each feature was scored at 5-mm intervals across and beyond the GSC pool. Figures 2C and 2D show representative graphs for recordings at two distinct positions: one is near the niche (Figure 2C), comparable to the position of box 1 in Figure 1E, and one is more proximal (Figure 2D), comparable to the position of box 2 in Figure 1E.
Figure 2. Dynamics of Notch-Dependent Transcriptional Activation.

(A) Key features of transcriptional bursts. MCP::GFP signal intensities are recorded over time to determine (1) duration of the burst (ON, red double arrow), (2) duration of the pause between bursts (OFF, gray double arrow), and (3) mean signal intensity during the burst (blue double arrow).
(B) Reference for position in the distal gonad. Niche, gray; Notch signaling, red arrows; gradient of Notch transcriptional response, graded red; germ cell nuclei, yellow; digits, number of germ cell diameters (gcd) along the distal-proximal axis from the niche, the convention for germ cell position. The GSC pool extends from gcd 1 to gcd 6–8; the downward black arrow marks the average location where the pool ends (Cinquin et al., 2010; Rosu and Cohen-Fix, 2017).(C and D) MCP::GFP signal intensities (arbitrary unit, a.u.) are traced at 5-min intervals from a time-lapse movie (Video S1) and normalized to background (see STAR Methods). Intervals with persisting signals from nascent transcripts (MCP::GFP) are recorded as “ON” (red bar above line plot), and intervals when the signal is essentially at background are recorded as “OFF” (gray bar).(E–H) The downward black arrow marks the average end of the GSC pool, as in (B). Error bar: standard error of the mean (SEM).(E) Durations of active ON state (ON-times) for all MCP::GFP dots are plotted as a function of position, either in mm (bottom) or number of germ cell diameters [gcd] (top) from the distal end of the gonad. No transcriptional bursts were seen proximal to 40 mm from the distal end within the progenitor zone. n = 460 transcriptional bursts from 177 loci in 10 gonads of living adults.(F) Durations of the inactive OFF state (OFF-times) are plotted as a function of position, as in (C). n = 400 rest periods (177 loci from 10 gonads). n.s.: not significant by any pairwise t test in the bar graph.(G) Signal intensities are averaged over the duration of a transcriptional burst and plotted as a function of position. The blue line marks overall mean signal intensities along the axis, as in (C).(H) Number of sygl-1 active bursts in each nucleus, averaged over time, is plotted as a function of position, as in (C).
Our analyses revealed that the lengths of transcriptional burst activity, or ON-times, were sharply graded across the GSC pool—from 70 min at its distal end to 10 min at its proximal end (Figure 2E). By contrast, periods of transcriptional inactivity, or OFF-times, were not graded but instead essentially constant across the pool, with average pauses of roughly half an hour (Figure 2F). The mean intensities of individual bursts were highly variable (Figure 2G, dots), a phenomenon also seen with smFISH (Lee et al., 2016), but the averages for all individual bursts at a given position were comparable across the GSC pool (Figure 2G, blue line). However, the number of actively transcribing loci was graded, with the most distal nuclei having the highest average number of MCP::GFP dots (Figure 2H). The overall transcriptional activity per nucleus was therefore also graded when considered at the cellular level (Figure S2A), despite the uniform average burst intensity assessed at the level of individual chromosomal loci (Figure 2G). These burst dynamics are consistent with results from the previously reported smFISH study (Figure S2B) (Lee et al., 2016). We conclude that the graded transcriptional response to Notch signaling is generated by a gradient in the duration of active transcriptional bursting (ON-time) rather than a gradient in either burst intensity or the duration of transcriptional inactivity (OFF-time). Because ON-times are graded, burst sizes (ON-time 3 mean signal intensity) are also graded. We conclude that the Notch transcriptional response is “tuned” at the level of burst duration.
Stochasticity of Notch-Dependent Burst Dynamics
Next, we investigated the independence or stochasticity of Notch-dependent bursts at individual loci. For this analysis, we first investigated consecutive bursts at the same sygl-1 locus (Figure 3A). To this end, we not only analyzed data from all consecutive bursts, regardless of position, but also assessed the data as a function of position (Figure 3B, dot colors correspond to position). Essentially no correlation was found for either the summed data (Pearson’s r = 0.1) or position-specific data (r ranged from 0.03 to 0.19, depending on position) (Figure 3B, see legend for r values by position). Moreover, differences in the durations between consecutive bursts were highly variable, ranging over a span of 250 min (Figure 3C). We also compared other paired features, such as durations of an active burst and its following inactive pause, durations of a pause and its following burst, and durations of consecutive pauses. These additional pairs also failed to correlate, with r values near zero, regardless of position, and a broad distribution in differences (Figures S3A–S3F). Thus, the ON-times of consecutive bursts cannot be predicted even at the same position within the gonad (Figure 3B), despite their gradient (Figure 2E). A similar stochasticity was found when one sygl-1 locus was compared to a different sygl-1 locus in the same nucleus (Figure 3D; see STAR Methods). The percentage of time that both loci were in the same state was equivalent to that predicted by chance. We conclude that Notch-dependent ON- and OFF-times are stochastic at any given locus.
Figure 3. Stochastic Notch-Dependent Transcriptional Dynamics.

(A) Experimental design. Left, a single germ cell nucleus (yellow) with two sygl-1 loci (white). Right, hypothetical MCP::GFP signal intensities (y axis) at each locus are plotted over time (x axis). Comparisons are made in either of two ways—between consecutive bursts at the same locus or between bursts at the two loci.
(B) Comparison of burst ON-times for each of two consecutive transcriptional bursts at the same locus. Each dot represents a pair of consecutive bursts (burst 1 & 2). n = 330 pairs. The Pearson’s correlation coefficient for all pairs, regardless of position, shows little or no correlation (r = 0.10); the same is true when analyzed position by position (r values: 1–10 mm (black dots), –0.13; 10–20 mm (red), –0.16; 20–30 mm (green), 0.19; 30 mm—end (blue), 0.03).
(C) Violin plot of differences between ON-times at consecutive burst pairs in (B). Bars mark the mean (middle horizontal line, –1.56 min) and standard deviation (top and bottom horizontal lines, 35.0 min).
(D) Comparison of transcriptional states at different sygl-1 loci in the same nucleus over the span of the movie. Both can be active (both ON), inactive (both OFF), or distinct (one ON, one OFF). The percentage of time for each situation is plotted. Dark gray bars show data from movies; light gray bars show predictions based on chance (see STAR Methods). Error bar: SEM, n.s.: not significant (p > 0.05 by t test).
(E) Comparisons of mean signal intensities for each of two consecutive transcriptional bursts at the same locus. Each dot represents a pair of consecutive bursts (burst 1 and 2). n = 330 pairs. The Pearson’s correlation coefficient for all pairs, regardless of position, shows a modest correlation (r = 0.54); the same is true when analyzed position by position: r values: 1–10 mm (black dots), 0.54; 10–20 mm (red), 0.46; 20–30 mm (green), 0.63; 30 mm—end (blue), 0.58.
(F) Violin plot of differences between mean signal intensities at consecutive burst pairs in (E). Bars mark mean (–171.8 a.u.) and standard deviation (541.8 a.u.) as in (C).
(G) Comparisons of mean signal intensities at different loci in the same nucleus over time. n = 1,108 pairs. Pearson’s r = 0.21: little correlation.
Burst intensities, on the other hand, were not fully independent at consecutive bursts from the same locus. Their correlation was modest, either when summed or by position (Figure 3E, r = 0.54 when summed; see legend for r values by position). By contrast, no correlation was seen for random pairings (Figures S4A and S4B) or for pairings between synchronous bursts at different loci within the same nucleus (Figures 3G, S4C, and S4D). In addition, differences between average intensities of consecutive bursts at the same locus varied less than randomly paired average intensities or those recorded at different loci in the same nucleus (compare Figure 3F to Figure S4B). We conclude that Notch-dependent burst intensities are not fully independent at a single locus, but are independent between loci in the same nucleus.
Notch NICD Modulation of Burst Dynamics
The graded Notch-dependent transcriptional response reflects a gradient in “signaling strength,” a rough measure of the entire pathway (Lee et al., 2016). To assess the role of the GLP-1/Notch NICD specifically, we employed the temperature-sensitive Notch receptor mutant, glp-1(q224), which has weaker than normal biological activity at permissive temperature (15 C) and essentially no activity at restrictive temperature (25 C) (Austin and Kimble, 1987). This mutant harbors a single amino acid change in its NICD, which weakens stability of the Notch-dependent transcription activation complex (Petcherski and Kimble, 2000). By smFISH, the Notch response was reduced in this mutant at 15 C, including a lower probability of transcription and fewer sygl-1 nascent transcripts at each ATS (Figure S2B) (Lee et al., 2016). In wild-type animals, by contrast, the probability of transcription and nascent transcript output were both equivalent at 15 C, 20 C, and 25 C (Lee et al., 2016).
To understand the role of the NICD in bursting dynamics, we introduced our MS2 system into animals homozygous for glp-1(q224). The resultant strain was phenotypically indistinguishable from glp-1(q224) on its own (see STAR Methods). We recorded MCP::GFP signal intensities over time in glp-1(q224) at 15 C (Videos S3 and S4), and compared their dynamic burst features to wild type (Figure 4). Mutant ON-times decreased roughly 3-fold, but, as in the wild type, they were graded across the GSC pool (Figure 4A). Mutant OFF-times, by contrast, increased about 1.5-fold over wild type and were not graded (Figure 4B). As in wild type, the mean intensities for individual bursts were highly variable, but their averages at each position were fairly constant across the GSC pool and about 2-fold lower than wild type (Figure 4C, solid versus dotted line). These decreases in both burst duration and intensity thus lead to a dramatic decrease in burst size (duration 3 intensity). The number of transcriptionally active loci per nucleus decreased by 3- to 4-fold at each position and were again graded (Figure 4D). These live imaging data are consistent with findings with smFISH (Figure S2B) (Lee et al., 2016). In sum, an NICD that is compromised for assembly into the Notch-dependent transcription activation complex causes decreases in both burst duration and intensity, but as in the wild type, burst duration is graded while intensity is not graded.
Figure 4. Effect of Notch Receptor Strength on Burst Dynamics.

(A–D) Comparisons of transcriptional burst features driven by the wild type (WT) and the weak mutant GLP-1/Notch receptor, glp-1(q224), all plotted as a function of position. Note that GSC pool size is smaller in the mutant than wild type (downward arrows mark GSC pool end, as in Figure 2B). Error bars: SEM.
(A) Burst durations (ON-times) in glp-1(q224) mutant (red) and WT (light gray). ON-times are dramatically shorter in the mutant, but still graded across the GSC pool. No bursts were seen proximal to 40 mm from the distal end; error bars are omitted with fewer than three bursts.
(B) Pause durations (OFF-times) inmutant (dark gray) and WT (light gray). OFF-times are 1.5-fold longer in the mutant than WT, but they remain comparable across the GSCpool(though more variablethanWT).
(C) MCP::GFP signal intensities as in Figure 2G. All dots reflect data from glp-1(q224) movies; each dot shows the signal intensity averaged over one burst. Lines mark the average of all these individual mean signal intensities as a function of position: solid light blue line, glp-1(q224); dashed blue line, wild type.
(D) Number of transcriptional bursts per nucleus averaged over time and plotted as a function of position, as in Figure 2H. The mutant receptor lowers that number.
DISCUSSION
Using the MS2 system and live imaging of intact nematodes, we have visualized Notch-regulated transcriptional bursting over time during normal development. This feat took advantage of a particularly tractable case of Notch signaling that maintains GSCs in the nematode C. elegans. Our study stands out among other studies of regulated transcriptional bursting by its analysis of regulation in a native metazoan context, and its focus on effects of a canonical signaling pathway.
Notch-Dependent Transcriptional Activation Is “Bursty” in Its Native Context
A major conclusion from this work is that Notch-dependent transcription is episodic or “bursty” in intact animals as niche signaling maintains stem cells. Although this was expected, both from the universality of the phenomenon (Chubb et al., 2006; Golding et al., 2005; Raj et al., 2006) and from the probabilistic nature of Notch-dependent transcription seen with smFISH (Lee et al., 2016), other possibilities were feasible. For example, Notch signaling might have driven transcription from an inherently noisy and bursty state to a continuous mode. No studies prior to this work had looked at the dynamics of Notch-dependent transcription, or for that matter any other canonical signaling pathway in its native context. Our results provide compelling evidence that Notch-dependent transcriptional activation is indeed bursty in vivo. By extension, we suggest that transcription activated by other canonical signaling pathways will also be bursty.
A growing literature on the regulation of transcriptional bursting in cultured cells has focused on the idea that transcriptional regulators increase burst frequency of otherwise noisy, sporadic transcription (Corrigan and Chubb, 2014; Kafri et al., 2016; Larson et al., 2013; Molina et al., 2013; Senecal et al., 2014). Our analyses of Notch-regulated transcriptional bursting in its native context differ from this consensus in a striking way: sygl-1 bursting was undetectable outside the region where Notch maintains a stem cell state and prevents differentiation (Austin and Kimble, 1987; Cinquin et al., 2010; Kershner et al., 2014). Why do we not see a low level of “noisy” bursting outside the pool? One likely explanation is detection, because the highly sensitive smFISH did in fact detect exceedingly rare sygl-1 transcription outside the GSC pool (1 ATS on average per ~130 nuclei in the interval of 50–60 mm from the distal end [11–12 gcd] compared to 96 ATS on average per ~130 nuclei in the interval of 0–10 mm from the distal end [1–2 gcd]) (Lee et al., 2016). But in addition, we suggest that “noisy” transcriptional bursting is silenced in its natural in vivo setting by other factors. For example, corepressors acting with LAG-1/CSL (Bray and Furriols, 2001) or chromatin regulators (e.g., PRC2) (Patel et al., 2012) can drive transcription to a nearly undetectable level and introduce a deep repressive state. Identification of such regulators is a crucial line of future research.
Notch Signaling Modulates Burst Duration
A second major conclusion from this work is that in vivo Notch signaling modulates burst duration (ON-time) and thus determines the probability of Notch-dependent transcriptional activation. A previous study used smFISH to detect transcription at two wild-type endogenous genes and discovered a spatial gradient in the probability of Notch-dependent transcription (Lee et al., 2016). Here, we use live imaging to detect transcription from a transgenic reporter and discover that the ON-times of transcriptional bursting are also steeply graded, but OFF-times and mean burst intensities are not graded; instead OFF-times and mean burst intensities are essentially constant across the GSC pool. The striking agreement between the graded transcriptional probability seen with smFISH and the graded burst duration seen with live imaging suggests that modulation of burst duration is the key determinant of Notch-dependent transcriptional probability.
The Notch-dependent tuning of burst duration differs markedly from what has been found for other metazoan transcriptional regulators. For example, steroid-mediated gene activation was found to increase burst frequency by shortening burst OFF-times (Fritzsch et al., 2018; Larson et al., 2013), and Wnt signaling increased burst frequency by modulating both ON- and OFF-times (Kafri et al., 2016). Indeed, modulation of burst frequency via regulation of OFF-times has been suggested as a universal phenomenon (Nicolas et al., 2017). We consider two possible explanations for our distinct results. First, the effect on burst duration may be a special feature of Notch regulation. Indeed, a strikingly similar effect of Notch signaling on burst duration was discovered independently in Drosophila embryos (Falo-Sanjuan et al., 2019, in this issue), suggesting a conserved phenomenon. Second, the Notch effect on burst duration may represent regulation typical of a native context, which was used for both our study and that in Drosophila (Falo-Sanjuan et al., 2019), but is rare among other studies. To distinguish between these possibilities, the effects of other canonical signaling pathways must be analyzed, if possible in their native context.
Effect of Notch Transcriptional Complex Stability on Transcriptional Burst Dynamics
Most analyses done in this work relied on signaling from the wild-type GLP-1/Notch receptor in a nearly native context (MS2 system was added with no detectable phenotypic effect), but we also assessed a mutant defective in the GLP-1/Notch receptor, again in the same nearly native context. This mutant harbors an amino acid substitution in the NICD, which causes weaker than normal assembly into the Notch-dependent transcription factor complex (Petcherski and Kimble, 2000). We found that the weaker NICD affected several burst features: it reduced burst ON-time and mean burst intensity, both by 2- to 3-fold, and it increased OFF-time by ~1.5-fold. Thus, as expected, stability of the transcription factor complex dramatically reduces transcriptional burst size, which is a function of both burst duration and burst intensity.
One might think a priori that the sygl-1 transcriptional gradient is caused by an NICD gradient that in turn leads to graded stability of Notch-dependent transcriptional complex. However, an NICD gradient would cause graded changes in all burst features. This was not seen. Instead, burst ON-time was the only graded feature, both in wild type and the mutant. By contrast, mean burst intensity and mean OFF-time remained essentially constant across space (though intensity was lower and OFF-time longer in the mutant than in the wild type). The gradient in transcriptional probability is therefore unlikely to reflect a simple NICD-dependent gradient in stability of the Notch-dependent ternary complex. We suggest instead that some other factor must be graded. Distinct Notch ligands were recently found to have specific effects on burst behavior (Nandagopal et al., 2018), albeit using a vastly different assay and kinetics than what we describe here. Something similar might occur in the C. elegans gonad, as the distal tip cell uses several ligands to activate GLP-1/Notch signaling (Crittenden et al., 2019; Henderson et al., 1994; Nadarajan et al., 2009) and the effects of each ligand on transcriptional bursting have not yet been explored. Other possibilities include effects of LAG-3/Mastermind, another key component of the Notch-dependent transcriptional complex (Petcherski and Kimble, 2000), turnover dynamics of chromatin modifications, or changes in the time the promoter is sustained in a phase-separated state. Understanding the molecular basis of this transcriptional gradient in burst duration is therefore a challenge for the future. Regardless, we emphasize that this work sets the stage for investigating the regulation of burst duration in an in vivo setting, which will reveal critical factors with potential impact for manipulation in humans.
Stochasticity of Notch-Dependent On-Times and OFF-Times
The stochasticity of Notch-dependent transcription was first discovered with smFISH (Lee et al., 2016), and the current live imaging analysis clarifies that stochasticity in terms of key burst features. It is arguably most notable that ON- and OFF-times are not correlated with each other, either for consecutive bursts at the same locus or for bursts at distinct loci within the same nucleus (r % 0.10 for the various pairings). The one exception is mean burst intensity, which shows a modest correlation (r = 0.54) for consecutive bursts at the same locus. Because a similar correlation was not seen for bursts at distinct loci in the same nucleus, either by smFISH or live imaging, we suggest that active promoters adopt one “configuration” that is sustained, at least in part, for consecutive bursts. The coupling of that configuration to both the inherent stochasticity of transcriptional bursting and its nuanced regulation would be expected to generate variable yet reproducible-on-average transcriptional activity in time and space. By this model, transcriptional activity would not simply reflect two states (ON/OFF) but instead a spectrum of configurations. A similar phenomenon was described as “multi-state behavior” for the estrogen response (Rodriguez et al., 2019). Distinct configurations might involve, for example, promoter-specific chromatin modifications (Lenhard et al., 2012) or promoter-specific phase-separation (Hnisz et al., 2017). Yet the striking result is the remarkable lack of correlation between most burst features.
STAR⋆METHODS
LEAD CONTACT AND MATERIALS AVAILABILITY
Further information and requests for resources and reagents should be directed to and will be fulfilled by the Lead Contact, Judith Kimble (jekimble@wisc.edu).
EXPERIMENTAL MODEL AND SUBJECT DETAILS
Nematode Strains and Culture
Most strains were maintained at 20 C as described in (Brenner, 1974); those carrying glp-1(q224) (Austin and Kimble, 1987) were maintained at 15 C. The wild type was N2 Bristol. Alleles, transgenes, and balancers are as follows: LG I: sygl-1(q828) (Shin et al., 2017), hT2[qIs48] (Siegfried and Kimble, 2002). LG II: ttTi5605 (Frøkjaer-Jensen et al., 2008), qSi49[Psygl-1::3×FLAG::sygl-1:: sygl-1 3’end] (Shin et al., 2017), qSi369[Psygl-1::24×MS2 loops::3×FLAG::sygl-1::sygl-1 3’end] II (this work). LG III: glp-1(q224) (Kodoyianni et al., 1992). LG V: oxTi365 (Frøkjær-Jensen et al., 2014), qsi370[Pmex-5::MS2 coat protein::linker::GFP::tbb-2 3’end::gpd-2 intergenic sequence::H2B::mCherry::unc-54 3’end] (this work).
METHOD DETAILS
Generation of Strains Carrying an MS2 System in the C. elegans Germline
Constructs: (1) pJK2014 [Psygl-1::24×MS2 loops::3×FLAG::sygl-1::sygl-1 3’end]. The construct containing sygl-1 tagged with 24×MS2 loops was cloned in two steps. First, the sygl-1 gene, including its open reading frame and previously described 5’ upstream and 3’ downstream sequences (Shin et al., 2017), was cloned into the Spe I site of pCFJ151 UniMos vector (Frøkjaer-Jensen et al., 2008) using the Gibson assembly method (Gibson et al., 2009). At this step, Not I and Pme I restriction sites were inserted just in front of the start codon of sygl-1. Second, to insert 24×MS2 loops in front of the start codon, the aforementioned plasmid and pCR4-MS2 (Addgene #31865) (Bertrand et al., 1998) were digested with Not I and Pme I restriction enzymes and ligated together using T4 DNA ligase (Roche #10481220001). The final product is pJK2014. (2) pJK2020 [Pmex-5::MS2 coat protein::linker::GFP::tbb-2 3’end::gpd-2 intergenic sequence::H2B::mCherry::unc-54 3’end]. This construct contains MS2 coat protein tagged with a codon optimized superfolder GFP (MCP::GFP) and mCherry-tagged histone 2B (H2B::mCherry), driven by the mex-5 promoter and tbb-2 (for MCP::GFP) and unc-54 (for H2B::mCherry) 3’end regulatory sequences (Merritt et al., 2008); MS2 coat protein (Addgene #27121) was fused with superfolder GFP (Kersey et al., 2016); Histone 2B was fused with mCherry (Merritt et al., 2008); gpd-2 inter-genic sequence was used to generate a trans-spliced operon (Huang et al., 2001). Of note, the nuclear localization sequence (NLS) in the original construct (Addgene #27121) (Fusco et al., 2003) was removed to minimize the MCP::GFP background in the nucleus. All amplified fragments were targeted to the Spe I site of the pCFJ151 UniMos vector (Frøkjaer-Jensen et al., 2008) using the Gibson assembly method (Gibson et al., 2009). The final product is pJK2020.
Transgenes: Single-copy transgenes were generated using the Mos1-mediated single-copy insertion method (MosSCI) (Frøkjaer-Jensen et al., 2008). Briefly, 50 ng/ml plasmid (pJK2014 or pJK2020, see Constructs) was microinjected into EG6699 or EG8082 along with transposase and co-injection markers. Integration was screened by Unc movement rescue, and further confirmed by PCR amplification of Mos insertion sites. At least two lines were generated for each construct and representative lines were selected for further characterization: qSi369 for 24×MS2 loops::sygl-1 and qSi370 for MCP::GFP; H2B::mCherry.
Final strains: To generate JK5896, a strain with the complete MS2 system in an otherwise wild-type background, animals carrying qSi369 or qSi370 were crossed with each other, and their progeny were validated using PCR and microscopy (green dots for qSi369 and red germ cell nuclei for qSi370). JK5896 had a normal growth rate (4 days to become adult, n=75), brood size (270 progeny after becoming gravid, n=5) and progenitor zone size (20 gcd, n=21) at 20 C, similar to those previously reported for wild type (Crittenden et al., 2006; Muschiol et al., 2009; Nehammer et al., 2015). To generate JK5943, a strain with the complete MS2 system in a glp-1(q224) background, JK5896 was crossed to glp-1(q224) (JK4605). A progeny of this cross was mated into the genetic balancer hT2[qIs48] for strain propagation purposes, and each locus was further homozygosed. The final progeny was validated by PCR, microscopy, and sterility at 25 C. Only JK5943 heterozygous for glp-1(q224), which was balanced with hT2[qIs48], was fertile at 20 C. For experiments, non-balancer carrying progeny of JK5943 homozygous for the glp-1(q224) allele were used. These animals raised at 15°C behaved comparably to JK4605 with respect to growth rate (~ 5 days to become adult, n=75) and progenitor zone size (~ 10 gcd, n=21), as previously reported for the glp-1 allele in JK4605 (Austin and Kimble, 1987; Fox and Schedl, 2015; Lee et al., 2016).
Worm Immobilization for Long-Term Live Imaging
Microscope slides for long-term live imaging were prepared as previously described (Kim et al., 2013), with a few modifications. First, 5–7.5% (w/v) agarose gel-pad slides (dissolved in M9) were freshly prepared. Then, a 0.5–2 μL suspension of polystyrene microbeads (Polysciences, 2.5% by volume, 0.1 mm diameter) was added to the middle of the gel-pad, immediately followed by serotonin (final concentration 20–25 mM, diluted in M9) to create a mixture of microbeads and serotonin. This mixture efficiently immobilizes worms on the microscope slide without affecting or halting their pharyngeal movement (3–5/sec), egg laying (2–5/hrs) or germ cell division(6.25 M-phases seen on average within any one hour in the region of 1 to 7–8 gcd), consistent with previous reports (Rosu and Cohen-Fix, 2017; Song and Avery, 2012; Teshiba et al., 2016) (also see Results). 10–15 staged young adult worms (24h past mid-fourth larval [L4] stage) were transferred to the gel-pad before the serotonin and microbeads solution dried (within a minute). A cover slip was placed gently on the gel-pad. VALAP (Vaseline, lanolin, and paraffin) was applied around the edges of the coverslip to prevent the microscope slide from drying over time. The slide was attached to a CherryTemp chip (Cherry Biotech, Rennes, France) and mounted on the CherryTemp chip holder located on the confocal microscope stage to keep a consistent temperature throughout the live imaging process. Live imaging was performed immediately afterwards.
Confocal Microscopy Setup for MS2 Live Imaging
All imaging was done using a Leica TCS SP8 (confocal laser scanner) equipped with a Leica HC PL APO CS2 63×/1.40 NA oil immersion objective, two sensitive hybrid detectors (HyDs) and standard and LAS image acquisition software (version 3.3.1 or X, Leica Microsystems Inc., Buffalo Grove, IL). Two channels were imaged simultaneously to capture MCP::GFP and H2B::mCherry at the same time, with bidirectional scanning at 900 Hz and 250% zoom factor with 512X512 or 1024X512 resolution. The green channel was imaged with the excitation laser at 488 nm (0.3–0.4% laser power, Argon, 40% gain) and the red channel with the excitation laser at 594 nm (0.6–1% laser power, HeNe, 40% gain), with a pinhole size at 105.1 mm. A line average of two snapshots was used for all channels. All imaging was done with HyDs, including DIC. Signal acquisition windows (a range of wavelength in which signals are collected by HyDs) were carefully selected to minimize bleed-through (each window started 10-nm longer than the excitation laser and spanned 50 nm). All gonads were imaged with a total z-depth of >15 μm and a z-step size of 0.4 μm. Worms that were not completely immobilized on the slide, or whose pharynges were not actively pumping, were excluded from live imaging and analyses. Multi-point imaging and autofocusing functions embedded in the LAS image acquisition software (3.3.1 or X) were used during all image acquisitions. Up to six gonads were imaged in each set of time-lapse recordings. Images were initially taken every 1, 2, 5, or 10 minutes, each for a period of around three hours, and a 5-minute interval was chosen as an optimal setting to capture the dynamics of the MCP::GFP signals with minimal light exposure. The vast majority of single ON or OFF time was more than 5 minutes. Autofocusing was conducted at every other time point in the DIC channel using the 594-nm laser. Occasionally, gonadal image drifting caused by slight movements of the animal or its gonad was corrected manually. For all imaging, the temperature controller, CherryTemp (Cherry Biotech, Rennes, France) with its accompanying software (Cherry Biotech TC) was used (wild type at 20 C, glp-1(q224) at 15 C).
Image Processing and Analysis
Images of C. elegans gonads in individual MS2 movies were aligned in two steps using customized, automated ImageJ (version 1.52h) macros (see Data and Code Availability). These macros use the ImageJ plug-in “StackReg” (Thévenaz et al., 1998) with modifications (e.g. choice of the reference image, direction for the alignment). First, gonads were aligned along the z-axis at each time point using the middle plane of the z-stack (the thickest region in the gonad) as a reference image. Then, these aligned z-stacks (at each time point) were aligned again through all time points to keep the gonad in the same position throughout the MS2 movies. These processes correct for subtle movements of the worm or natural gonadal displacements due to intestinal movement during feeding. A few images that were not properly corrected by the automated ImageJ macros were manually aligned, using customized ImageJ codes (see Data and Code Availability). All gonadal images were split in halves on the z-axis for further analysis to minimize overlap of germ cell nuclei in the z-projected images. A circular region of interest (ROI, 1 -μm diameter) was drawn on each MCP::GFP dot in the z-projected (sum slices) gonadal images to measure signal intensity. The same ROI was used at all time points to record intensities over time. To measure the background signal intensity, at least three of the ROIs (1 -μm diameter) were randomly drawn in nuclei for each image and each time point, and their intensities were recorded separately. For normalization, the mean background intensity was subtracted from raw MCP::GFP intensities. Further analyses used the normalized signal intensities.
Most MCP::GFP dots did not move dramatically inside the nucleus (95% (57/60) move <1 μm). All MCP::GFP dots that moved less than 1.5 μm (150% of ROI) between two consecutive time points (5 minutes apart) were considered as an MCP::GFP signal from the same locus. Each ROI position was kept in the same coordinates within the nucleus when the tracked MCP::GFP dot disappeared during the pause between active transcriptional bursts until it reappeared. The duration of transcriptional bursting (ON-time, its intensity, OFF-time) and all other measurements (e.g. plots in Figure 3) were calculated and generated using customized MATLAB codes (see Data and Code Availability). The beginning and the ending of each transcriptional event (e.g. bursting) were defined similarly to other previously reported methods (Corrigan et al., 2016; Larson et al., 2013). Specifically, ON-time was measured only when raw MCP::GFP dot intensity was sustained at least 50% higher than the raw background. OFF-time was scored for time duration between two bursts. To quantitate the mean of burst signal intensities, the normalized MCP::GFP signal intensities (after background subtraction) during each transcriptional burst were summed over all time points during the burst, then each was divided by the length of ON-time of the corresponding burst. To quantitate the number (Figure 2H) or summed intensity (Figure S2A) of MCP::GFP dots per nucleus, each nucleus was scored for the number of MCP::GFP dots inside the nucleus as well as their summed signal intensity for each time point throughout the movie. Then the measured data (# dots or intensities) were averaged over time for each nucleus.
To compare transcriptional states at two different loci in the same nucleus over the span of the movies (Figure 3D), the probability of a transcriptional state of two paired chromosomal loci (both ON; one ON, one OFF; or both OFF) was estimated by the product of individual probabilities of transcriptional state at each locus (e.g., “probability of ON state at locus 1” X “probability of ON state at locus 2” to estimate the probability of ‘both ON’). The probability of ON state at one locus was estimated from the percentage of time when that locus was transcriptionally active (MCP::GFP signal is on) during the whole movie (time period of ‘ON state’ divided by the total length of the whole movie). In contrast, the probability of one locus being inactive (OFF state) is the ratio of the sum of all OFF-times divided by the length of the whole movie. To estimate the probability of ‘Both ON’ at paired two loci in the nucleus, two probabilities of the ON state calculated for each locus were multiplied. The probabilities of transcriptional state at two loci (Both ON; One ON, one OFF, or Both OFF) were then converted to percentages by multiplying by 100 (Figure 3D, ‘by chance’), and compared with the percentage of time measured from the MS2 movies (Figure 3D, ‘actual data’). The comparison between the probability (by chance) and measurement (actual data) allows us to test whether the transcriptional states of two loci in the same nucleus are dependent or not. In other words, this statistical test distinguishes whether the overlap of bursts observed in the actual data (both ON) is merely by chance. If the actual data for ‘both ON’ are higher than its probability ‘by chance’, transcriptional burst at one locus may promote the burst at the other locus. The opposite case suggests a mutually exclusive transcriptional activation at different loci in the same nucleus.
For figure preparation, all images were processed with linear contrast enhancement in ImageJ (version 1.52h) using a minimum contrast of 1.10X mean background signal intensity and a maximum contrast of 1.25X3 maximum signal intensity as used in a previous study (Lee et al., 2016, 2017). Customized MATLAB codes (see Data and Code Availability) were used for generating the plots used in the figures.
Immunostaining and DAPI Staining
Immunostaining followed established protocols (Crittenden et al., 2017). Briefly, dissected gonads were fixed with 3% paraformaldehyde for 30 minutes and permeabilized with ice-cold methanol for 10 minutes. Next, samples were incubated with anti-FLAG primary antibody overnight [1:1000, Sigma #F1804)], followed by a 1-hour incubation with secondary antibody [donkey Alexa 647 anti-mouse (1:500, Invitrogen #A31571)] at room temperature. DAPI was added at a final concentration of 0.5–1 ng/ml during the last 10 minutes of the secondary antibody incubation. Vectashield (Vector Laboratories #H-1000) was the mounting medium.
Compound Microscopy
A Zeiss Axioskop equipped with a 63× 1.4NA Plan Apochromat oil immersion objective and an ORCA cMOS camera was used. Carl Zeiss filter sets 49, and 43HE were used for the visualization of DAPI and Alexa 647 respectively. An X-Cite 120Q lamp (Lumen Dynamics) was the fluorescence light source.
α-Amanitin Treatment
α-amanitin treatment was performed as previously described (Lee et al., 2016, 2017). Briefly, staged young adults (24h post mid-L4 stage) were treated with a-amanitin dissolved in M9, at 100 mg/mL for 1.5 hrs at 20 C on a Shaker rotisserie (Thermo Scientific, 0.85 rad/s). Following treatment, worms were washed three times with M9. Images were taken before treatment, after 1.5-hr treatment and 1 hr after the washes.
QUANTIFICATION AND STATISTICAL ANALYSIS
Sample sizes are indicated in the figure legends. Error bars indicate the standard error of the mean (SEM) unless noted otherwise. To calculate the statistical significance between two groups, Student’s (for groups with equal variance) or Welch’s (for groups with unequal variance) two sample t-test was used after the normality test using quantile plots, unless noted otherwise. For comparing multiple groups, an ANOVA was used first and then the pairwise comparisons followed (only p-values were reported). p-values smaller than 0.01 were considered to be a significant difference. To test correlation between two variables, Pearson’s correlation coefficient (Pearson’s r) was calculated. 0 ≤ |r| ≤ 0.20 was considered as no or little correlation; 0.20 ≤ |r| < 0.40: weak (positive or negative) correlation; 0.40 ≤ |r| ≤0.60: modest correlation; 0.60 ≤ |r| ≤ 0.80: strong correlation; and 0.80≤ |r| ≤ 1: very strong correlation. See ‘Image processing and analysis’ for quantification of transcriptional dynamics in MS2 movies.
DATA AND CODE AVAILABILITY
All customized MATLAB codes and ImageJ macros used in this study are deposited and are available at: https://github.com/chlasic/MS2_analysis.
Several ImageJ macros use the plug-in ‘StackReg’ (https://imagej.net/StackReg), which must be installed in the ImageJ ‘plugins’ folder prior to using the customized macros. For automated MS2 movie alignments, two ImageJ macros were used sequentially: ‘MultiStackReg_BatchProcess1of2.ijm’ and ‘MultiStackReg_BatchProcess2of2.ijm’. The former code aligns gonadal images through the z-axis and the latter does so through the time points. In cases where no DIC channels were included in the z-stacks, ‘MultiStackReg_BatchProcess1of2_2Ch.ijm’ and ‘MultiStackReg_BatchProcess2of2_2Ch.ijm’ were used instead. For manual MS2 movie alignments, either one of following ImageJ macros can be used: ‘TranslateStack.ijm’ or ‘TranslateStackAllAfterPos.ijm’. The former code aligns the image only at the current time point, and the latter does for whole time points after the current time point. To analyze the MCP::GFP tracking data from MS2 movies, a custom MATLAB code ‘MS2track_analysis.m’ was used. This code includes multiple customized functions to analyze all features of transcriptional dynamics quantitated in this study (e.g. burst duration, intensity). This code requires other customized MATLAB functions ‘MS2normalize.m’ and ‘MS2sumInt.m’.
Supplementary Material
KEY RESOURCES TABLE
| REAGENT or RESOURCE | SOURCE | IDENTIFIER |
|---|---|---|
| Antibodies | ||
| Mouse α-FLAG | Sigma | F1804; RRID: AB_262044 |
| Donkey α-Mouse IgG (H+L), Alexa Fluor 647 | Invitrogen | A31571; RRID: AB_162542 |
| Chemicals, Peptides, and Recombinant Proteins | ||
| α-amanitin | Sigma | A2263–1MG |
| Serotonin | Sigma | H7752–5G |
| Critical Commercial Assays | ||
| Single-molecule RNA FISH (smFISH) | Biosearch Technologies | N/A |
| Deposited Data | ||
| Custom MATLAB codes | github.com/chlasic/MS2_analysis | N/A |
| Experimental Models: Organisms/Strains | ||
| Wild-type C. elegans | C. elegans Genetics Center (CGC) | N2 Bristol |
| ttTi5605 II; unc-119(ed3) III | Frøkjaer-Jensen et al. (2008) | EG6699 |
| unc-119(ed3) III; oxTi365 V | Frøkjasr-Jensen et al. (2014) | EG8082 |
| glp-1(q224ts) III | Kodoyianni et al. (1992) | JK4605 |
| sygl-1(q828) I; qSi49[Psygl-1::3×FLAG::sygl-1::sygl-1 3’end] II | Shin etal. (2017) | JK5499 |
| qSi369 [Psygl-1::24×MS2 loops::3×FLAG::sygl-1::sygl-1 3’end] II; unc-119(ed3) III; qsi370[Pmex-5::MS2 coat protein::linker::GFP::tbb-2 3’end::gpd-2 intergenic sequence::H2B::mCherry::unc-54 3’end] V | this work | JK5896 |
| qSi369[Psygl-1::24×MS2 loops::3×FLAG::sygl-1::sygl-1 3’end] II; glp-1(q224) III/hT2[qls48](I;III); qSi370[Pmex-5::MS2 coat protein::linker::GFP::tbb-2 3’end::gpd-2 intergenic sequence::H2B::mCherry::unc-54 3’end] V | this work | JK5943 |
| sygl-1(q828) I; qSi369[Psygl-1::24×MS2 loops::3×FLAG::sygl-1::sygl-1 3’end] II; qSi370[Pmex-5::MS2 coat protein::linker::GFP::tbb-2 3’end::gpd-2 intergenic sequence::H2B::mCherry::unc-54 3’end] V | this work | JK5932 |
| Recombinant DNA | ||
| Psygl-1::24×MS2 loops::3×FLAG::sygl-1::sygl-1 3’end, cloned into pCFJ151 | this work | pJK2014 |
| Pmex-5::MS2 coat protein::linker::GFP::tbb-2 3’end::gpd-2 intergenic sequence::H2B::mCherry::unc-54 3’end, cloned into pCFJ151 | this work | pJK2020 |
| Software and Algorithms | ||
| MATLAB | Mathworks | R2018b |
| FIJI | ImageJ | 1.52h |
| LAS image acquisition software | Leica Biosystems | 3.3.1 or X |
| Micromanager | www.micro-manager.org | 1.4 |
| Custom MATLAB codes | this work github.com/chlasic/MS2_analysis | N/A |
| Image J Plugin, StackReg | imagej.net/StackReg | N/A |
| Other | ||
| CherryTemp | Cherry Biotech, Rennes, France | N/A |
| Polystyrene microbeads, 0.1 μm diameter | Polysciences | 00876 |
Highlights.
Notch-dependent transcription assayed in its native context is “bursty”
Notch-dependent transcriptional bursts are graded across the stem cell pool
Burst duration is the key determinant of Notch-dependent transcriptional probability
Notch NICD strength affects both burst duration and intensity
ACKNOWLEDGMENTS
We thank Tina Lynch and Sarah Crittenden for critical comments on the manuscript. We also thank Anne Helsley-Marchbanks for help preparing the manuscript and Laura Vanderploeg for help with the figures. The codon-optimized superfolder GFP was a gift from Andy Golden and Harold Smith. This work was supported in part by the American Heart Association (18POST34030263) to C.L. J.K. is an Investigator of the Howard Hughes Medical Institute.
Footnotes
SUPPLEMENTAL INFORMATION
Supplemental Information can be found online at https://doi.org/10.1016/j.devcel.2019.07.001.
DECLARATION OF INTERESTS
The authors declare no competing interests.
REFERENCES
- Artavanis-Tsakonas S, Rand MD, and Lake RJ (1999). Notch signaling: cell fate control and signal integration in development. Science 284, 770–776. [DOI] [PubMed] [Google Scholar]
- Austin J, and Kimble J (1987). GLP-1 is required in the germ line for regulation of the decision between mitosis and meiosis in C. elegans. Cell 51, 589–599. [DOI] [PubMed] [Google Scholar]
- Bertrand E, Chartrand P, Schaefer M, Shenoy SM, Singer RH, and Long RM (1998). Localization of ASH1 mRNA particles in living yeast. Mol. Cell 2, 437–445. [DOI] [PubMed] [Google Scholar]
- Bothma JP, Garcia HG, Esposito E, Schlissel G, Gregor T, and Levine M (2014). Dynamic regulation of eve stripe 2 expression reveals transcriptional bursts in living Drosophila embryos. Proc. Natl. Acad. Sci. USA 111, 10598–10603. [DOI] [PMC free article] [PubMed] [Google Scholar]
- Bray S, and Furriols M (2001). Notch pathway: making sense of Suppressor of Hairless. Curr. Biol 11, R217–R221. [DOI] [PubMed] [Google Scholar]
- Bray SJ (2016). Notch signalling in context. Nat. Rev. Mol. Cell Biol 17, 722–735. [DOI] [PubMed] [Google Scholar]
- Brenner S (1974). The genetics of Caenorhabditis elegans. Genetics 77, 71–94. [DOI] [PMC free article] [PubMed] [Google Scholar]
- Chubb JR, Trcek T, Shenoy SM, and Singer RH (2006). Transcriptional pulsing of a developmental gene. Curr. Biol 16, 1018–1025. [DOI] [PMC free article] [PubMed] [Google Scholar]
- Cinquin O, Crittenden SL, Morgan DE, and Kimble J (2010). Progression from a stem cell-like state to early differentiation in the C. elegans germ line. Proc. Natl. Acad. Sci. USA 107, 2048–2053. [DOI] [PMC free article] [PubMed] [Google Scholar]
- Corrigan AM, and Chubb JR (2014). Regulation of transcriptional bursting by a naturally oscillating signal. Curr. Biol 24, 205–211. [DOI] [PMC free article] [PubMed] [Google Scholar]
- Corrigan AM, Tunnacliffe E, Cannon D, and Chubb JR (2016). A continuum model of transcriptional bursting. Elife 5. [DOI] [PMC free article] [PubMed] [Google Scholar]
- Crittenden SL, Lee C, Mohanty I, Battula S, Knobel K, and Kimble J (2019). Sexual dimorphism of niche architecture and regulation of the C. elegans germline stem cell pool. Mol. Biol. Cell 30, 1757–1769. [DOI] [PMC free article] [PubMed] [Google Scholar]
- Crittenden SL, Leonhard KA, Byrd DT, and Kimble J (2006). Cellular analyses of the mitotic region in the Caenorhabditis elegans adult germ line. Mol. Biol. Cell 17, 3051–3061. [DOI] [PMC free article] [PubMed] [Google Scholar]
- Crittenden SL, Seidel HS, and Kimble J (2017). Analysis of the C. elegans germline stem cell pool. Methods Mol. Biol 1463, 1–33. [DOI] [PubMed] [Google Scholar]
- Crittenden SL, Troemel ER, Evans TC, and Kimble J (1994). GLP-1 is localized to the mitotic region of the C. elegans germ line. Development 120, 2901–2911. [DOI] [PubMed] [Google Scholar]
- De Robertis EM, Larraín J, Oelgeschlager M, and Wessely O (2000). The establishment of Spemann’s organizer and patterning of the vertebrate embryo. Nat. Rev. Genet 1, 171–181. [DOI] [PMC free article] [PubMed] [Google Scholar]
- Duncan AW, Rattis FM, DiMascio LN, Congdon KL, Pazianos G, Zhao C, Yoon K, Cook JM, Willert K, Gaiano N, et al. (2005). Integration of Notch and Wnt signaling in hematopoietic stem cell maintenance. Nat. Immunol 6, 314–322. [DOI] [PubMed] [Google Scholar]
- Falo-Sanjuan J, Lammers NC, Garcia HG, and Bray SJ (2019). Enhancer priming enables fast and sustained transcriptional responses to Notch signaling. Dev. Cell 50, 411–425. [DOI] [PMC free article] [PubMed] [Google Scholar]
- Fox PM, and Schedl T (2015). Analysis of germline stem cell differentiation following loss of GLP-1 Notch activity in Caenorhabditis elegans. Genetics 201, 167–184. [DOI] [PMC free article] [PubMed] [Google Scholar]
- Fritzsch C, Baumgartner S, Kuban M, Steinshorn D, Reid G, and Legewie S (2018). Estrogen-dependent control and cell-to-cell variability of transcriptional bursting. Mol. Syst. Biol 14, e7678. [DOI] [PMC free article] [PubMed] [Google Scholar]
- Frøkjaer-Jensen C, Davis MW, Hopkins CE, Newman BJ, Thummel JM, Olesen SP, Grunnet M, and Jorgensen EM (2008). Single-copy insertion of transgenes in Caenorhabditis elegans. Nat. Genet 40, 1375–1383. [DOI] [PMC free article] [PubMed] [Google Scholar]
- Frøkjær-Jensen C, Davis MW, Sarov M, Taylor J, Flibotte S, LaBella M, Pozniakovsky A, Moerman DG, and Jorgensen EM (2014). Random and targeted transgene insertion in Caenorhabditis elegans using a modified Mos1 transposon. Nat. Methods 11, 529–534. [DOI] [PMC free article] [PubMed] [Google Scholar]
- Fukaya T, Lim B, and Levine M (2016). Enhancer control of transcriptional bursting. Cell 166, 358–368. [DOI] [PMC free article] [PubMed] [Google Scholar]
- Fusco D, Accornero N, Lavoie B, Shenoy SM, Blanchard JM, Singer RH, and Bertrand E (2003). Single mRNA molecules demonstrate probabilistic movement in living mammalian cells. Curr. Biol 13, 161–167. [DOI] [PMC free article] [PubMed] [Google Scholar]
- Gaiano N, and Fishell G (2002). The role of Notch in promoting glial and neural stem cell fates. Annu. Rev. Neurosci 25, 471–490. [DOI] [PubMed] [Google Scholar]
- Gerhold AR, Ryan J, Vallée-Trudeau JN, Dorn JF, Labbé JC, and Maddox PS (2015). Investigating the regulation of stem and progenitor cell mitotic progression by in situ imaging. Curr. Biol 25, 1123–1134. [DOI] [PubMed] [Google Scholar]
- Gibson DG, Young L, Chuang RY, Venter JC, Hutchison CA 3rd, and Smith HO (2009). Enzymatic assembly of DNA molecules up to several hundred kilobases. Nat. Methods 6, 343–345. [DOI] [PubMed] [Google Scholar]
- Golding I, Paulsson J, Zawilski SM, and Cox EC (2005). Real-time kinetics of gene activity in individual bacteria. Cell 123, 1025–1036. [DOI] [PubMed] [Google Scholar]
- Henderson ST, Gao D, Lambie EJ, and Kimble J (1994). lag-2 may encode a signaling ligand for the GLP-1 and LIN-12 receptors of C. elegans. Development 120, 2913–2924. [DOI] [PubMed] [Google Scholar]
- Hnisz D, Shrinivas K, Young RA, Chakraborty AK, and Sharp PA (2017). A phase separation model for transcriptional control. Cell 169, 13–23. [DOI] [PMC free article] [PubMed] [Google Scholar]
- Hoyle NP, and Ish-Horowicz D (2013). Transcript processing and export kinetics are rate-limiting steps in expressing vertebrate segmentation clock genes. Proc. Natl. Acad. Sci. USA 110, E4316–E4324. [DOI] [PMC free article] [PubMed] [Google Scholar]
- Huang T, Kuersten S, Deshpande AM, Spieth J, MacMorris M, and Blumenthal T (2001). Intercistronic region required for polycistronic premRNA processing in Caenorhabditis elegans. Mol. Cell. Biol 21, 1111–1120. [DOI] [PMC free article] [PubMed] [Google Scholar]
- Ilagan MX, Lim S, Fulbright M, Piwnica-Worms D, and Kopan R (2011). Real-time imaging of Notch activation with a luciferase complementation-based reporter. Sci. Signal 4, rs7. [DOI] [PMC free article] [PubMed] [Google Scholar]
- Imayoshi I, Shimojo H, Sakamoto M, Ohtsuka T, and Kageyama R (2013). Genetic visualization of notch signaling in mammalian neurogenesis. Cell. Mol. Life Sci 70, 2045–2057. [DOI] [PMC free article] [PubMed] [Google Scholar]
- Jacob F, and Monod J (1961). Genetic regulatory mechanisms in the synthesis of proteins. J. Mol. Biol 3, 318–356. [DOI] [PubMed] [Google Scholar]
- Jenkins RP, Hanisch A, Soza-Ried C, Sahai E, and Lewis J (2015). Stochastic regulation of her1/7 gene expression is the source of noise in the zebrafish somite clock counteracted by Notch signalling. PLoS Comput. Biol 11, e1004459. [DOI] [PMC free article] [PubMed] [Google Scholar]
- Kafri P, Hasenson SE, Kanter I, Sheinberger J, Kinor N, Yunger S, and Shav-Tal Y (2016). Quantifying b-catenin subcellular dynamics and cyclin D1 mRNA transcription during Wnt signaling in single living cells. Elife 5. [DOI] [PMC free article] [PubMed] [Google Scholar]
- Kersey RK, Brodigan TM, Fukushige T, and Krause MW (2016). Regulation of UNC-130/FOXD-mediated mesodermal patterning in C. elegans. Dev. Biol 416, 300–311. [DOI] [PMC free article] [PubMed] [Google Scholar]
- Kershner AM, Shin H, Hansen TJ, and Kimble J (2014). Discovery of two GLP-1/Notch target genes that account for the role of GLP-1/Notch signaling in stem cell maintenance. Proc. Natl. Acad. Sci. USA 111, 3739–3744. [DOI] [PMC free article] [PubMed] [Google Scholar]
- Kim E, Sun L, Gabel CV, and Fang-Yen C (2013). Long-term imaging of Caenorhabditis elegans using nanoparticle-mediated immobilization. PLoS One 8, e53419. [DOI] [PMC free article] [PubMed] [Google Scholar]
- Kodoyianni V, Maine EM, and Kimble J (1992). Molecular basis of loss-of-function mutations in the GLP-1 gene of Caenorhabditis elegans. Mol. Biol. Cell 3, 1199–1213. [DOI] [PMC free article] [PubMed] [Google Scholar]
- Kopan R, and Ilagan MX (2009). The canonical Notch signaling pathway: unfolding the activation mechanism. Cell 137, 216–233. [DOI] [PMC free article] [PubMed] [Google Scholar]
- Kovall RA, Gebelein B, Sprinzak D, and Kopan R (2017). The canonical Notch signaling pathway: structural and biochemical insights into shape, sugar, and force. Dev. Cell 41, 228–241. [DOI] [PMC free article] [PubMed] [Google Scholar]
- Larson DR, Fritzsch C, Sun L, Meng X, Lawrence DS, and Singer RH (2013). Direct observation of frequency modulated transcription in single cells using light activation. Elife 2, e00750. [DOI] [PMC free article] [PubMed] [Google Scholar]
- Larson DR, Singer RH, and Zenklusen D (2009). A single molecule view of gene expression. Trends Cell Biol 19, 630–637. [DOI] [PMC free article] [PubMed] [Google Scholar]
- Lee C, Seidel HS, Lynch TR, Sorensen EB, Crittenden SL, and Kimble J (2017). Single-molecule RNA fluorescence in situ hybridization (smFISH) in Caenorhabditis elegans. Bio-protocol 7, e2357. [DOI] [PMC free article] [PubMed] [Google Scholar]
- Lee C, Sorensen EB, Lynch TR, and Kimble J (2016). C. elegans GLP-1/Notch activates transcription in a probability gradient across the germline stem cell pool. Elife 5, e18370. [DOI] [PMC free article] [PubMed] [Google Scholar]
- Lenhard B, Sandelin A, and Carninci P (2012). Metazoan promoters: emerging characteristics and insights into transcriptional regulation. Nat. Rev. Genet 13, 233–245. [DOI] [PubMed] [Google Scholar]
- Lindell TJ, Weinberg F, Morris PW, Roeder RG, and Rutter WJ (1970). Specific inhibition of nuclear RNA polymerase II by a-amanitin. Science 170, 447–449. [DOI] [PubMed] [Google Scholar]
- Liu Z, and Tjian R (2018). Visualizing transcription factor dynamics in living cells. J. Cell Biol 217, 1181–1191. [DOI] [PMC free article] [PubMed] [Google Scholar]
- Lucas T, Ferraro T, Roelens B, De Las Heras Chanes J, Walczak AM, Coppey M, and Dostatni N (2013). Live imaging of bicoid-dependent transcription in Drosophila embryos. Curr. Biol 23, 2135–2139. [DOI] [PubMed] [Google Scholar]
- McGinnis W, and Krumlauf R (1992). Homeobox genes and axial patterning. Cell 68, 283–302. [DOI] [PubMed] [Google Scholar]
- Merritt C, Rasoloson D, Ko D, and Seydoux G (2008). 3’ UTRs are the primary regulators of gene expression in the C. elegans germline. Curr. Biol 18, 1476–1482. [DOI] [PMC free article] [PubMed] [Google Scholar]
- Molina N, Suter DM, Cannavo R, Zoller B, Gotic I, and Naef F (2013). Stimulus-induced modulation of transcriptional bursting in a single mammalian gene. Proc. Natl. Acad. Sci. USA 110, 20563–20568. [DOI] [PMC free article] [PubMed] [Google Scholar]
- Muschiol D, Schroeder F, and Traunspurger W (2009). Life cycle and population growth rate of Caenorhabditis elegans studied by a new method. BMC Ecol 9, 14. [DOI] [PMC free article] [PubMed] [Google Scholar]
- Nadarajan S, Govindan JA, McGovern M, Hubbard EJA, and Greenstein D (2009). MSP and GLP-1/Notch signaling coordinately regulate actomyosin-dependent cytoplasmic streaming and oocyte growth inC. elegans. Development 136, 2223–2234. [DOI] [PMC free article] [PubMed] [Google Scholar]
- Nandagopal N, Santat LA, LeBon L, Sprinzak D, Bronner ME, and Elowitz MB (2018). Dynamic ligand discrimination in the Notch signaling pathway. Cell 172, 869–880. [DOI] [PMC free article] [PubMed] [Google Scholar]
- Nehammer C, Podolska A, Mackowiak SD, Kagias K, and Pocock R (2015). Specific microRNAs regulate heat stress responses in Caenorhabditis elegans. Sci. Rep 5, 8866. [DOI] [PMC free article] [PubMed] [Google Scholar]
- Nicolas D, Phillips NE, and Naef F (2017). What shapes eukaryotic transcriptional bursting? Mol. Biosyst 13, 1280–1290. [DOI] [PubMed] [Google Scholar]
- Patel T, Tursun B, Rahe DP, and Hobert O (2012). Removal of Polycomb repressive complex 2 makes C. elegans germ cells susceptible to direct conversion into specific somatic cell types. Cell Rep 2, 1178–1186. [DOI] [PMC free article] [PubMed] [Google Scholar]
- Petcherski AG, and Kimble J (2000). LAG-3 is a putative transcriptional activator in the C. elegans Notch pathway. Nature 405, 364–368. [DOI] [PubMed] [Google Scholar]
- Raj A, Peskin CS, Tranchina D, Vargas DY, and Tyagi S (2006). Stochastic mRNA synthesis in mammalian cells. PLoS Biol 4, e309. [DOI] [PMC free article] [PubMed] [Google Scholar]
- Rodriguez J, Ren G, Day CR, Zhao K, Chow CC, and Larson DR (2019). Intrinsic dynamics of a human gene reveal the basis of expression heterogeneity. Cell 176, 213–226.e18. [DOI] [PMC free article] [PubMed] [Google Scholar]
- Rog O, and Dernburg AF (2015). Direct visualization reveals kinetics of meiotic chromosome synapsis. Cell Rep 10, 1639–1645. [DOI] [PMC free article] [PubMed] [Google Scholar]
- Rosu S, and Cohen-Fix O (2017). Live-imaging analysis of germ cell proliferation in the C. elegans adult supports a stochastic model for stem cell proliferation. Dev. Biol 423, 93–100. [DOI] [PMC free article] [PubMed] [Google Scholar]
- Senecal A, Munsky B, Proux F, Ly N, Braye FE, Zimmer C, Mueller F, and Darzacq X (2014). Transcription factors modulate c-Fos transcriptional bursts. Cell Rep 8, 75–83. [DOI] [PMC free article] [PubMed] [Google Scholar]
- Shimojo H, Ohtsuka T, and Kageyama R (2008). Oscillations in Notch signaling regulate maintenance of neural progenitors. Neuron 58, 52–64. [DOI] [PubMed] [Google Scholar]
- Shin H, Haupt KA, Kershner AM, Kroll-Conner P, Wickens M, and Kimble J (2017). SYGL-1 and LST-1 link niche signaling to PUF RNA repression for stem cell maintenance in Caenorhabditis elegans. PLoS Genet 13, e1007121. [DOI] [PMC free article] [PubMed] [Google Scholar]
- Siegfried KR, and Kimble J (2002). POP-1 controls axis formation during early gonadogenesis in C. elegans. Development 129, 443–453. [DOI] [PubMed] [Google Scholar]
- Song BM, and Avery L (2012). Serotonin activates overall feeding by activating two separate neural pathways in Caenorhabditis elegans. J. Neurosci 32, 1920–1931. [DOI] [PMC free article] [PubMed] [Google Scholar]
- Tax FE, Yeargers JJ, and Thomas JH (1994). Sequence of C. elegans lag-2 reveals a cell-signalling domain shared with Delta and Serrate of Drosophila. Nature 368, 150–154. [DOI] [PubMed] [Google Scholar]
- Teshiba E, Miyahara K, and Takeya H (2016). Glucose-induced abnormal egg-laying rate in Caenorhabditis elegans. Biosci. Biotechnol. Biochem 80, 1436–1439. [DOI] [PubMed] [Google Scholar]
- Thévenaz P, Ruttimann UE, and Unser M (1998). A pyramid approach to subpixel registration based on intensity. IEEE Trans. Image Process 7, 27–41. [DOI] [PubMed] [Google Scholar]
- van Es JH, van Gijn ME, Riccio O, van den Born M, Vooijs M, Begthel H, Cozijnsen M, Robine S, Winton DJ, Radtke F, et al. (2005). Notch/g-secretase inhibition turns proliferative cells in intestinal crypts and adenomas into goblet cells. Nature 435, 959–963. [DOI] [PubMed] [Google Scholar]
Associated Data
This section collects any data citations, data availability statements, or supplementary materials included in this article.
Supplementary Materials
Data Availability Statement
All customized MATLAB codes and ImageJ macros used in this study are deposited and are available at: https://github.com/chlasic/MS2_analysis.
Several ImageJ macros use the plug-in ‘StackReg’ (https://imagej.net/StackReg), which must be installed in the ImageJ ‘plugins’ folder prior to using the customized macros. For automated MS2 movie alignments, two ImageJ macros were used sequentially: ‘MultiStackReg_BatchProcess1of2.ijm’ and ‘MultiStackReg_BatchProcess2of2.ijm’. The former code aligns gonadal images through the z-axis and the latter does so through the time points. In cases where no DIC channels were included in the z-stacks, ‘MultiStackReg_BatchProcess1of2_2Ch.ijm’ and ‘MultiStackReg_BatchProcess2of2_2Ch.ijm’ were used instead. For manual MS2 movie alignments, either one of following ImageJ macros can be used: ‘TranslateStack.ijm’ or ‘TranslateStackAllAfterPos.ijm’. The former code aligns the image only at the current time point, and the latter does for whole time points after the current time point. To analyze the MCP::GFP tracking data from MS2 movies, a custom MATLAB code ‘MS2track_analysis.m’ was used. This code includes multiple customized functions to analyze all features of transcriptional dynamics quantitated in this study (e.g. burst duration, intensity). This code requires other customized MATLAB functions ‘MS2normalize.m’ and ‘MS2sumInt.m’.