

Abstract
We studied the flow of corticothalamic (CT) information from the motor cortex of the cat during two types of locomotion: visually guided (cortex dependent) and unguided. Spike trains of CT neurons in layers V (CT5s) and VI (CT6s) were examined. All CT5s had fast-conducting axons (<2 ms conduction time), and nearly all showed step-phase-related activity (94%), sensory receptive fields (100%), and spontaneous activity (100%). In contrast, conduction times along CT6 axons were much slower, with bimodal peaks occurring at 6 and 32 ms. Remarkably, almost none of the slowest conducting CT6s showed step-related activity, sensory receptive fields, or spontaneous activity. As a group, these enigmatic neurons were all but silent. Some of the CT6s with moderately conducting axons showed step-related behavior (35%), and this response was more precisely timed than that of the CT5s. We propose distinct functional roles for these diverse corticothalamic populations.
Keywords: motor cortex, pyramidal tract neurons, corticothalamic neurons, conduction velocity, activity, cat
Introduction
The functional roles of the massive descending corticothalamic (CT) projections from layers V and VI to associated thalamic nuclei are essentially unknown. These fibers, originating in both sensory and motor cortices, contribute far more synapses to thalamic nuclei than do peripheral inputs (Wilson et al., 1984; Liu et al., 1995; Liu and Jones, 1999; van Horn et al., 2000). Although CT pathways are glutamatergic and excitatory (Scharfman et al., 1990; Golshani et al., 1998; Turner and Salt, 1998; Li et al., 2003), their activation evokes inhibitory, excitatory, and mixed effects in the thalamus (Descheenes and Hu, 1990; McCormick and von Krosigk, 1992; Turner and Salt, 1998; von Krosigk et al., 1999). Inhibitory effects are considered to result from the activation of inhibitory neurons in the reticular nucleus of the thalamus and interneurons in the relay nuclei.
CT projections of layers V and VI differ in their patterns of synaptic input to their targets (Kakei et al., 2001; Sherman and Guillery, 2001) and in the postsynaptic potentials that they evoke (Salt, 2002; Li et al., 2003; Reichova and Sherman, 2004; Zhang and Jones, 2004). Moreover, descending projections of layer VI lie exclusively within the thalamus, but axons of the layer V projection branch considerably to terminate in a host of subcortical targets (Canedo, 1997). Thus, it is reasonable to expect that these distinct CT projections play different roles in regulating the activity of the thalamus. Because CT regulation is dynamic and behavioral state dependent (Steriade, 2001), it is important to investigate these systems in awake, behaving subjects. A critical question concerns the manner in which CT projections of layers V and VI participate in information processing during natural behaviors.
We previously addressed this question in the motor cortex of awake rabbits, in which we showed that CT neurons of layers V and VI have different axonal properties and respond differently during posture maintenance, locomotion, and sensory stimulation (Swadlow, 1994; Beloozerova et al., 2003a,c). Here we extend these findings to the feline motor cortex. We examine the activity of layer V CT neurons (CT5s) and two classes of layer VI CT neurons (CT6s) during two types of natural locomotion, one that requires cortical control and one that does not (Trendelenberg, 1911; Liddell and Phillips, 1944; Beloozerova and Sirota, 1993).
Parts of this work have been published previously in abstract form (Beloozerova et al., 2003b).
Materials and Methods
Recordings were obtained from the forelimb representation of the motor cortex of four awake adult cats (two males and two females). Some of the methods have been described previously (Beloozerova and Sirota, 1993; Beloozerova et al., 2003a) and will be reported briefly here. All experiments were conducted in accordance with National Institutes of Health guidelines and were approved by the Barrow Neurological Institute Animal Care and Use Committee.
Locomotion tasks
Positive reinforcement (food) was used to adapt the cats to the experimental situation and to engage them in locomotion behavior (Skinner, 1938; Pryor, 1975). A rectangular enclosure (2.5 × 0.5 m) served as an experimental chamber. A longitudinal wall divided the box into two corridors through which the cats passed sequentially and repeatedly in either direction. The floor was flat in one corridor; the other contained a horizontal ladder (Fig. 1 A). In this paper, walking on the flat surface will be referred to as simple locomotion and on the crosspieces of the ladder as complex locomotion. The crosspieces of the ladder were flat and 5 cm wide, which slightly exceeds the foot support area of the cat. The crosspieces were spaced 25 cm apart, approximately half of the mean step length observed during simple locomotion in such an enclosure (50 ± 5 cm) (Beloozerova and Sirota, 1993). The cat's passage through the beginning or the end of each corridor was monitored using infrared photodiodes.
Figure 1.
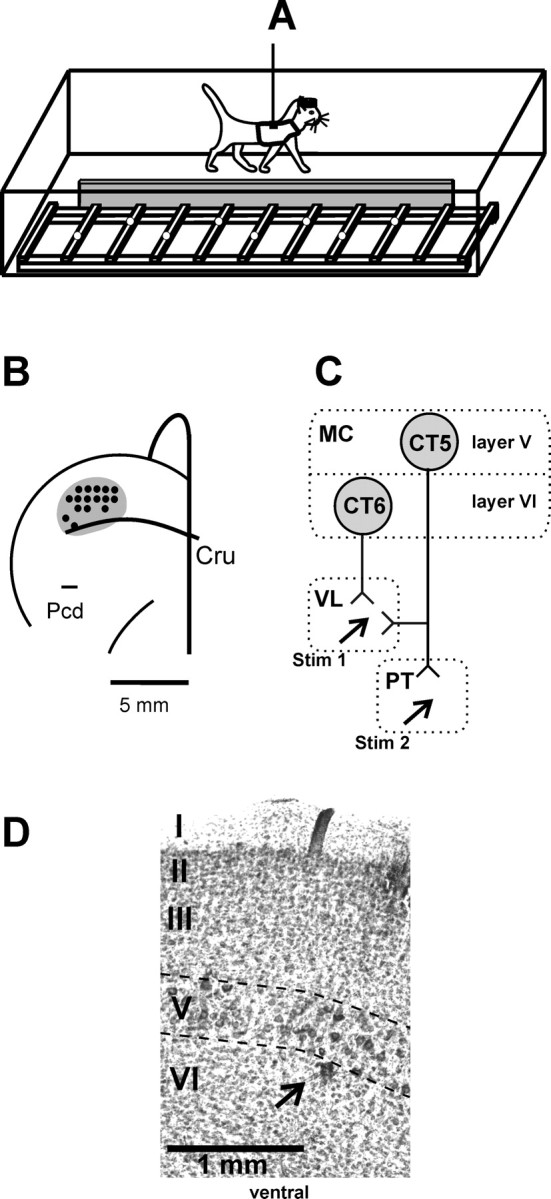
Experimental design. A, The experimental box was divided into two corridors, each 2.5 m long and 0.5 m wide. The corridors were partially separated by a barrier (gray), and one corridor contained a horizontal ladder. Cats were trained to pass sequentially and repeatedly through the corridors. Open circles on the crosspieces of the ladder schematically show placements of cat forelimbs. B, A scheme of the recording area within the forelimb representation of the left motor cortex. The microelectrode entry points into the cortex (cortical plate openings through which penetrations have been made) were combined from all cats and are shown by black circles. Cru, Cruciate sulcus; Pcd, post cruciate dimple). C, Types of neurons recorded: CT6, corticofugal neurons of layer VI projecting to VL; CT5, corticofugal neurons of layer V that project to VL or to VL and the PT. The neurons were identified by their antidromic responses to electrical stimulation of the corresponding structures (Stim 1, Stim 2). MC, Motor cortex. D, Photomicrograph of a section through the motor cortex, stained with cresyl violet. Layers of the cortex are numbered, and layer V is outlined by dashed lines. Note the clusters of giant cells that are characteristic of layer V. An arrow points to the microlesion made in the upper layer VI in the awake animal using the criteria outlined in Materials and Methods.
General surgical procedures
After the cats were trained, surgery was performed under isoflourane anesthesia using aseptic procedures. The skin and fascia were retracted from much of the dorsal surface of the skull. At 10 points around the circumference of the head, stainless steel screws were inserted into the skull and connected with wire; the screw heads and wire were then inserted into a plastic cast to form a circular base. Later this base rigidly held the head of the awake cat during the search for neurons. The base was also used for the fixation of connectors, a miniature microdrive, and a protective and electrically shielding cap. The parts of the os frontale and os ethmoidale above the motor cortex were removed. A total of 0.6 cm2 of dura was removed from above the rostral, a portion of the lateral sigmoid gyri, and the rostral part of the posterior sigmoid gyrus. The region of the motor cortex to be studied was visually identified by surface features and photographed. The aperture was then covered by a 1-mm-thick acrylic plate in which ∼100 holes 0.3 mm in diameter had been drilled and prefilled with sterile wax. The plate was fixed to the surrounding bone by orthodontic resin (Densply Caulk). An arrangement of seven 28 gauge hypodermic guide tubes was implanted above the ventrolateral thalamus (VL) with the tips at the Horsley and Clarke coordinates (anterior, 9.5 mm; lateral, 4.5 mm; vertical, +7.0 mm). Two 26 gauge hypodermic guide tubes were implanted vertically above the medullary pyramid with the tips at the Horsley and Clarke coordinates (posterior, 10 mm; lateral, 0.5 mm) and (posterior, 9.3 mm; lateral, 1.2 mm), at the depth of 0 mm vertical. Stimulating electrodes were implanted into the both the VL and the medullary pyramid later, mapping the areas while the cats were awake.
Single-unit recording
Several days after the surgery, a cat was placed on a table equipped with a comforting pad and encouraged to take a “sphinx” position. After the cat rested in this posture for several minutes, the base attached to the skull during surgery was fastened to an external frame so that the resting position of the head was approximated. This procedure minimized stress on the neck while the head was immobilized. After a few training sessions, all cats sat quietly with their head restrained. They did not seem to be disturbed by the restraint because they frequently fell asleep.
Extracellular recordings were obtained using platinum-tungsten quartz-insulated microelectrodes (40 μm outer diameter) pulled to a fine tip and mechanically sharpened using a diamond grinding wheel (Reitboeck, 1983). The electrode was advanced into cortical tissue through holes in the acrylic plate implanted above the motor cortex. A miniature manual single-axis micromanipulator, rigidly fixed to the base, was used to lower the electrode. The cortical area, from which the neurons were sampled (microelectrode entry points), is shown in Figure 1 B. After amplification and filtering (0.3-10 kHz bandpass; Power1401/Spike2 system; Cambridge Electronics Design, Cambridge, UK), unitary activity was led to an audio monitor, displayed on the screen, and archived to a hard disk of a computer.
After the electrode reached the depth in the cortex where clear responses of many neurons to limb movements could be observed (presumably layer V), two platinum-iridium stimulating electrodes (200 μm outer diameter, insulated with Teflon to within 0.4 mm of the tip) were slowly lowered into the medullar pyramid through the guide tubes implanted during surgery. Pulses of graded intensity (in the range of 0.1-0.5 mA, 0.2 ms duration) were delivered through this bipolar electrode. These stimulating electrodes were fixed at the positions that were most effective in eliciting antidromic responses in neurons of the motor cortex, and they served as the pyramidal tract (PT)-stimulating electrodes for the remainder of the experiments with the subject. The criterion for identification of antidromic responses was the test for collision of spikes (see below).
The VL was carefully explored with a microelectrode using the seven 28 hypodermic guide tubes implanted above the VL. Neuronal responses to tactile stimulation, passive movements in limb joints, and palpation of muscles were tested. Neuronal activity was also tested during active reaching and withdrawal movements, as well as during simple and complex locomotion. Two platinum-iridium stimulating electrodes (140 μm outer diameter, insulated with Teflon to within 0.4 mm of the tip) were implanted 0.7 mm apart (two tubes apart) in the locations that yielded the best motor responses.
Identification of neurons
All neurons encountered in the middle and deep layers of the cortex were tested for antidromic activation from the VL and pyramidal tract using 0.2 ms rectangular pulses of graded intensity in the range of 0.1-0.5 mA. These currents typically did not evoke any visible motor responses and never produced any signs of discomfort or distress in the cats. The principal criterion for the identification of antidromic activation was the test for collision of spikes (Bishop et al., 1962; Fuller and Schlag, 1976). Silent neurons that could not be tested for collision were considered to be antidromically activated if their latency variability to a test stimulus after a suprathreshold conditioning stimulus was strongly related to interstimulus intervals in the range of 1-100 ms and did not exceed 15% at any interval (Swadlow et al., 1978; Swadlow, 1998). For these neurons, we also required the refractory period to be <3.5 ms. To aid in the identification of single neurons, waveform analysis was used to discriminate between neurons and to identify the spikes of the neuron using the Power1401/Spike2 system waveform-matching algorithm.
Identification of corticofugal neurons of layer V (CT5s). Cortical layer V was identified by the presence of neurons that responded antidromically to stimulation of the medullary PT. Theoretical calculations suggest that currents in the range of 0.1-0.5 mA activate a sphere of tissue with a diameter of <1 mm (Hentall et al., 1984); nevertheless, we cannot exclude that some of the axons in the reticular formation surrounding the PT were also activated. Both the PT and lower brainstem reticular formation projecting neurons are known to populate only layer V of the motor cortex (Jones and Wise, 1977; Groos et al., 1978; Toyoshima and Sakai, 1982; Keizer and Kuypers, 1984, 1989; Rapisarda et al., 1985; Ghosh et al., 1988; Nudo and Masterton, 1990; Desbois et al., 1999). All neurons that responded antidromically to stimulation applied to electrodes in the PT will be referred to as pyramidal tract neurons (PTNs). Some PTNs also responded antidromically to stimulation of the VL. To ensure that the same neuron indeed responded to stimulation of both sites, tests of collision of spikes elicited from the two sites were conducted. All neurons that responded with equal or longer latency to stimulation of VL than PT were considered to contribute a (thin) axonal branch to VL and were classified as CT neurons of layer V. Neurons that responded with a shorter latency to stimulation of VL than PT were tested to determine whether the axon had been stimulated in passage or whether it indeed branched to VL. This test from Shinoda et al. (1976) determines the time needed for a spike to propagate along different branches of an axon and thus that the axon does branch (Swadlow and Weyand, 1981). The conduction time between the site of stimulation in VL and the branching point was calculated as XVL= (IPT-VL + LVL - LPT - RVL)/2, where IPT-VL is the maximal conditioning test interval when the spikes evoked from VL are blocked by the spikes from PT, LVL is the latency of the spikes evoked from VL, LPT is the latency of those evoked from PT, and RVL is the refractory period for the axon in VL. Only the neurons whose spikes propagated along the VL branch for 0.2 ms or longer were considered to contribute a branch to VL and classified as thalamus-projecting CT5s. In addition, neurons located at depths between identified PTNs that antidromically responded to stimulation of VL while failing to respond to PT were also classified as CT neurons of layer V and included in the database. The currents in the range of 0.1-0.5 mA used in this study did not evoke any visible or detectable by palpation muscle contraction. Thus, they were not exciting axons in the internal capsule (which is 2 mm or more away from the site of stimulation). In this study, CT5 neurons represent a heterogeneous population of corticofugal neurons. In addition to activating axons that terminate exclusively within the thalamus, our stimulating electrode could be activating collaterals of axons that terminate in the thalamus but project the main axon to various other subcortical sites, as well as axons in passage through the thalamus. For the purpose of conduction velocity calculation, the conduction distance between the stimulation site in the pyramidal tract and the recording site in layer V of the precruciate cortex was estimated at 51.5 mm. This figure includes the curvature of the internal capsule and accounts for the spread of current and the refractory period at the site of stimulation. Similarly, we estimated the conduction distance from the motor cortex to the VL at 31.5 mm.
Identification of corticofugal neurons of layer VI (CT6s). Layer VI was suspected to begin at the depth where the robust activity of layer V significantly diminished. The most superficial VL-projecting neuron in each penetration found at least 100 μm below the last identified PTN was identified as a CT6 neuron if it had (1) an antidromic latency of >3 ms and (2) a “supernormal” antidromic decrease of >4% to a thalamic stimulus that followed a previous impulse (spontaneous or electrically elicited) at an interval of 8-12 ms (Swadlow, 1990, 1994; Beloozerova et al., 2003a). Figure 1 D shows a microlesion in the uppermost part of layer VI that was made at the site of a neuron that met these criteria. All neurons located at this depth or deeper that responded antidromically to stimulation of VL were classified as CT6 neurons. The axons of CT6 neurons are of fine diameter and thus have high thresholds to electrical stimulation (Rank, 1975; Nowak and Bullier, 1996) (for review, see Swadlow, 1998). Therefore, we likely excited axons passing or terminating very near the stimulation site in the VL.
Processing of neuronal activity
The duration of the stance and swing phases of the forelimb contralateral to the investigated cortical zone was monitored during locomotion by measuring the electrical resistance between the foot and the ground (see Fig. 4 A, Sw/St trace) (Beloozerova and Sirota, 1993, 2003). In selected experiments, locomotion movements were monitored using a three-dimensional real-time motion capture and analysis system (Visualeyez; Phoenix Technologies, Burnaby, British Columbia, Canada).
Figure 4.

An example of typical activity of CT5 neurons. A, Activity of a CT5 neuron at rest and during simple and complex locomotion. The bottom trace shows the swing (Sw) and stance (St) phases of the step cycle of the forelimb contralateral to the recording site in the cortex. B, C, Activity of the same neuron during simple locomotion is presented as a raster of 50 step cycles (B) and as a histogram (C). In the raster, the duration of step cycles is normalized to 100%, and the raster is rank ordered according to the duration of the swing phase. The beginning of the stance phase in each step is indicated by an open triangle. In the histogram, the interrupted line shows the level of activity at rest. The horizontal black bar shows the step-related PEF, as defined in Materials and Methods. D, E, Activity of the same neuron during complex locomotion presented as a raster (D) and as a histogram (E). Vertical scale bar: C, E, 20 imp/s.
The onset of swing phase was taken as the beginning of the step cycle. The Rayleigh test for directionality was used to determine whether the activity of a neuron was modulated in relation to the step cycle (Batshelet, 1981; Fisher, 1993). Several two-peak cells and cells with troughs in activity rather than peaks were also arbitrarily assessed (Drew and Doucet, 1991). If the activity of a neuron was judged to be step cycle related, the duration of each step cycle was divided into 20 equal bins, and a phase histogram of spike activity of the neuron in the cycle was generated and averaged over all successive cycles. The discharge frequency in a bin was derived according to the method of Udo et al. (1982), which weights the data according to the average of the instantaneous frequency of the intervals that fall within the bin as well as those that overlap with its beginning and end. The phase histograms were smoothed by recalculating the value of each bin as follows:  , where Fn is the original values of the bins. The first bin was considered to follow the last one; the last bin was considered to precede the first one. Using the histogram, the “depth” of modulation (dM) was calculated as a measure of periodic changes in the activity of a neuron. It was defined as dM = (Nmax - Nmin)/N × 100%, where Nmax and Nmin are the number of spikes in the maximal and the minimal histogram bin, and N is the total number of spikes in the histogram. In addition, the portion of the cycle in which the activity level exceeded 25% of the difference between the maximal and minimal frequencies in the histogram was defined as a “period of elevated firing” (PEF) (as illustrated in Fig. 4C,E). The “preferred phase” of the discharge of each neuron in the step cycle was assessed using circular statistics (Batshelet, 1981; Fisher, 1993) (see also Beloozerova et al., 2003a). The occurrence of each spike was presented as a vector of a unit length. The angle (the phase) of this vector was calculated by multiplying the relative position of the spike in the cycle (in portions of the cycle) by 2π. The preferred phase was then calculated as the phase of the mean vector divided by 2π. Preferred phases of all individual neurons were plotted against the phase of the step cycle to show their phase distribution.
Parametric tests were used when possible for comparisons between groups. Unless indicated otherwise, for all mean values, the SEM is given. The discharge frequency and modulation of neurons during simple and complex locomotion was compared using a t test. Nonparametric Mann-Whitney (U) or Wilcoxon's (W) tests were used for categorical data.
Receptive field classification
The somatic receptive field of the neurons was examined in animals resting with their head restrained. Stimulation was produced by palpation of muscle bellies, tendons, etc., and by passive joint movements. Receptive field size was determined by listening to the audio monitor and measuring the entire area from which action potentials could be elicited. Directional (flexion-extension) selectivity was accessed by comparing the number of spikes elicited by stimulation in the optimal direction with the direction opposite to optimal.
Histological procedures
At the termination of the experiment, the cats were deeply anesthetized with pentobarbital sodium, and reference electrolytic lesions were made in the areas of recording and stimulation. Cats were perfused transcardially with isotonic saline, followed by a 10% Formalin solution. The brains were removed, blocked, and equilibrated in 30% sucrose. Frozen brain sections of 50 μm thickness were cut in the regions of recording and stimulating electrodes. The tissue was stained for Nissl substance with cresyl violet. Positions of electrode tracks were estimated using the reference lesions.
Results
Characteristics of simple and complex locomotion
The gait that cats used in our experimental chamber both on the flat surface (simple locomotion) and during walking on crosspieces of the horizontal ladder (complex locomotion) was a walk with the support formula 2-3-2-3-2-3-2-3, which indicates the number of limbs in support in different phases of the step cycle. In Figure 2, B and C, the stick figures show the sequential positions of the “leading” forelimb for one representative step for each simple (Fig. 2B) and complex (Fig. 2C) locomotion. It was demonstrated previously (Beloozerova and Sirota, 1993, 2003) that the variability of step lengths during simple locomotion was considerable. During complex locomotion, however, the positions of the ladder crosspieces strictly determined paw placement, and step length did not vary. Also shown previously was that complex locomotion requires vision and an intact motor cortex for foot placement (Trendelenberg, 1911; Liddell and Phillips, 1944; Beloozerova and Sirota, 1993, 2003; Sherk and Fowler, 2001). Across the cats, the mean velocity of simple locomotion was 0.84 ± 0.02 m/s (mean ± SD) and that of complex locomotion was 0.78 ± 0.02 m/s, a little slower as judged by the Wilcoxon's test (W test, p = 0.02). General parameters of simple and complex step cycles are provided in Table 1. The complex locomotion had a slightly longer duration of stance phase (p < 0.004, W test) and a slightly smaller step coefficient (p < 0.001, W test). Thus, complex locomotion was characterized by a precise positioning of feet on the surface, necessary visual control of stepping, and a slightly longer relative duration of stance. The activity of each neuron was recorded during 20-200 step cycles of each simple and complex locomotion: 72 ± 6 (mean ± SD).
Figure 2.

Characteristics of simple and complex locomotion. A, Schematic drawing of the cat showing monitored spots on the forelimb. B, C, Sequential positions of the right forelimb presented as stick figures for one representative step of simple (B) and complex (C) locomotion; for complex locomotion, the leading limb is shown. The monitored spots are numbered. In C, gray rectangles indicate positions of the two crosspieces of the horizontal ladder.
Table 1.
Parameters of steps during simple and complex locomotion (mean ± SD)
|
Parameters |
Simple locomotion |
Complex locomotion |
|---|---|---|
| Step duration | 626 ± 10 ms | 666 ± 13 ms |
| Swing duration | 270 ± 5 ms | 281 ± 8 ms |
| Stance duration | 356 ± 7 ms | 385 ± 8 ms |
| Step coefficient |
43 ± 0.6% |
42 ± 0.6% |
Contrasting corticothalamic conduction times of CT5 and CT6 neurons
CT neurons were sampled from the motor cortex in the rostral and lateral sigmoid gyri (Fig. 1B). Antidromic conduction times were examined in 32 CT5 and 148 CT6 neurons. Figure 1C schematically shows the types of neurons recorded. Antidromic latencies of CT5 and CT6 responses to VL stimulation were dramatically different, falling in the range 0.5-2.0 ms in CT5 and 1.5-52.0 ms in CT6 neurons (Fig. 3A,B). The distribution of CT6 conduction times had two peaks, at 6 and 32 ms, highlighted with a polynomial curve. Most CT6s (60%) responded at latencies of 1.4-19.2 ms, and 40% responded at latencies of 20.5-52.0 ms. The mean latent period of CT5s was 0.9 ± 0.1 ms, that of the faster CT6s group was 8.7 ± 0.5 ms, and that of the slower CT6s group was 32.0 ± 1.0 ms, corresponding to axonal conduction velocities of 40.1 ± 2.4, 5.2 ± 0.4, and 1.0 ± 0.0 m/s, respectively (Fig. 3C,D; Table 2).
Figure 3.

Comparison of axonal conduction velocities of CT5 and CT6 neurons. A, B, Distribution of antidromic latencies to thalamic stimulation of CT5 (A) and CT6 (B) neurons. Note that there is little overlap in these distributions, and the distribution of CT6s is bimodal, which is highlighted with a polynomial curve. C, D, Distribution of conduction velocities of CT5 (C) and CT6 (D) axons projecting to VL. In D, bins with conduction velocities of CT6s with antidromic latency >20 ms are denoted with asterisks.
Table 2.
Parameters of fast CT5, CT6mod, and CT6slow neurons
|
|
Conduction time (ms) |
Conduction velocity (m/s) |
% step related |
Frequency at rest (imp/s) |
Frequency simple (imp/s) |
Frequency complex (imp/s) |
% with receptive fields |
|---|---|---|---|---|---|---|---|
| CT5 | 0.9 | 40.1 | 94% | 14.4 | 15.2 | 18.4 | 100% |
| CT6mod | 8.7 | 5.2 | 39% | 0.4 | 1.0 | 1.4 | 29% |
| CT6slow |
32.0 |
1.0 |
3% |
0.2 |
0.03 |
0.08 |
9% |
The first three columns show, for the three types of CT neurons studied, the mean antidromic conduction times, the mean conduction velocities, and the percentage of neurons that showed step-related responses during simple and/or complex locomotion. The next three columns show, for all members of these populations, the mean firing frequencies while subjects were at rest and engaging in simple or complex locomotion. The last column shows the percentage of each population that had a sensory receptive field.
Of the 32 CT5s, 21 cells also projected to the medullary PT. The efferent neurons of layer V that project to the PT consist of two populations, one with “slow” and one with “fast” conducting axons (Takahashi, 1965). Most of our CT5s projecting to the PT (n = 15) were fast, with conduction velocities of 65.0 ± 5.6 m/s in the PT branch.
Activity of layer V CT neurons
The activity of 32 CT5 neurons was recorded during simple and complex locomotion. All CT5 cells were spontaneously active, and most were modulated according to step phase and changed their activity with the locomotion task.
Figure 4A shows an example of typical CT5 neuron activity during standing, simple locomotion and complex locomotion. During standing, the neuron discharged with a frequency of ∼20 Hz. During simple locomotion, the discharge of the neuron was modulated: it discharged more at the end of swing and beginning of stance. During complex locomotion, the discharge of the neuron peaked in the same phase but became more intense. The pattern of activity of the neuron was consistent across many steps, as illustrated in the rasters that show discharges of the neuron in 50 steps during simple (Fig. 4B) and complex (Fig. 4D) locomotion. Figure 4, C and E, summarizes the discharge frequency of the neuron as a function of the step phase during simple (C) and complex (E) locomotion when the activity of the neuron peaks at ∼45 and 85 impulses per second (imp/s), respectively.
All 32 CT5 neurons were active at rest. With the start of simple locomotion, the majority of the neurons changed their activity; 41% increased and 28% decreased (Fig. 5A), but all of them stayed active (the minimal rate was 4.1 imp/s). Because a similar number of cells changed their activity in opposing ways, the average activity of the CT5 population was close to that at rest (Table 2). The discharge of 30 of 32 CT5s was modulated in the step cycle (Table 2). The dM was 10 ± 0.7%. Figure 5B shows the distribution of the preferred phases (diamonds) superimposed on PEFs (black rectangles) (see definition in Materials and Methods) for all 30 step-related CT5s. The activity of different cells had different preferred phases that were rather evenly distributed over the cycle. Most neurons had one PEF per cycle that ranged in duration from 30 to 75% of the cycle length; the average PEF width was 56 ± 3%. The PEFs were distributed evenly over the cycle, and ∼50% of the neurons were active at any phase of the cycle (Fig. 5C). Because cells active in swing had slightly higher discharge rates, the CT5 population frequency maximum (∼10 imp/s) occurred at the beginning of swing (p < 0.05, t test) (Fig. 5D).
Figure 5.

Population characteristics of step-related CT5s. A, Proportion of neurons in which the mean discharge frequency increased (black), decreased (gray), and did not change (white) during transition from rest to simple locomotion. B, G, Phase distribution of PEFs of the neurons in the step cycle during simple (B) and complex (G) locomotion. Each trace represents a PEF of one neuron. Neurons are rank ordered so that those bursting earlier in the cycle are plotted on the top of the graph (shown in black in 1 cycle only).C, H, A histogram of the relative percentage of active neurons in different phases of the step cycle during simple (C) and complex (H) locomotion. D, I, Phase distribution of the mean frequencies of the step-related neurons in the step cycle during simple (D) and complex (I) locomotion. Error bars are SEM. E, Proportion of neurons in which the mean discharge frequency increased, decreased, and did not change during transition from simple to complex locomotion; color codes are the same as in A. F, Proportion of neurons in which the coefficient of dM increased, decreased, and did not change during transition from simple to complex locomotion; color codes are same as in A. Sw, Swing phase; St, stance phase.
All CT5s were also active during complex locomotion. Compared with simple locomotion, 44% of the cells increased and 16% decreased their activity during complex locomotion (Fig. 5E). The discharge of 26 of 32 CT5s was modulated in relation to the step cycle during complex locomotion, similar to simple locomotion (Table 2). However, the dM changed in 72% of the neurons, increasing in 34% and decreasing in 38% compared with simple locomotion (Fig. 5F). The average dM was 11 ± 0.8%, the same as during simple locomotion. As during simple locomotion, the activity of different CT5s had different preferred phases, and their distribution was rather equal across the cycle (Fig. 5G). However, the preferred phases of 60% of the neurons changed: by 10% of the cycle in 30% and by 15-20% of it in another 30% of the cells. The majority of the neurons had one PEF per cycle that ranged in duration from 30 to 75% of it, and, similar to simple locomotion, the average PEF width was 59 ± 3% of the cycle. However, the PEFs were slightly unevenly distributed over the cycle: more neurons were active at the beginning of swing than in any other step phase (p < 0.05, χ2 test) (Fig. 5I).
Activity of CT6 neurons with moderately conducting axons: CT6mod neurons
CT6mods were very distinct from the CT5s. At rest, 61% (42 of 69) of these cells were virtually silent, emitting <1 imp/min during a 10 min test period. The mean rate for all CT6mods was 0.4 ± 0.1 imp/s, and that for active cells (those discharging above 1 imp/min) was 1.1 ± 0.3 imp/s. These discharge rates were significantly lower than those of CT5s, all of which were active at rest (p < 0.001, U test; Table 2).
Forty-six CT6mod neurons were studied during simple and complex locomotion. During simple locomotion, 54% (25 of 46) of the CT6mods were active, one-third (16 of 46) was step phase modulated, and a minority changed activity based on locomotion task. Figure 6A shows a typical active CT6mod neuron. This neuron fired three spikes in one round (13 steps) of walking that included both simple and complex locomotion. Although the neuron did not fire during most of the steps, it did respond to VL stimulation (Stim 1, see also the inset) during these steps. Figure 6B shows in a raster format the activity of this neuron during 50 steps of simple locomotion. The neuron discharged nine spikes, eight of which were in swing, most of them in the first half of this phase. Thus, although extremely low, the activity of the neuron was step phase related, as shown in the summary histogram (Fig. 6C). During complex locomotion, the activity of the neuron rose somewhat; it discharged 16 spikes in 50 steps, all of them in swing, again mostly in the first half of that phase (Fig. 6D). Thus, as shown in the summary histogram (Fig. 6E), although still very low, the activity of the neuron was step phase related and greater during complex locomotion.
Figure 6.

Typical and exotic examples of CT6mod activity. A-E, A typical example of CT6mod neuron activity. A, A CT6mod neuron discharged three spikes in one round of locomotion consisting of 13 steps. In the absence of spontaneous activity, the neuron responded to stimulation of the VL, which is indicated on the Stim 1 trace. The response of the neuron is also shown at a faster time scale in the inset above. B, C, Activity of the neuron during simple locomotion is presented as a raster of 50 step cycles (B) and as a histogram (C). D, E, Activity of the same neuron during complex locomotion presented as a raster (D) and as a histogram (E). Vertical scale bar: C, E, 0.1 imp/s. F-J, An exotic example of activity of CT6mod neurons. F, A CT6mod neuron discharged several spikes during each step, with more spikes fired during complex locomotion. G, H, Activity of the neuron during simple locomotion is presented as a raster of 50 step cycles (G) and as a histogram (H). I, J, Activity of the same neuron during complex locomotion presented as a raster (I) and as a histogram (J). Note that the activity of the neuron peaks at ∼10 imp/s during simple and at 18 imp/s during complex locomotion. Vertical scale bar: H, J, 5 imp/s. Designations as in Figure 4. Sw, Swing phase; St, stance phase.
With the start of simple locomotion, a smaller portion of the CT6mods compared with CT5s, changed their resting firing rate: 22% increased and 13% decreased (Fig. 7A). Because more neurons increased their activity than decreased, during simple locomotion, the discharge rates of CT6mods were slightly higher than at rest (p < 0.05, t test) but still significantly lower than the rates of CT5s tested under the same conditions (2.0 ± 0.5 imp/s, active cells only; p < 0.001, U test) (Table 2).
Figure 7.

Population characteristics of step-related CT6mods. A, Proportion of neurons in which the mean discharge frequency increased (black), decreased (gray), and did not change (white) during transition from rest to simple locomotion. B, G, Phase distribution of responses of the neurons in the step cycle during simple (B) and complex (G) locomotion. Each trace represents a PEF of one neuron. C, H, A histogram of the relative number of active neurons in different phases of step cycle during simple (C) and complex (H) locomotion. D, I, Phase distribution of the mean frequencies of the step-related neurons in the step cycle during simple (D) and complex (I) locomotion. Error bars are SEM. E, Proportion of neurons in which the mean discharge frequency increased, decreased, and did not change during transition from simple to complex locomotion; color codes are the same as in A. F, Proportion of neurons in which the coefficient of dM increased, decreased, and did not change during transition from simple to complex locomotion; color codes are same as in A. Sw, Swing phase; St, stance phase.
The discharge of 16 of 46 CT6mods was modulated in the step cycle (Table 2). The dM was 18 ± 1%, significantly higher than in CT5 neurons (11 ± 0.8%; p < 0.05, t test). Figure 7B shows the distribution of preferred phases (diamonds) for all 16 step-related CT6mods superimposed on the PEFs of the neurons (black rectangles). In contrast to CT5s, the preferred phases of CT6mods concentrated in the first half of the cycle, during swing and beginning of stance. Most neurons had one PEF per cycle that ranged in duration from 20 to 50% of the cycle and averaged 35 ± 3% of the cycle, significantly shorter than that of CT5 neurons (56 ± 3%; p < 0.05, t test). In addition, the PEFs of CT6mods were unevenly distributed in the cycle: more neurons were active in swing than in stance (Fig. 7C). The weak maximum of the population seen at ∼1 imp/s also occurred in swing (Fig. 7D). It was, however, ∼10 times lower than the peak of the CT5 population (Fig. 5D)
Little change in the mean activity of CT6mod neurons occurred during complex compared with simple locomotion: firing rates increased in 13% of the cells and decreased in 2% (Fig. 7E). The population activity was similar to that seen during simple locomotion and significantly lower than that of the CT5 group tested during complex locomotion (2.4 ± 0.5 imp/s; p < 0.001, U test) (Table 2). The discharge of 18 of 46 CT6mods was modulated in relation to the step cycle (Table 2). Compared with simple locomotion, the dM changed in 55% of the neurons, increasing in 45% and decreasing in 10% (Fig. 7F), and on average was 17 ± 1.3%, the same as during simple locomotion. During complex locomotion, the activity of different CT6mods had different preferred phases (Fig. 7G) that were more evenly distributed over the cycle compared with simple locomotion (Fig. 7H). Overall, however, the preferred phases of 90% of CT6mods stayed unchanged during transition from simple to complex locomotion. In contrast, 60% of CT5s shifted their preferred phases during this transition. The majority of the CT6mods had one PEF per cycle that ranged in duration from 20 to 50% of the cycle, which, similar to simple locomotion, averaged 34 ± 2%. This was significantly shorter than that of CT5 neurons tested under the same conditions (59 ± 3%; p < 0.05, t test). As were the preferred phases, the PEFs were unevenly distributed in the cycle: more neurons were active in swing than in stance (p < 0.05, χ2 test) (Fig. 7H), and the ∼1.5 imp/s CT6mod population frequency maximum still occurred in swing (Fig. 7I).
Among all of the CT6mod neurons active during locomotion, five cells (11% of the total group) demonstrated an atypical activity: they had step-related discharges with rather high peaks of 5-30 imp/s, which is in the lower half of the CT5s peaking range (Fig. 6F-J). These relatively intense PEFs were much narrower, however, than CT5 PEFs.
Activity of CT6 neurons with slowly conducting axons: CT6slow neurons
CT6slows were distinct from both the CT5 and the CT6mod neurons. At rest, 81% (35 of 43) of CT6slows were virtually silent, emitting <1 imp/min during a 10 min test period. The mean discharge rate for all CT6slows was 0.2 ± 0.1 imp/s, significantly lower than the discharge rate of CT5s and the CT6mods (p < 0.05, U test) (Table 2). The discharge rate of the active CT6slows (those discharging above 1 imp/min) was 1.3 ± 0.5 imp/s, similar to that of the active CT6mods (1.1 ± 0.3 imp/s).
Thirty-one CT6slow neurons were studied during simple and complex locomotion. Only 13% (4 of 31) of these were active during simple locomotion. Figure 8 shows a typical CT6slow neuron. Although inactive throughout all behaviors, it did respond with an antidromic spike when a stimulus was applied to VL (Stim 1, see also the inset).
Figure 8.

Typical example of activity of CT6slows. A CT6slow neuron was completely silent at rest as well as during both simple and complex locomotion, but it responded to stimulation of the VL, as indicated on the Stim 1 trace. The response of the neuron is also shown at a faster time scale in the inset above. Designations as in Figure 4. Sw, Swing phase; St, stance phase.
With the start of simple locomotion, 10% of CT6slows increased and 3% decreased their resting firing rate. Thus, during simple locomotion, the discharge rates of CT6slows were slightly higher than at rest (p < 0.05, t test) but still significantly lower than the rates of CT5s and CT6mods tested under the same conditions (0.2 ± 0.5 imp/s, active cells only; p < 0.001, U test) (Table 2). No CT6slow discharge was step related during simple locomotion.
No change occurred in the mean activity of CT6slow neurons during complex compared with simple locomotion. This activity was significantly lower than that of CT5s and CT6mods tested during complex locomotion (0.4 ± 0.2 imp/s; p < 0.001, U test) (Table 2). The discharge of only one CT6slow neuron was step related during complex locomotion.
Figure 9 presents a summary of the involvement of different classes of corticothalamic neurons in locomotion-related activity and compares parameters of their step-related frequency modulation.
Figure 9.

Comparison of locomotion-related characteristics of CT5, moderate CT6, and slow CT6 populations. A, Percentages of the neurons that generated activity above 1 imp/min: Rest, when standing; Simple, during simple locomotion; Complex, during complex locomotion. B, Presented for the step-related neurons are the following: dM, depth of step-related activity modulation during simple locomotion; PEF width, mean period of elevated firing width during simple locomotion; Shift, number of neurons that change their preferred phase by ≥10% of the cycle during transition from simple to complex locomotion. Error bars are SEM.
Contrasting receptive field properties of fast CT5, moderate CT6, and slow CT6 neurons
The somatosensory receptive fields were tested in 19 CT5, 45 CT6mod, and 32 CT6slow neurons. While all CT5s had a receptive field, only 29% of the CT6mods and 9% of the CT6slows did. The receptive fields of all CT5s were excitatory, but 5 of 13 responsive CT6mods and 2 of 3 responsive CT6slows were inhibited by the somatosensory stimulation. The receptive field sizes of CT5, CT6mod, and CT6slow populations were dramatically different: whereas receptive fields of 63% of CT5s were confined to one segment of the limb, receptive fields of all CT6slows and all but one CT6mods occupied the whole limb. In addition, 80% of somatosensory responses of CT5 neurons had a directional preference: 33% preferred flexion to extension and 47% preferred extension to flexion. In contrast, the receptive fields of only one neuron in each of the moderate and slow CT6 populations had a directional selectivity.
Five CT6mod neurons with somatosensory receptive fields, three inhibitory and two excitatory, were tested during locomotion. The three cells with inhibitory receptive fields were active during locomotion, and the activity of two was step phase related. One cell with an excitatory receptive field was inactive during locomotion; the other had step phase related activity. The activity of one CT6slow neuron with an excitatory somatosensory receptive field was step related during complex locomotion.
Discussion
We identified three classes of CT neurons based on their laminar origin and axonal conduction times. Layer V gives rise to a distinct class of CT neurons with rapidly conducting axons that are generally branches of PT axons terminating in the lower brainstem reticular formation or in the spinal cord. Based on the axonal conduction velocities of this group, these are large-diameter, myelinated axons. In contrast, layer VI gives rise to CT axons with a wide distribution of axonal conduction times. Because distinct peaks in this distribution could be discerned, we differentiated this population into two classes, a moderately conducting group with conduction times of 1.4-19.2 ms and a slowly conducting group with conduction times of 20.5-52 ms. The latter conduction times correspond to conduction velocities of 0.67-1.7 m/s, which are suggestive of a primarily nonmyelinated axonal population (Waxman and Bennett, 1972; Waxman and Swadlow, 1977).
CT5 neurons were remarkably distinct from both classes of CT6 neurons in their locomotion-related behavior, receptive fields, and spontaneous firing rates. We reported previously analogous findings in the layer V and VI CT projections in the rabbit motor cortex during simple and complex locomotion, during a posture correction task, and at rest (Swadlow, 1994; Beloozerova et al., 2003a,c). In those studies, CT6 neurons also differed from the CT5 population in having slower and more widely distributed conduction times, but the distribution of the CT6 population was not bimodal and thus considered as a single class. As in the present study, most CT6 neurons in the rabbit motor cortex exhibited little or no locomotion-related activity, lacked sensory receptive fields, and had virtually no spontaneous activity. Notably, properties of CT6 neurons in rabbit visual and somatosensory cortices showed remarkably similar characteristics (Swadlow and Weyand, 1987; Swadlow, 1990). Also, in a study on the cat visual cortex, it was found that corticogeniculate projecting neurons of layer VI can be subdivided into groups according to their conduction velocities and that the neurons of the slowest conducting group (0.3-1.6 m/s) were not responsive to visual stimulation (Tsumoto and Suda, 1980).
A recent preliminary report on the primate motor cortex (Ruffo and Anderson, 2004) distinguished two populations of CT neurons, one with fast-conducting axons that showed task-related activity and another with slowly conducting axons that showed little or no spontaneous or task-related activity. The laminar distribution of these distinct populations was not specified, but we would speculate that these fast and slowly conducting primate CT populations originate in layers V and VI, respectively. If so, these similar CT populations in cat, rabbit, and monkey suggest a similar plan for the CT projections of layers V and VI of the motor cortex in these species.
Most of the CT5 neurons that we studied also projected to the pyramidal tract. Not surprisingly, therefore, the locomotion-related behavior of CT5s closely resembled that of PTNs (Beloozerova and Sirota, 1993; Drew, 1993). Thus, CT5s seem to transmit to the thalamus an “efference copy” of the corticospinal signal. What might be a role of this efference copy in transmission of locomotion-related signals in thalamus? It was suggested previously that the rostral subdivision of the cat motor cortex, in which our data were collected, is involved in initiation of prehensile movements (Vicario et al., 1983). From the fast-conduction velocity of axons of CT5s, including their branches to the thalamus (Fig. 3C), the quickly rising EPSPs that they produce in thalamic neurons (Salt, 2002; Li et al., 2003; Reichova and Sherman, 2004), and the hundred millisecond locomotion task time scale (Table 1), one can conclude that the efference copy signal from CT5s arrives at the thalamus with a delay of only a few milliseconds relative to the ascending activity that triggered activation of the thalamo-corticothalamic loop. One function of the efference copy signal in the thalamus during locomotion could be to suppress the incoming activity to which a cortical response already had been formed and sent to the spinal cord. This can potentially be accomplished via VL inhibitory interneurons or the disynaptic loop involving the reticular nucleus of the thalamus. In this study, most of the CT5s that also projected to the pyramidal tract were fast-conducting PTNs. In red nucleus, it has been shown that the collaterals of fast PTNs inhibit red nucleus efferent neurons through local interneurons (Tsukahara et al., 1968). Because the CT5 activity is rather evenly distributed over the cycle (Fig. 5B-I), it will equally affect VL neurons in all step phases. This efference copy signal may contribute to the planning and execution of the precise foot placement (Vicario et al., 1983; Beloozerova and Sirota, 1993; Drew, 1993).
The majority of the faster of the two CT6 populations, the CT6mods, showed little or no spontaneous or locomotion related activity, and most of the other CT6mods responded sparsely. However, approximately one-third of these neurons did respond in a step-related manner when the cat engaged in simple or complex locomotion, and these responses were more precisely timed than those of CT5 neurons (Figs. 5B,G, 7B,G). The question arises as to how this sparse but precisely timed activity of a minority of CT6mod neurons impacts the transmission of signals in the thalamus. In this regard, it should be noted that some layer VI CT synapses have been shown to be “facilitating,” and that facilitating synapses are thought to have a low release probability to single, temporally isolated spikes (Turner and Salt, 1998; Castro-Alamancos and Calcagnotto, 1999; Li et al., 2003; Reichova and Sherman, 2004). Thus, not only do few CT6mod neurons generate locomotion-related action potentials, but these sparse spikes are likely to result in weak postsynaptic responses. Similar problems in defining a role for the layer VI CT projection are incurred in sensory neocortex. In fully awake rabbits, for example, CT6 neurons of both the somatosensory and visual cortices (Swadlow and Weyand, 1987; Swadlow, 1989) show little or no spontaneous activity, highly restricted responses (or no responses) to sensory stimulation, and a very wide distribution of axonal conduction times. Nevertheless, a considerable literature describes roles for layer VI CT projections in sensory processing (Sillito et al., 1993; Ghazanfar et al., 2001; Temereanca and Simons, 2004). Moreover, recent studies in other systems suggest an important role for temporally sparse but precisely timed responses (Vinje and Gallant, 2000; Hahnloser et al., 2002; Laurent, 2002; Fiete et al., 2004).
One function of the CT6mod locomotion-related signal to the thalamus might be to suppress incoming activity to which a cortical response had been formed already. This suppression would be considerably different from the one provided by the CT5 projection, however. CT6mod descending impulses are slowly conducting and temporally distributed (Fig. 3D), and they are likely to generate slowly rising EPSPs (with a metabotropic component) in thalamic neurons (Salt, 2002; Li et al., 2003; Reichova and Sherman, 2004; Zhang and Jones, 2004). This should engage thalamic circuitry at a later time compared with CT5s. As a group, CT6mod input would cover a wide range of delays, but the timing of individual neurons would be very precise. Because CT6 neurons synapse on both interneurons of VL and the inhibitory neurons of the thalamic reticular nucleus, their inhibitory influence on thalamic relay neurons may be considerable. Moreover, CT6 neurons have widespread terminations in the thalamus (Kakei et al., 2001), thus, through inhibitory circuitry, they have a potential to suppress thalamic neurons in the neighboring somato-topical domains, thereby increasing spatial “contrast” of the incoming thalamic signal. Such a function of the CT projection from layer VI has been demonstrated in the somatosensory system (Temereanca and Simons, 2004).
The functional role of the slowly conducting CT6slows is enigmatic. The great majority of these neurons were virtually silent at rest and during both simple and complex locomotion in the cat. In the rabbit somatosensory and visual cortices, most of the slowest conducting CT6s were silent, although subjects were awake and alert, and neighboring neurons responded briskly, with well defined receptive fields. Of course, in the current work, we explored only a small region of the “behavioral space” in which this area of motor cortex could be involved. It is certainly possible that behavioral task (or state) could unleash a barrage of spikes from these cells.
Our finding of distinct differences in the activity of layer V and VI CT neurons is consistent with the hypothesis of Sherman and Guillery (Guillery and Sherman, 2002; Guillery, 2003) regarding the role of the thalamus as a monitor of motor output. These authors suggested that layer V CT neurons provide the thalamus with feedforward information about the cortical output that have been sent to lower centers (an efference copy of the output). The thalamus then distributes this signal to the other cortical areas so they can coordinate their action. According to the hypothesis, layer VI CT neurons play a modulatory role as part of a feedback system. The hypothesis of Sherman and Guillery was primarily based on results obtained in the visual and somatosensory systems. Here we present data on the CT projections of the motor cortex, the cortical region that most directly controls planning and execution of movements. Moreover, for the first time, such data were obtained during a complex motor behavior.
In summary, we identified three channels of motor corticothalamic communication during locomotion. One is via collaterals of PT neurons that promptly provides the thalamus with an efference copy of the motor command. The second channel is formed by the CTmod projection from layer VI, which, with a variety of delays (2-20 ms), provides the thalamus with a step phase-specific and locomotion task-specific signal. The third, the slowly conducting CT6slow channel, is virtually silent during locomotion, and its function is enigmatic. The nature of the cooperation between these three channels in shaping locomotion-related activity in the thalamus remains an open question.
Footnotes
This work was supported by National Institutes of Health Grants R01 NS-39340 (I.N.B.) and MH-64024 (H.A.S.). We thank Peter Wettenstein for expert technical support.
Correspondence should be addressed to Dr. Irina Beloozerova, Neurobiology, Barrow Neurological Institute, St. Joseph's Hospital and Medical Center, 350 West Thomas Road, Phoenix, AZ 85013. E-mail: ibelooz@chw.edu.
Copyright © 2005 Society for Neuroscience 0270-6474/05/255915-11$15.00/0
References
- Batshelet E (1981) Circular statistics in biology. New York: Academic.
- Beloozerova IN, Sirota MG (1993) The role of the motor cortex in the control of accuracy of locomotor movements in the cat. J Physiol (Lond) 461: 1-25. [DOI] [PMC free article] [PubMed] [Google Scholar]
- Beloozerova IN, Sirota MG (2003) Integration of motor and visual information in parietal area 5 during locomotion. J Neurophysiol 90: 961-971. [DOI] [PubMed] [Google Scholar]
- Beloozerova IN, Sirota MG, Swadlow HA (2003a) Activity of different classes of neurons of the motor cortex during locomotion. J Neurosci 23: 1087-1097. [DOI] [PMC free article] [PubMed] [Google Scholar]
- Beloozerova IN, Sirota MG, Swadlow HA (2003b) Activity and silence of feline motor cortex efferent populations during locomotion. Soc Neurosci Abstr 29: 921.22. [Google Scholar]
- Beloozerova IN, Sirota MG, Swadlow HA, Orlovsky GN, Popova LB, Deliagina TG (2003c) Activity of different classes of neurons of the motor cortex during postural corrections. J Neurosci 23: 7844-7853. [DOI] [PMC free article] [PubMed] [Google Scholar]
- Bishop PO, Burke W, Davis R (1962) The identification of single units in central visual pathways. J Physiol (Lond) 162: 409-431. [DOI] [PMC free article] [PubMed] [Google Scholar]
- Canedo A (1997) Primary motor cortex influences on the descending and ascending systems. Prog Neurobiol 51: 287-335. [DOI] [PubMed] [Google Scholar]
- Castro-Alamancos MA, Calcagnotto ME (1999) Presynaptic long-term potentiation in corticothalamic synapses. J Neurosci 19: 9090-9097. [DOI] [PMC free article] [PubMed] [Google Scholar]
- Desbois C, Le Bars D, Villanueva L (1999) Organization of cortical projections to the medullary subnucleus reticularis dorsalis: a retrograde and anterograde tracing study in the rat. J Comp Neurol 410: 178-196. [PubMed] [Google Scholar]
- Descheenes M, Hu B (1990) Electrophysiology and pharmacology of the corticothalamic input to lateral thalamic nuclei: an intracellular study in the cat. Eur J Neurosci 2: 140-152. [DOI] [PubMed] [Google Scholar]
- Drew T (1993) Motor cortical activity during voluntary gait modifications in the cat. I. Cells related to the forelimbs. J Neurophysiol 70: 179-199. [DOI] [PubMed] [Google Scholar]
- Drew T, Doucet S (1991) Application of circular statistics to the study of neuronal discharge during locomotion. J Neurosci Methods 38: 171-181. [DOI] [PubMed] [Google Scholar]
- Fiete IR, Hahnloser RH, Fee MS, Seung HS (2004) Temporal sparseness of the premotor drive is important for rapid learning in a neural network model of birdsong. J Neurophysiol 92: 2274-2282. [DOI] [PubMed] [Google Scholar]
- Fisher NI (1993) Statistical analysis of circular data. Cambridge, UK: Cambridge UP.
- Fuller JH, Schlag J (1976) Determination of antidromic excitation by the collision test: problems of interpretation. Brain Res 122: 283-298. [DOI] [PubMed] [Google Scholar]
- Ghazanfar AA, Krupa DJ, Nicolelis MA (2001) Role of cortical feedback in the receptive field structure and nonlinear response properties of somatosensory thalamic neurons. Exp Brain Res 141: 88-100. [DOI] [PubMed] [Google Scholar]
- Ghosh S, Fyffe RE, Porter R (1988) Morphology of neurons in area 4 gamma of the cat's cortex studied with intracellular injection of HRP. J Comp Neurol [corrected and issued with original paging (1988) 277] 277: 290-312. [DOI] [PubMed] [Google Scholar]
- Golshani P, Warren RA, Jones EG (1998) Progression of change in NMDA, non-NMDA, and metabotropic glutamate receptor function at the developing corticothalamic synapse. J Neurophysiol 80: 143-154. [DOI] [PubMed] [Google Scholar]
- Groos WP, Ewing LK, Carter CM, Coulter JD (1978) Organization of corticospinal neurons in the cat. Brain Res 143: 393-419. [DOI] [PubMed] [Google Scholar]
- Guillery RW (2003) Branching thalamic afferents link action and perception. J Neurophysiol 90: 539-548. [DOI] [PubMed] [Google Scholar]
- Guillery RW, Sherman SM (2002) The thalamus as a monitor of motor outputs. Philos Trans R Soc Lond B Biol Sci 357: 1809-1821. [DOI] [PMC free article] [PubMed] [Google Scholar]
- Hahnloser RH, Kozhevnikov AA, Fee MS (2002) An ultra-sparse code underlies the generation of neural sequences in a songbird. Nature 419: 65-70. [DOI] [PubMed] [Google Scholar]
- Hentall ID, Zorman G, Kansky S, Fields HL (1984) Relations among threshold, spike height, electrode distance, and conduction velocity in electrical stimulation of certain medullospinal neurons. J Neurophysiol 51: 968-977. [DOI] [PubMed] [Google Scholar]
- Jones EG, Wise SP (1977) Size, laminar and columnar distribution of efferent cells in the sensory-motor cortex of monkeys. J Comp Neurol 175: 391-438. [DOI] [PubMed] [Google Scholar]
- Kakei S, Na J, Shinoda Y (2001) Thalamic terminal morphology and distribution of single corticothalamic axons originating from layers 5 and 6 of the cat motor cortex. J Comp Neurol 437: 170-185. [DOI] [PubMed] [Google Scholar]
- Keizer K, Kuypers HG (1984) Distribution of corticospinal neurons with collaterals to lower brain stem reticular formation in cat. Exp Brain Res 54: 107-120. [DOI] [PubMed] [Google Scholar]
- Keizer K, Kuypers HG (1989) Distribution of corticospinal neurons with collaterals to the lower brain stem reticular formation in monkey (Macaca fascicularis). Exp Brain Res 74: 311-318. [DOI] [PubMed] [Google Scholar]
- Laurent G (2002) Olfactory network dynamics and the coding of multidimensional signals. Nat Rev Neurosci 3: 884-895. [DOI] [PubMed] [Google Scholar]
- Li J, Guido W, Bickford ME (2003) Two distinct types of corticothalamic EPSPs and their contribution to short-term synaptic plasticity. J Neurophysiol 90: 3429-3440. [DOI] [PubMed] [Google Scholar]
- Liddell EGT, Phillips CG (1944) Pyramidal section in the cat. Brain 67: 1-9. [Google Scholar]
- Liu XB, Jones EG (1999) Predominance of corticothalamic synaptic inputs to thalamic reticular nucleus neurons in the rat. J Comp Neurol 414: 67-79. [PubMed] [Google Scholar]
- Liu XB, Honda CN, Jones EG (1995) Distribution of four types of synapse on physiologically identified relay neurons in the ventral posterior thalamic nucleus of the cat. J Comp Neurol 352: 69-91. [DOI] [PubMed] [Google Scholar]
- McCormick DA, von Krosigk M (1992) Corticothalamic activation modulates thalamic firing through glutamate “metabotropic” receptors. Proc Natl Acad Sci USA 89: 2774-2778. [DOI] [PMC free article] [PubMed] [Google Scholar]
- Nowak LG, Bullier J (1996) Spread of stimulating current in the cortical gray matter of rat visual cortex studied on a new in vitro slice preparation. J Neurosci Methods 67: 237-248. [PubMed] [Google Scholar]
- Nudo RJ, Masterton RB (1990) Descending pathways to the spinal cord. III. Sites of origin of the corticospinal tract. J Comp Neurol 296: 559-583. [DOI] [PubMed] [Google Scholar]
- Pryor K (1975) Lads before the wind. New York: Harper and Row.
- Rank JB (1975) Which elements are excited in electrical stimulation of mammalian central nervous system: a review. Brain Res 98: 417-440. [DOI] [PubMed] [Google Scholar]
- Rapisarda C, Simonelli G, Monti S (1985) Cells of origin and topographic organization of corticospinal neurons in the guinea pig by the retrograde HRP method. Brain Res 334: 85-96. [DOI] [PubMed] [Google Scholar]
- Reichova I, Sherman SM (2004) Somatosensory corticothalamic projections: distinguishing drivers from modulators. J Neurophysiol 92: 2185-2197. [DOI] [PubMed] [Google Scholar]
- Reitboeck HJ (1983) Fiber microelectrodes for electrophysiological recordings. J Neurosci Methods 8: 249-262. [DOI] [PubMed] [Google Scholar]
- Ruffo M, Anderson M (2004) Corticothalamic neurons in the motor system consist of at least two electrophysiologically distinct populations. Soc Neurosci Abstr 30: 70.11. [Google Scholar]
- Salt TE (2002) Glutamate receptor functions in sensory relay in the thalamus. Philos Trans R Soc Lond B Biol Sci 357: 1759-1766. [DOI] [PMC free article] [PubMed] [Google Scholar]
- Scharfman HE, Lu SM, Guido W, Adams PR, Sherman SM (1990) N-methyl-d-aspartate receptors contribute to excitatory postsynaptic potentials of cat lateral geniculate neurons recorded in thalamic slices. Proc Natl Acad Sci USA 87: 4548-4552. [DOI] [PMC free article] [PubMed] [Google Scholar]
- Sherman S, Guillery RW (2001) Exploring the thalamus. New York: Academic.
- Sherk H, Fowler GA (2001) Visual analysis and image motion in locomoting cats. Eur J Neurosci 13: 1239-1248. [DOI] [PubMed] [Google Scholar]
- Shinoda Y, Arnold AP, Asanuma H (1976) Spinal branching of corticospinal axons in the cat. Exp Brain Res 26: 215-234. [DOI] [PubMed] [Google Scholar]
- Sillito AM, Cudeiro J, Murphy PC (1993) Orientation sensitive elements in the corticofugal influence on centre-surround interactions in the dorsal lateral geniculate nucleus. Exp Brain Res 93: 6-16. [DOI] [PubMed] [Google Scholar]
- Skinner BF (1938) The behavior of organisms. New York: Appleton-Century-Crofts.
- Steriade M (2001) Impact of network activities on neuronal properties in corticothalamic systems. J Neurophysiol 86: 1-39. [DOI] [PubMed] [Google Scholar]
- Swadlow HA (1989) Efferent neurons and suspected interneurons in S-1 vibrissa cortex of the awake rabbit: receptive fields and axonal properties. J Neurophysiol 62: 288-308. [DOI] [PubMed] [Google Scholar]
- Swadlow HA (1990) Efferent neurons and suspected interneurons in S-1 forelimb representation of the awake rabbit: receptive fields and axonal properties. J Neurophysiol 63: 1477-1498. [DOI] [PubMed] [Google Scholar]
- Swadlow HA (1994) Efferent neurons and suspected interneurons in motor cortex of the awake rabbit: axonal properties, sensory receptive fields and subthreshold synaptic inputs. J Neurophysiol 71: 437-453. [DOI] [PubMed] [Google Scholar]
- Swadlow HA (1998) Neocortical efferent neurons with very slowly conducting axons: strategies for reliable antidromic identification. J Neurosci Methods 79: 131-141. [DOI] [PubMed] [Google Scholar]
- Swadlow HA, Weyand TG (1981) Efferent systems of the rabbit visual cortex: laminar distribution of the cells of origin, axonal conduction velocities, and identification of axonal branches. J Comp Neurol 203: 799-822. [DOI] [PubMed] [Google Scholar]
- Swadlow HA, Weyand TG (1987) Corticogeniculate neurons, corticotectal neurons and suspected interneurons in visual cortex of awake rabbits: receptive field properties, axonal properties and effects of EEG arousal. J Neurophysiol 57: 977-1001. [DOI] [PubMed] [Google Scholar]
- Swadlow HA, Waxman SG, Rosene DL (1978) Latency variability and the identification of antidromically activated units in mammalian brain. Exp Brain Res 32: 439-443. [DOI] [PubMed] [Google Scholar]
- Takahashi K (1965) Slow and fast groups of pyramidal tract cells and their respective membrane properties. J Neurophysiol 28: 908-924. [DOI] [PubMed] [Google Scholar]
- Temereanca S, Simons DJ (2004) Functional topography of corticothalamic feedback enhances thalamic spatial response tuning in the somatosensory whisker/barrel system. Neuron 41: 639-651. [DOI] [PubMed] [Google Scholar]
- Toyoshima K, Sakai H (1982) Exact cortical extent of the origin of the corticospinal tract (CST) and the quantitative contribution to the CST in different cytoarchitectonic areas. A study with horseradish peroxidase in the monkey. J Hirnforsch 23: 257-269. [PubMed] [Google Scholar]
- Trendelenberg W (1911) Untersuchungen uber reizlose vorubergehende Aussaltung am Zentralnervensystem. III. Die extermitaten Region der Grosshirninde. Pflügers Arch 137: 515-544. [Google Scholar]
- Tsukahara N, Fuller DR, Brooks VB (1968) Collateral pyramidal influences on the corticorubrospinal system. J Neurophysiol 31: 467-484. [DOI] [PubMed] [Google Scholar]
- Tsumoto T, Suda K (1980) Three groups of corticogeniculate neurons and their distribution in binocular and monocular segments of cat striate cortex. J Comp Neurol 193: 223-236. [DOI] [PubMed] [Google Scholar]
- Turner JP, Salt TE (1998) Characterization of sensory and corticothalamic excitatory inputs to rat thalamocortical neurones in vitro. J Physiol (Lond) 510: 829-843. [DOI] [PMC free article] [PubMed] [Google Scholar]
- Udo M, Kamei H, Matsukawa K, Tanaka K (1982) Interlimb coordination in cat locomotion investigated with perturbation. II. Correlates in neuronal activity of Deiter's cells of decerebrate walking cats. Exp Brain Res 46: 438-447. [DOI] [PubMed] [Google Scholar]
- van Horn SC, Erisir A, Sherman SM (2000) Relative distribution of synapses in the A-laminae of the lateral geniculate nucleus of the cat. J Comp Neurol 416: 509-520. [PubMed] [Google Scholar]
- Vicario DS, Martin JH, Ghez C (1983) Specialized subregions in the cat motor cortex: a single unit analysis in the behaving cat. Exp Brain Res 51: 351-367. [Google Scholar]
- Vinje WE, Gallant JL (2000) Sparse coding and decorrelation in primary visual cortex during natural vision. Science 287: 1273-1276. [DOI] [PubMed] [Google Scholar]
- von Krosigk M, Monckton JE, Reiner PB, McCormick DA (1999) Dynamic properties of corticothalamic excitatory postsynaptic potentials and thalamic reticular inhibitory postsynaptic potentials in thalamocortical neurons of the guinea-pig dorsal lateral geniculate nucleus. Neuroscience 91: 7-20. [DOI] [PubMed] [Google Scholar]
- Waxman SG, Bennett MV (1972) Relative conduction velocities of small myelinated and non-myelinated fibres in the central nervous system. Nat New Biol 238: 217-219. [DOI] [PubMed] [Google Scholar]
- Waxman SG, Swadlow HA (1977) The conduction properties of axons in central white matter. Prog Neurobiol 8: 297-324. [DOI] [PubMed] [Google Scholar]
- Wilson JR, Friedlander MJ, Sherman SM (1984) Fine structural morphology of identified X- and Y-cells in the cat's lateral geniculate nucleus. Proc R Soc Lond B Biol Sci 221: 411-436. [DOI] [PubMed] [Google Scholar]
- Zhang L, Jones EG (2004) J Corticothalamic inhibition in the thalamic reticular nucleus. J Neurophysiol 91: 759-766. [DOI] [PubMed] [Google Scholar]