

Abstract
Human speech perception is profoundly influenced by vision. Watching a speaker's mouth movements significantly improves comprehension, both for normal listeners in noisy environments and especially for the hearing impaired. A number of brain regions have been implicated in audiovisual speech tasks, but little evidence distinguishes them functionally. In an event-related functional magnetic resonance imaging study, we differentiate neural systems that evaluate cross-modal coincidence of the physical stimuli from those that mediate perceptual binding. Regions consistently involved in perceptual fusion per se included Heschl's gyrus, superior temporal sulcus, middle intraparietal sulcus, and inferior frontal gyrus. Successful fusion elicited activity biased toward the left hemisphere, although failed cross-modal binding recruited regions in both hemispheres. A broad network of other areas, including the superior colliculus, anterior insula, and anterior intraparietal sulcus, were more involved with evaluating the spatiotemporal correspondence of speech stimuli, regardless of a subject's perception. All of these showed greater activity to temporally offset stimuli than to audiovisually synchronous stimuli. Our results demonstrate how elements of the cross-modal speech integration network differ in their sensitivity to physical reality versus perceptual experience.
Keywords: cross modal, audiovisual, multisensory, speech, binding, fMRI
Introduction
Merging information from different senses confers distinct behavioral advantages, enabling faster and more accurate discrimination than with unimodal stimuli (Hershenson, 1962; Morrell, 1968; Stein et al., 1989; Perrott et al., 1990; Hughes et al., 1994; Frens et al., 1995), especially when the signals are degraded (Sumby and Pollack, 1954; MacLeod and Summerfield, 1987; Perrott et al., 1991; Benoit et al., 1994). To realize these advantages, the brain continually coordinates sensory inputs across the audiovisual (Calvert et al., 2000; Grant and Seitz, 2000; Shams et al., 2002; Callan et al., 2003), visual-tactile (Banati et al., 2000; Macaluso et al., 2000; Stein et al., 2001), and audiosomatic (Schulz et al., 2003) domains and combines them into coherent perceptions. With speech, an instance of paramount behavioral importance, vision strongly influences auditory perception even at the basic level of the phoneme (McGurk and MacDonald, 1976). Watching a speaker's mouth movements improves comprehension, especially for normal listeners in noisy environments and for the hearing impaired (Sumby and Pollack, 1954; Grant et al., 1998; Sekiyama et al., 2003).
Although the psychophysics of cross-modal speech has a long history, relatively few studies address the neural substrates of combining auditory and visual speech information (for review, see Calvert, 2001). Nonetheless, among human imaging studies, a number of brain regions have repeatedly been implicated in cross-modal integration, particularly of speech and other audiovisual stimuli. These include high-level associative or integrative cortices such as the superior temporal sulcus (STS), intraparietal sulcus (IPS), inferior frontal gyrus (IFG), and insula, as well as subcortical or traditionally unimodal regions such as the superior colliculus (SC), the MT/V5 complex, and Heschl's gyrus (Calvert et al., 1999, 2000, 2001; Callan et al., 2001, 2003, 2004; Olson et al., 2002; Beauchamp et al., 2004; Mottonen et al., 2004; Pekkola et al., 2005). Given their repeated identification across multiple, well controlled studies, these brain areas almost certainly play some integral part in processing cross-modal speech, although their functional roles in this complex task are essentially unknown.
In this study, we identify the large-scale functional networks devoted to two separable processes during cross-modal speech integration: the sensory comparison of auditory and visual stimulus attributes and the actual perception of a unified cross-modal event. We hypothesize that distinct networks of brain regions are preferentially sensitive to each process. Event-related functional magnetic resonance imaging (fMRI) allows us to explore this basic distinction between physical and experiential aspects of a task, or between sensory correspondence and perceptual fusion. Subjects were presented with audiovisual speech in which the auditory and visual signals occurred either synchronously or offset in time, approximating real-life noisy and reverberant conditions. For each utterance, the subject indicated whether the audio and video were fused as a single perceptual event or experienced as successive in time. Stimulus properties were dissociated from perceptual experience by adjusting the audiovisual temporal offset. In this way, we could statistically assess brain activity related to the evaluation of spatiotemporal correspondence independently from brain activity related to perceptual binding.
Materials and Methods
Subjects. Seventeen healthy subjects (11 females; age, 18-33 years) gave written consent according to procedures approved by the University of California. All were right-handed, were native English speakers with self-reported normal hearing, had normal or corrected vision, and had at least 12 years of education. None of the participants had a history of neurological or psychiatric disease, nor were they using any medications during the 3 months before the experiment. As described below, all results reported are for the 11 subjects (six females) with low head motion and balanced behavioral performance.
Stimuli. Audiovisual speech stimuli were recorded in an Industrial Acoustics (Bronx, NY) anechoic chamber with a digital video camera and remote microphone. The speaker was an adult female with vocal training. Only the lower half of the speaker's face was included in the video frame, from the tip of the nose to below the chin, to avoid eliciting brain activity attributable to face identification (Fig. 1). The speaker produced six nonsense vowel-consonant-vowel (VCV) utterances with flat affect and natural prosody. The vowel was always [ ], because its formant structure provided a superior signal/noise ratio relative to the MRI scanner spectrum during functional runs. The six consonants were the stop consonants ([b],[d],[g],[p],[t],[k]), chosen for their balanced range of voicing and place of articulation cues. Audiovisual clips of the VCVs were edited in Adobe Premier. The video was truncated to 2 s, with the utterance temporally centered so the consonant stop occurred 1 s from the clip onset. The audio was truncated to 4 s, with 1 extra second before and after the video to allow for temporal offsets. Vocal speech portions lasted ∼700 ms, and the relative timing of the consonant within the utterance was similar for all VCVs. Visual speech portions lasted slightly longer, because the natural voicing of [
 ] begins just after the lips part and ends just before the lips close. Because voicing onsets and offsets of [
 ] are not visible, the temporally informative interval of each VCV was thus only around the consonant. The video portion of each clip was saved as an mpeg file (29.97 fps sampling), and the accompanying audio portion as a wav file (48 kHz sampling). Audio signals were low-pass filtered at 15 kHz and normalized to have the same root-mean-square amplitude.
Figure 1.

Cross-modal fusion task. A, Audiovisual speech stimuli were presented with the audio signal (blue oscillograms) either synchronous with or temporally offset from a video of the speaker's face (one video frame shown). In this example, the offset audio signal is shown 150 ms later than the synchronous stimuli, a delay at which most subjects perceptually fused the modalities. The vertical dashed line on the oscillograms is a visual reference to highlight the offset. B, In our event-related design, each trial is characterized by two parameters: stimulus type and subject response, here signified by a pair of colored squares. The top row of squares represents stimulus type across successive trials (green, synchronous; black, offset), and the bottom row indicates subject response for the corresponding trials (red, perceptually fused; blue, unfused). The hypothesis test for brain regions involved in sensory correspondence compares BOLD activity based on stimulus properties (i.e., synchronous - offset). The statistically orthogonal test for perceptual fusion compares, for offset stimulus trials, activity based on the subjects' response (i.e., fused - unfused).
The temporal offset of the cross-modal stimuli could be varied easily, for purposes described below. A simple manipulation of temporal offset has the advantage of being experimentally clean in that each modality is fully intact and unbiased in that it favors neither audio nor video. Rather than control cross-modal offset by presenting the same audio and video files at different times, we created a different 2 s audio file, extracted from the full 4 s clip, for every desired temporal offset. The 2 s signals were tapered at the onset and offset with a 50 ms cosine-squared envelope to prevent transient artifacts. Thus, in each audio file, the timing of the utterance varied relative to the beginning of the file. This ensured that audio and video files always began and ended synchronously, but the timing of the utterance within the audio file varied relative to the video.
Pre-fMRI behavioral session. An average of 2 d before scanning, each subject performed a behavioral session. The purpose of a prescan session was to determine an approximate temporal offset threshold for perceptual fusion. This assessment allowed us to reduce the time spent in the scanner calibrating each subject's stimulus set.
Subjects were seated in a dim anechoic chamber in a comfortable chair. Audio stimuli were presented via headphones, and video stimuli were presented on a monitor in front of the subject with the video subtending ∼8° of visual angle. Recorded scanner noise was played continuously at ∼80 dB to mimic a functional scanning session. All utterances were played with ∼6 dB signal/noise ratio. Stimulus control and recording of subject responses was performed with Presentation (Neurobehavioral Systems, Albany, CA).
Audiovisual utterances were presented with varying temporal offset. On each trial, subjects pressed a button with the left index or middle finger to indicate whether they perceived the cross-modal stimuli as fused in a single event or successive in time, respectively. They were instructed to respond as rapidly as possible. VCV stimuli were presented with a stimulus onset asynchrony (SOA) of 6 s. During the time between utterances, subjects rested their gaze on a small white fixation cross in the center of the blank screen.
The identity of the consonant in each trial varied pseudorandomly, and the cross-modal offset on each trial was determined by an adaptive algorithm based on the subject's previous responses. Specifically, trials were presented in trios with a random order within each trio, in which one trial was always cross-modally simultaneous, one was audio leading, and one was video leading. The adaptive algorithm changed the value of the temporal offsets for each offset trial type by 10 ms based on the previous response for that type. The algorithm therefore increased the offset after a “fused” response and decreased the offset after an “unfused” response. For instance, if a subject responded “fused” for an audio-lead trial, the next audio-lead trial would have an offset 10 ms longer than the last. The audio-lead and video-lead offsets started at ±10 ms and therefore increased until they converged on the offset values producing fused perceptions on 50% of trials. Thus, the stimulus trios adapted to approximate the fusion threshold (fusion on 50% of trials) for audio lead and video lead, whereas one-third of the stimuli were simultaneous. A total of 180 trials were presented in two runs of 9 min each.
fMRI scanning methods. Functional images were acquired during eight sessions lasting 499.4 s each. T2*-weighted echo-planar images (EPIs) sensitive to blood oxygenation level-dependent (BOLD) contrasts were acquired at 4 tesla with a Varian (Palo Alto, CA) INOVA MR scanner and a transverse electromagnetic send-and-receive radiofrequency head coil (MR Instruments, Minneapolis, MN) using a two-shot gradient-echo EPI sequence [22.4 × 22.4 cm field of view with a 64 × 64 matrix size, resulting in an in-plane resolution of 3.5 × 3.5 mm for each of 20 3.5 mm axial slices with a 1 mm interslice gap; repetition time, 1.1 s per one-half of k-space (2.2 s total); echo time, 28 ms; flip angle, 20°]. These spatial parameters resulted in volumes covering virtually the entire cortex. High-resolution gradient-echo multislice T1-weighted scans, coplanar with the EPIs, as well as whole-brain MP-Flash three-dimensional T1-weighted scans were acquired for anatomical localization.
All stimulus presentation was coordinated with Presentation software (Neurobehavioral Systems). Sound was delivered via MR-Confon headphones. In addition to the headphone earmuffs, subjects wore earplugs so the passively attenuated EPI sequence noise was experienced at <80 dB. Auditory stimuli were presented ∼12 dB above the scanner noise. Visual stimuli were presented with a liquid crystal display projector on a screen suspended in the scanner bore above the subject's midsection. Subjects viewed the screen via a mirror mounted inside the radiofrequency coil. The video of the lower half of the speaker's face subtended approximately eight visual degrees, a value similar during face-to-face communication. All functional runs were of a widely spaced event-related design: each trial consisted of a single utterance, and trials occurred with an SOA of 15.4, 17.6, or 19.8 s in exponentially decreasing proportions (67, 24, and 9%, respectively), with durations balanced across all conditions. An exponential distribution of SOAs does little to estimate the hemodynamic response of widely spaced trials, but it reduces the subjective predictability of trial onsets without undue loss of experimental time (Burock et al., 1998; Liu et al., 2001; Ollinger et al., 2001). During all time between stimuli was a small white fixation cross, located where the video speaker's lips would appear, on which subjects were instructed to rest their gaze.
fMRI scanning tasks. The first three functional sessions consisted of a localizer task, used to identify audiovisually responsive regions with a data set independent of the cross-modal fusion task (see Region of interest analysis). Stimuli were the VCV utterances presented in the audio modality alone, in the video modality alone, or audiovisually (simultaneous). A total of 30 trials of each type were pseudorandomly ordered across the three sessions. On each trial, the subject was instructed to indicate whether the stimulus was bimodal or unimodal (i.e., whether it was audiovisual or was only auditory or only video). The task therefore required subjects to remain alert and attend to both modalities. They responded with a button press of the left index or middle finger as quickly as possible.
After the localizer task, we calibrated the temporal offset values for audiovisual stimuli based on the subject's fusion threshold while in the noisy scanner environment. This task was performed during the 7.6 min MP-Flash anatomical scan. Fusion threshold was measured in the same adaptive way as during the prescan behavioral session, except with higher temporal offset resolution (increments of 5 ms). Moreover, to speed convergence to a subject's precise threshold, the starting values for temporal offset were the approximate thresholds determined by prescan behavior. Unlike the functional runs, stimuli were presented with a constant SOA of 6 s. This method achieved very high sampling near the precise fusion thresholds, with a total of 75 trials. The offset values obtained from this task were used as the audio-lead and video-lead values for the remainder of the subject's experiment.
In the five remaining functional sessions, subjects performed the same audiovisual fusion task as during the previous fusion threshold calibration session. The stimuli, however, did not vary in their temporal offset. Rather, only three temporal offsets were presented: synchronous, the subject's audio-lead threshold, and the subject's video-lead threshold. Therefore, the only task differences from the threshold calibration session were that the trials were widely spaced and the audio-lead and video-lead stimuli each had a single offset value. On each trial, subjects indicated whether the audio and video were fused in a single event or whether they occurred successively in time. Subjects responded as quickly as possible with a button press of the left index or middle finger. Across five sessions, a total of 50 simultaneous, 50 audio-lead, and 50 video-lead trials were presented. For the 100 offset trials, subjects perceptually fused the stimuli on approximately one-half of the trials (Fig. 1).
Data processing. Processing in k-space was performed with in-house software. EPI data from different slices were sinc-interpolated in time to correct for slice-timing skew. The data were then linearly interpolated in k-space across subsequent shots of the same order (first shot or second shot) to yield an effectively higher sampling rate, nominally twice the original. When Fourier-transformed, this yielded a total of 1362 images for the localizer task and 2270 images for the fusion task, all with a 1.1 s repetition time. The remaining data processing took place in Matlab (Mathworks, Natick, MA) using SPM2 (www.fil.ion.ucl.ac.uk/spm/spm2.html). All images for each subject were spatially realigned using a rigid-body transform to account for small movements over time. They were then normalized to the Montreal Neurological Institute (MNI) template with a 2 × 2 × 2 mm voxel size and smoothed with a 5 mm full-width at half-maximum (FWHM) Gaussian kernel. Data from two subjects were discarded because of excessive head motion in the scanner. The behavioral performance of the subjects also constrained the analysis. Despite our efforts to calibrate their fusion thresholds (see above, fMRI scanning tasks), several subjects had highly variable behavior resulting in ≤10 responses for at least one of the stimulus-response combinations: audio-lead fused, audio-lead unfused, video-lead fused, or video-lead unfused. This prevented accurate estimation of activity for the underrepresented condition(s) in four subjects. All results reported therefore are for the 11 subjects (six females) with low head motion and balanced behavioral performance.
Data were analyzed with the modified general linear model in SPM2. To model task-related activity for each condition, impulses representing event onsets were convolved with the SPM canonical hemodynamic response function and with its temporal derivative. Events for the localizer task had onsets at the beginning of the video and audio clips, whereas events for the fusion task had onsets 1.1 s later, near the stop-consonant when most of the temporal audiovisual information is present. These covariates, along with head-motion parameters as confounds, were entered into the modified general linear model. Parameter estimates reflecting the percentage of signal change relative to baseline were estimated for each covariate. Random-effects t tests across subjects were performed on contrasts of the parameters, with 5 mm FWHM smoothing of the contrast images to account for intersubject spatial variability. All hypothesis testing was performed using contrasts of the parameter estimates for the canonical covariates.
BOLD activity was compared based on the stimulus properties, regardless of the subject's perceptual experience, and based on perceptual fusion, regardless of stimulus properties (Fig. 1). Critically, these comparisons are statistically orthogonal, allowing the unbiased dissociation of effects attributable to sensory correspondence and perceptual fusion.
Region of interest analysis. Regions of interest (ROIs) were determined by a two-step process using both anatomical and functional criteria, designed to incorporate general knowledge from previous work without biasing the precise locations of study. First, broad anatomical ROIs were identified based on the literature (for review, see Calvert, 2001) as probable sites of audiovisual integration of speech: Heschl's gyrus, SC, STS, IPS, MT/V5 complex, insula, and lateral IFG. The STS and IPS have been shown to exhibit activity differences for cross-modal versus unimodal speech and/or for congruent versus incongruent cross-modal stimuli (Calvert et al., 2000, 2001; Callan et al., 2001, 2003, 2004; Olson et al., 2002; Sekiyama et al., 2003; Mottonen et al., 2004); the insula and IFG show activity differences for cross-modal compared with unimodal stimuli (Callan et al., 2003) or congruent versus incongruent speech (Calvert et al., 2000; Ojanen et al., 2005); the MT/V5 complex also increases its activity when speech is bimodal versus unimodal (Calvert et al., 1999); finally, the SC and Heschl's gyrus show involvement in cross-modal speech and related audiovisual paradigms (Calvert et al., 1999, 2000, 2001; Pekkola et al., 2005). Because of the strong lateral cortical bias for speech tasks in right-handed individuals (for review, see Geschwind, 1970), all anatomical ROIs were in the left hemisphere, except for the bilateral superior colliculi.
Regions were delimited on a normalized, high-resolution anatomical image averaged across all subjects, using sulcal and gyral morphology reported in the cross-modal literature, as follows. The Heschl's gyrus ROI included the entire mediolateral extent of the gyrus; the STS included the sulcus and both banks, from the anterior temporal pole to its terminus at the angular gyrus; the IPS included the sulcus and both banks, from the parieto-occipital juncture to the postcentral sulcus; MT/V5+ included the temporo-occipital region encompassing the posterior end of the middle temporal gyrus (Brodmann's area 19/37) (Calvert et al., 1999); the insula ROI was bounded by the circular sulcus; and the lateral IFG included the lateral aspect of the gyrus, excluding the inferior frontal sulcus.
After establishing the broad anatomical regions, highly localized functional ROIs were defined within each, as peaks of audiovisually responsive voxels during the localizer task [F test for the cross-modal condition alone, peak voxels with p < 0.01, or for insula, p < 0.05, false discovery rate (FDR)]. This additional functional criterion ensures that ROIs are involved consistently in audiovisual speech processing, rather than idiosyncratically in one particular fusion task. It thereby increases specificity in the functional role attributed to ROIs and lends generality to our conclusions. If multiple peaks were <1 cm distant, the center of mass of the suprathreshold region was used as the peak location. Each functional ROI included the peak location plus a surrounding sphere, restricted by the anatomical mask, to approximate the size of one resel in the group test (∼150 voxels of 2 × 2 × 2 mm) (Worsley et al., 1996). Group random-effects tests on contrasts from the fusion task were performed within these ROIs, with all statistical results Bonferroni corrected for multiple comparisons at p < 0.05 (two-tailed).
Whole-brain analysis. A whole-brain exploratory analysis was performed to supplement the ROI results. To facilitate comparison, the hypotheses tested were identical to the ROI analysis. However, statistical criteria for the whole-brain analysis were moderately stricter in recognition of the increased influence of multiple comparisons. We tested activity differences during the fusion task within all audiovisually responsive voxels across the entire brain, as defined by the functional localizer (F test for the cross-modal condition alone, all voxels with p < 0.01 FDR). Group random-effects tests on contrasts from the fusion task were performed with the same statistical-level threshold as for the ROI analysis (Bonferroni corrected for multiple ROIs at p < 0.05, two-tailed), but with an additional cluster-threshold of 5 voxels to reduce the impact of spatial noise.
Results
Behavioral data
Subjects varied in their tolerance for fusing temporally offset audiovisual stimuli. To calibrate the temporal offsets for the fusion task, an adaptive algorithm was used to identify for each subject the audio-lead offset and video-lead offset eliciting perceptual fusion on ∼50% of trials (mean ± SD across subjects, 51.2 ± 10% simultaneous responses). By this criterion, the audio-lead offset across subjects was -141 ± 58 ms (mean ± SD; range, -225 to 55), and the video-lead offset was 215 ± 68 ms (mean ± SD; range, 115-350) (Fig. 2). For every subject, the audio-lead offset was smaller than the video-lead offset. The magnitudes of audio-lead and video-lead threshold were correlated across subjects (correlation coefficient, 0.58), although this trend was not significant (p = 0.062). Trials with synchronous audio and video were usually perceptually fused by all subjects during the functional scans (92 ± 9%; mean ± SD).
Figure 2.

Subjects differ in temporal tolerance for cross-modal fusion of speech. Fusion thresholds, the temporal offsets eliciting perceptual fusion on 50% of trials, are plotted for each subject with two asterisks (auditory-leading visual and visual-leading auditory) connected by a horizontal line. The subject data are ordered top to bottom by the temporal span or tolerance for perceptual fusion. The curved line shows the proportion of subjects above the 50% threshold (cumulative distribution function), smoothed by the mean SD of delays during the offset-calibration task (20.0 ms).
Reaction times differed little between conditions. For the sensory correspondence comparison, reaction times showed a nonsignificant tendency to be shorter for synchronous than offset trials (as measured from the first frame of the video; mean ± SD; synchronous, 2065 ± 363 ms; offset, 2177 ± 434 ms; paired t test t10 = 2.045; p = 0.068). At the individual level, 7 of the 11 subjects showed a significant (p < 0.05) effect of sensory correspondence, all in the direction of shorter reaction times for synchronous trials. In the perceptual fusion comparison, reaction times were not significantly different between fused and unfused trials (mean ± SD; fused, 2123 ± 379 ms; unfused, 2170 ± 387 ms; paired t test t10 = 1.731; p = 0.114). Only 4 of the 11 subjects showed a significant (p < 0.05) individual effect, all in the direction of shorter reaction times for fused trials.
ROI analysis
To strengthen and constrain our hypothesis testing, functional ROIs were identified within broad anatomical areas. Eleven functional ROIs were identified as audiovisually responsive, in the manner described in Materials and Methods: Heschl's gyrus ([-50, -26, 12] MNI), SC ([-8, -30, -4] MNI), MT/V5 complex ([-36, -78, 4] MNI), middle STS ([-54, -28, -2] MNI), posterior STS ([-58, -40, 12] MNI), anterior IPS ([-38, -42, 58] MNI), middle IPS ([-22, -70, 58] MNI), posterior IPS ([-24, -58, 44] MNI), anterior insula ([-30, 22, 12] MNI), posterior insula ([-40, -6, -6] MNI), IFG ([-52, 6, 8] MNI). Within each functional ROI, BOLD activity during the fusion task was tested for sensitivity to the temporal correspondence of audiovisual stimuli and to the subjects' experience of perceptual fusion. By design, these two comparisons were statistically orthogonal, a critical requirement for dissociating the effects. Any or all regions could show one or both effects, sensory correspondence or perceptual fusion.
Three ROIs showed significant BOLD activity differences related to stimulus coincidence, regardless of the subject's response (Fig. 3). The SC, anterior insula, and anterior IPS all had less activity during trials when the audio and video signals were actually synchronous versus trials when the stimuli were temporally offset (all p < 0.05, two-tailed and corrected; SC, t = -4.539; anterior insula, t = -4.795; anterior IPS, t = -4.185). The BOLD time series averaged across all subjects give a more informative representation of the differences between conditions. In Figure 3, the green time series for each region is the group average across all audiovisually synchronous trials, and the black time series is for audiovisually offset trials. In all three regions, the response is positive for both conditions with a similar onset time. During the offset trials, however, the activity is much greater and of longer duration.
Figure 3.
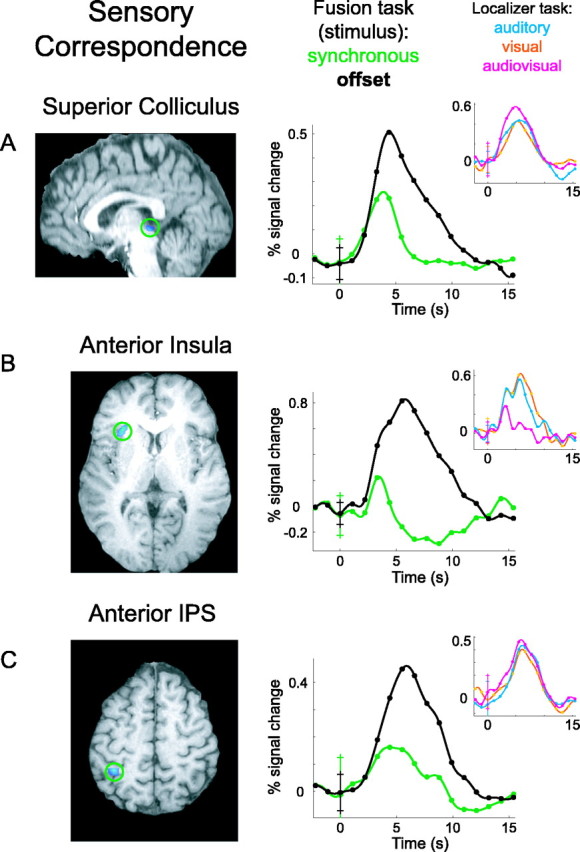
Sensory correspondence system. Brain regions with differential BOLD activity based on the temporal offset of cross-modal stimuli, regardless of perception, are shown. Group functional activations are superimposed on anatomical brain slices, with green circles highlighting the locations. A, SC activation, shown on a sagittal brain slice. The large time course plot shows BOLD activity during the fusion task, averaged across subjects for synchronous trials (green) and offset trials (black). The inset plot shows BOLD activity in the same voxels during the localizer task, for auditory-only (light blue), visual-only (orange), and audiovisual (magenta) speech stimuli. B, Anterior insula activation shown on an axial slice, with BOLD time courses. C, Anterior IPS activation on an axial slice, with BOLD time courses. All error bars in the time course plots indicate 1 SD across subjects at time 0 or trial onset. Although all hypothesis testing was corrected for multiple comparisons, an uncorrected threshold of p < 0.05 was used to display functional activations.
For trials in which the audiovisual stimuli were temporally offset, BOLD activity was contrasted by whether subjects fused the stimuli into a single event. Four ROIs showed significant activity differences based solely on successful perceptual fusion: Heschl's gyrus, middle STS, middle IPS, and IFG (Fig. 4) (all p < 0.05, two-tailed and corrected; Heschl's gyrus, t = 3.798; middle STS, t = 4.354; middle IPS, t = 3.665; IFG, t = -4.407). Notice that none of these four showed a significant effect for sensory correspondence. Again, the time series give more information than the contrast of parameter estimates alone. The time series in Figure 4 are averaged across subjects for perceptually fused trials (red) and perceptually unfused trials (blue). In Heschl's gyrus and in the STS, there is significantly greater activity for fused versus unfused trials. For both of these regions, the time series suggest a difference in degree, with similar BOLD time course shapes but moderately greater activity during fused trials. In contrast, the IPS shows increased response for fused trials and decreased response for unfused trials. IFG or Broca's area shows the opposite, with decreased response during fused and increased response during unfused perceptions.
Figure 4.
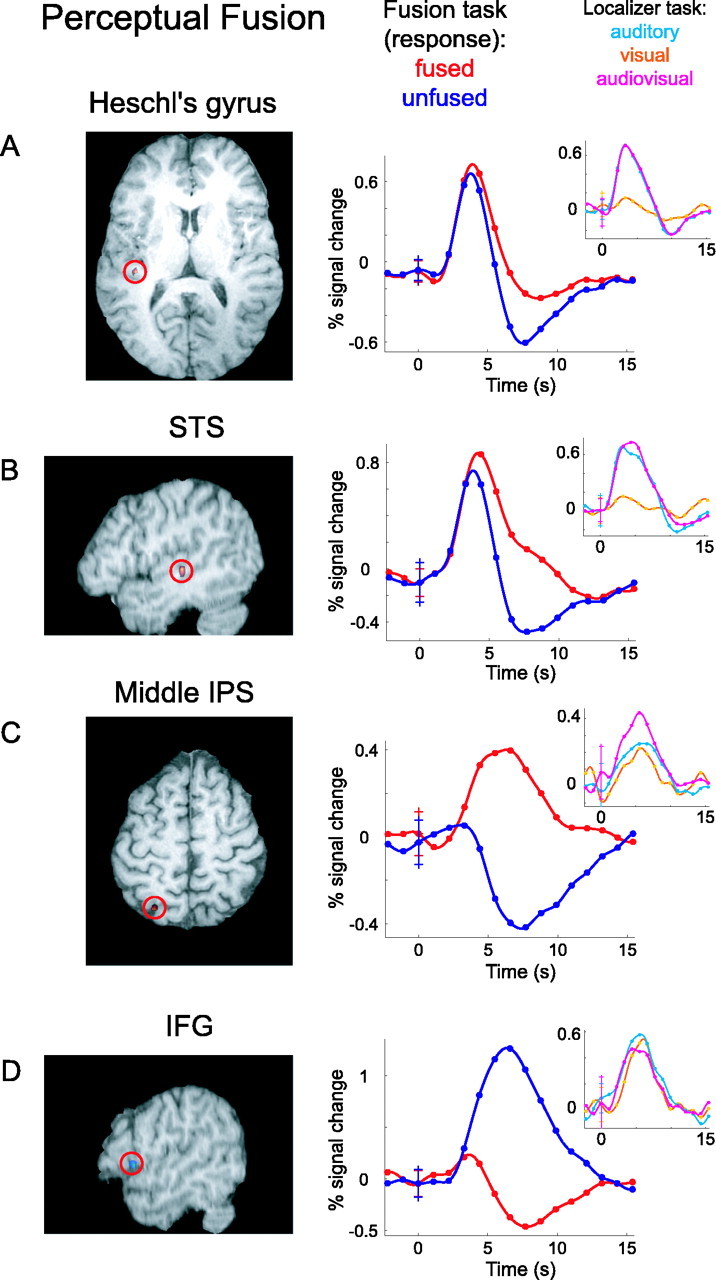
Perceptual fusion system. Brain regions with differential BOLD activity based on perceptual fusion across modalities, regardless of sensory correspondence, are shown. Group functional activations are superimposed on anatomical brain slices, with red circles highlighting the locations. A, Heschl's gyrus activation, shown on an axial brain slice. The large time course plot shows BOLD activity during the fusion task, averaged across subjects for perceptually fused trials (red) and unfused trials (blue). The inset plot shows BOLD activity in the same voxels during the localizer task, for auditory-only (light blue), visual-only (orange), and audiovisual (magenta) speech stimuli. B, Middle STS activation shown on a parasagittal slice, with BOLD time courses. C, Middle IPS activation on an axial slice, with BOLD time courses. D, IFG activation on a parasagittal slice, with BOLD time courses. All error bars in the time course plots indicate 1 SD across subjects at time 0 or trial onset. Although all hypothesis testing was corrected for multiple comparisons, an uncorrected threshold of p < 0.05 was used to display functional activations.
The localizer task used to identify functional ROIs incorporated speech stimuli in the auditory, visual, and audiovisual modalities. Although our experimental hypothesis is addressed by the fusion task, qualitative results from the localizer task can nevertheless augment our understanding of the function of each brain region. Cross-subject average BOLD time series for auditory (light blue), visual (orange), and audiovisual (magenta) speech are inset over the primary plots for the sensory correspondence and perceptual fusion areas (Figs. 3, 4, inset). All seven areas show a robust positive response to speech of any modality, except Heschl's gyrus and the STS (Fig. 4A,B), which exhibit a considerably weaker visual response. The SC (Fig. 3A) and middle IPS (Fig. 4C) are the only regions having distinctly greater response to audiovisual than to auditory or visual speech. None of the regions shows a significant superadditive effect, with a cross-modal response greater than the sum of unimodal responses (Calvert et al., 2000), although our experimental design was not optimized to identify this contrast.
The clear distinction between regions sensitive to sensory correspondence versus perceptual fusion suggests that the two functional systems may be mutually exclusive. However, it is possible that the systems overlap, with some perceptual fusion areas having robust yet nonsignificant effects of sensory correspondence, and vice versa. To examine the relative functional exclusivity of each region, BOLD time series are plotted for the nonsignificant contrast in each ROI (Fig. 5). Although hypotheses were tested using parameter estimates from the general linear model, relative differences between time series can be appreciated by plotting their ∼95% confidence intervals (2 SEs). Among the sensory correspondence regions, time series in the SC and anterior IPS show little or no sensitivity to perceptual fusion (SC, t = 0.4227, p = 0.68 uncorrected; IPS, t = -1.234, p = 0.25 uncorrected). The anterior insula shows a trend toward increased activity during unfused trials (t = -1.51; p = 0.162 uncorrected); the lack of significant effect is attributable to high intersubject variability in BOLD response rather than intrinsic noise, as evidenced by small SEs before trial onset and large SEs near the response peak. Among fusion areas, all time series from offset trials overlap those from synchronous trials, indicating a complete lack of sensitivity to sensory correspondence.
Figure 5.
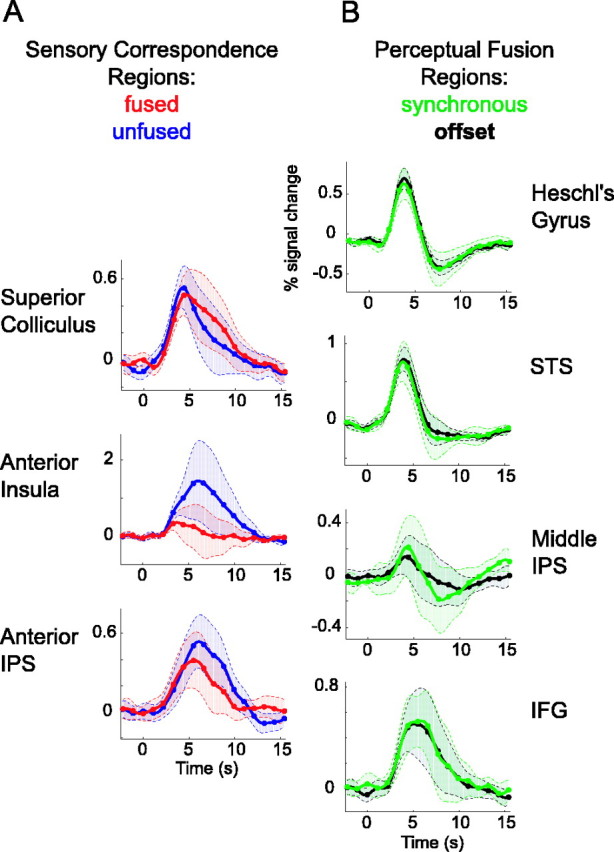
Relative functional exclusivity of sensory correspondence and perceptual fusion regions. BOLD time series are plotted for the nonsignificant contrast in each ROI. A, Time courses in sensory correspondence regions, averaged across perceptually fused trials (red) and unfused trials (blue). B, Time courses in perceptual fusion regions, averaged across subjects for synchronous trials (green) and offset trials (black). The shaded error bounds indicate 2 SEs.
Whole-brain analysis
The ROI analysis reflects our deliberate focus on regions corroborated by numerous cross-modal speech studies. However, our scanning parameters allow us to examine effects across virtually the entire brain. We therefore supplemented the ROI component with an exploratory whole-brain analysis to enhance our interpretations and guide future work. The sensory correspondence and perceptual fusion contrasts were evaluated across all audiovisually responsive voxels in the brain, with moderately stricter statistical criteria than the ROI analysis (see Materials and Methods). Results appear in Table 1 (see also supplemental material, available at www.jneurosci.org).
Table 1.
Whole-brain analysis of sensory correspondence and perceptual fusion
|
Region |
x |
y |
z |
t |
p |
|---|---|---|---|---|---|
| Perceptual fusion: fused > unfused | |||||
| Left Heschl's gyrus | −40 | −32 | 8 | 5.94 | 0.0016 |
| Left STS | −46 | −28 | 0 | 5.12 | 0.0050 |
| Perceptual fusion: unfused > fused | |||||
| Right STS | 48 | −42 | 10 | 4.32 | 0.0166 |
| Right medial superior frontal gyrus (supplementary motor area) | 4 | −4 | 54 | 4.62 | 0.0105 |
| Sensory correspondence: synchronous > offset (None) | |||||
| Sensory correspondence: offset > synchronous SC | 0 | −30 | −8 | 4.89 | 0.0070 |
| Left intraparietal sulcus | −38 | −46 | 56 | 4.16 | 0.0214 |
| Left intraparietal sulcus/postcentral sulcus | −48 | −30 | 48 | 4.07 | 0.0248 |
| Right supramarginal gyrus | 36 | −48 | 36 | 3.92 | 0.0315 |
| 52 | −38 | 42 | 6.16 | 0.0012 | |
| Left middle frontal gyrus | −26 | 44 | 30 | 6.21 | 0.0011 |
| −34 | 44 | 16 | 4.34 | 0.0161 | |
| Right medial temporal lobe | 22 | −20 | −8 | 5.12 | 0.0050 |
| Right precentral sulcus | 44 | 8 | 20 | 7.07 | 0.0004 |
| Right superior frontal sulcus | 14 | 2 | 66 | 5.02 | 0.0057 |
| Right inferior frontal sulcus | 30 | 18 | 26 | 4.29 | 0.0174 |
| Left anterior cingulate gyrus | −2 | 6 | 36 | 4.27 | 0.0180 |
| Anterior cingulate sulcus (bilateral) |
2 |
24 |
48 |
4.95 |
0.0064 |
Peak coordinates are in millimeters in MNI space. Positive t values are presented for each side of a contrast, with p values two-tailed and corrected as described in Materials and Methods. See supplemental material (available at www.jneurosci.org).
The left STS and left Heschl's gyrus show increased activity with perceptual fusion. When perceptual fusion failed, greater activity occurred in the right STS and the right medial wall, caudal to the vertical line through the anterior commissure and dorsal to the cingulate sulcus (presumed supplementary motor area) (Picard and Strick, 2001). Regions showing increased activity during temporally offset stimuli include the sensory correspondence ROIs, the SC and left anterior IPS, as well the right supramarginal gyrus, anterior cingulate cortex, and several prefrontal areas bilaterally. In regions where the whole-brain analysis corroborated the ROIs (left Heschl's gyrus, left STS, left anterior IPS, SC), the distance between whole-brain statistical peaks and centers of the ROIs was on the order of a spatial smoothing kernel (mean, 8.5 mm; compared with a total-subject- and group-level smoothing of 7.1 mm). Because the whole-brain analysis tests a much larger volume of tissue, this close correspondence affirms that our method for choosing functional ROIs was relatively precise and unbiased.
Discussion
This study distinguishes the large-scale functional networks devoted to evaluating sensory correspondence and to achieving perceptual fusion during cross-modal speech integration. Subnetworks mediating these two experimentally separable functions were found, on the whole, to be mutually exclusive.
Behavior
Our behavioral results corroborate previous psychophysical reports on audiovisual integration of speech, particularly the well known asymmetry of perceptual tolerance for audio-lead versus video-lead offsets (Dixon and Spitz, 1980; McGrath and Summerfield, 1985; Munhall et al., 1996; Grant and Greenberg, 2001). One remarkable aspect of the results, usually not emphasized, is the large inter-subject variability in perceptual tolerance. If we had not adjusted the stimulus offsets for each individual in the scanner, virtually all trials of a given temporal offset would have been perceived as fused or as unfused. There would never have occurred the balanced behavior for a given offset on which our experimental design depended. Consequently, it would have been impossible to dissociate stimulus attributes from perception.
Sensory correspondence network
Three regions were found to be sensitive to the temporal offset of audiovisual stimuli, regardless of perceptual attribution: SC, anterior IPS, and insula. Qualitatively, the BOLD time series in each of the regions had not only greater magnitude but also longer duration for offset stimuli. This suggests that more neural activity or activity of longer duration may be required when the spatiotemporal operation is more demanding (Georgopoulos et al., 1989; Richter et al., 2000; Formisano et al., 2002). At least in the SC, neural activity tends to be greater with congruent cross-modal stimuli (Stein et al., 2002). Therefore, the observed increase in BOLD signal for offset stimuli may reflect a longer duration of lower-level neural activity. Alternately, it may reflect processing differences from previous studies attributable to task (temporal judgment vs orienting), stimuli (spectrotemporally complex vs primitive), or cortical involvement (Stein et al., 2002).
The participation of these three regions in evaluating spatiotemporal correspondence across modalities is supported by their anatomical connectivity as well as by previous functional studies. The SC, for instance, is one of earliest brain regions where auditory and visual information converge anatomically on the same structure, within spatiotopic maps aligned across modalities (Stein et al., 2001). IPS, a high-level association area (Pandya and Yeterian, 1985), has strong anatomical connections with the SC and is one of several cortical regions with close functional relationships to the SC (Jiang et al., 2002; Stein et al., 2002; Gaymard et al., 2003). Moreover, neighboring regions in the superior parietal lobule have been shown to be sensitive to spatiotemporally incongruent speech (Ojanen et al., 2005). Finally, the insula is a functionally heterogeneous cortical area with early cross-modal input from both cortical and thalamic sources (for review, see Bamiou et al., 2003). Among its many reported functions, the insula has been implicated in cross-modal tasks in which timing is a relevant parameter (Bushara et al., 2001, 2003) in decisions about auditory objects (Binder et al., 2004) and as an essential cortical area for speech articulation (Dronkers, 1996).
Perceptual fusion network
Four regions showed sensitivity to perceptual audiovisual fusion, regardless of the spatiotemporal correspondence of the stimuli across modalities: Heschl's gyrus, middle STS, middle IPS, and IFG.
The STS and IPS are both anatomically well placed to serve a role in audiovisual binding, because they are high-level association cortices with massive cross-modal convergence (Pandya and Yeterian, 1985). Functionally, the STS has a great number of roles, including processing biological motion (Puce and Perrett, 2003) and, especially anteriorly, intelligible speech (Binder et al., 2000; Scott et al., 2000; Belin et al., 2002; Davis and Johnsrude, 2003; Giraud et al., 2004). Its involvement has been observed in virtually all human studies of cross-modal speech integration, particularly when modalities are temporally concordant (Macaluso et al., 2004). The intraparietal region is also functionally well suited for cross-modal integration of speech, as suggested by its involvement in polymodal motion processing (Bremmer et al., 2001), decisions regarding visual motion (Shadlen and Newsome, 1996, 2001; Ditterich et al., 2003; Williams et al., 2003), and coordinate transformations not limited to the visuospatial domain (Andersen and Buneo, 2002). This is consistent with the suggestion that parietal regions serve as a sensory-motor interface (Goodale and Milner, 1992); however, the IPS is rather distant from the postulated motor interface for auditory-only speech at the temporoparietal junction (Wise et al., 2001; Hickok et al., 2003; Hickok and Poeppel, 2004).
Heschl's gyrus is the lowest-level cortical region showing a perceptual effect in this study. Although the early auditory cortex may lack direct inputs from early visual areas, it is, however, strongly and reciprocally connected with the lateral superior temporal gyrus/STS (Pandya and Yeterian, 1985; Kaas and Hackett, 2000). One might speculate that its perception-related effects could be mediated by the ample feedback from the STS. Additional evidence for the involvement of early cortical regions in cross-modal fusion of speech comes from neuroimaging (Calvert et al., 1999; Pekkola et al., 2005) and from psychophysical and electrophysiological studies suggesting that cross-modal integration occurs early in the sensory-perceptual continuum (McGurk and MacDonald, 1976; Giard and Peronnet, 1999; Klucharev et al., 2003; Mottonen et al., 2004).
Activity in the IFG, as with the IPS, suggests a categorical difference based on the perceptual distinction between fused and unfused speech. The IFG is traditionally associated with motor aspects of speech, especially with their interruption in Broca's aphasia (Broca, 1861). The IFG has also been implicated, however, in a variety of perceptual speech tasks, including those that are phonetically demanding and require precise temporal parsing or sequencing of the speech signal (Demonet et al., 1992; Zatorre et al., 1996; Poldrack et al., 1999). Such speech functions of the IFG may reflect a more general process to resolve conflicting or noisy representations (D'Esposito et al., 1999; Ojanen et al., 2005), supported by the strong direct anatomical connections between prefrontal and auditory temporal regions (Romanski et al., 1999). A compatible and theoretically attractive extension to this idea would present Broca's area as a “mirror neuron” system homologous to macaque F5 (Rizzolatti et al., 1996; Rizzolatti and Arbib, 1998). Internal articulatory models could thus provide an efficient perceptual template or filter (Liberman and Mattingly, 1985; Nishitani and Hari, 2002; Ferrari et al., 2003), especially in a noisy background with visual cues. Although speculative, the pattern of BOLD changes is consistent with a shunting of neural activity from the posterior cortex to the frontal cortex when fusion fails (Shmuel et al., 2002): reduction from a task-determined tonic firing state in the IPS and consequent increase in the IFG, reflecting the shift from automatic spatiotemporal matching to more effortful, controlled processing.
Whole-brain analysis
The whole-brain results generally corroborate the ROI analysis, while complementing and extending our interpretations. Although a few ROIs fail to achieve significance in the whole-brain analysis because of more stringent statistical criteria, many appear as the strongest or the only regions responsive to a given contrast. For instance, increased activity with perceptual fusion is seen only in the left STS and left Heschl's gyrus. Increased activity during temporally offset stimuli occurs in the sensory correspondence ROIs, the SC and left anterior IPS. The whole-brain analysis, however, highlights a number of additional regions, all of which show greater activity when perceptual fusion fails or when the stimuli are temporally offset. Some areas have been observed in previous cross-modal studies, such as the right STS (Calvert et al., 2000; Mottonen et al., 2004), which could play a role supportive of or parallel to its homolog in the speech-dominant hemisphere (Belin et al., 1998; Boemio et al., 2005). Other regions have been reported, but less frequently and without great spatial consistency across studies; these may be recruited by experimental aspects unique to our paradigm. For instance, the anterior cingulate and dorsolateral prefrontal cortices may be especially involved in our study because the temporal ambiguity of stimuli invokes conflict monitoring and control (Kerns et al., 2004).
Future directions
The present report adds a critical functional specificity to our understanding of audiovisual integration and suggests a number of testable hypotheses. One speculative yet plausible model of cross-modal speech perception might take the following form. The middle STS is the core of the perceptual fusion network, a region where auditory and visual modalities are first combined for the purposes of identification. The intelligible speech pathway starts here and progresses anteriorly along the STS/superior temporal gyrus (Binder et al., 2000; Scott et al., 2000; Belin et al., 2002; Davis and Johnsrude, 2003). Visually informed feedback from the STS to the early auditory cortex favorably biases the auditory input to the STS (Pandya and Yeterian, 1985). In the case of imperfect correspondence of auditory and visual signals, the IPS is recruited by the STS to effect spatiotemporal transformations (Andersen, 1997) and accumulate evidence toward achieving a match. Broca's area would then be recruited only in instances in which greater effort is required (Giraud et al., 2004; Ojanen et al., 2005) to parse the speech into intelligible components (Zatorre et al., 1996); this may even be by engaging articulatory processes to mirror the sensory input (Rizzolatti and Arbib, 1998). Sensory correspondence areas, alternately, would provide input to the perceptual fusion network. It is important to point out that the logic of this model applies equally if subjects were to have performed a speech-identification task, in which case we may expect greater involvement of the posterior middle temporal and anterior superior temporal regions. The model may also extend to complex nonspeech audiovisual objects. Our data set cannot speak to this point, but we would expect an overlapping pattern of activity for nonspeech events, the primary modality of which is auditory, especially those involving biological motion.
Conclusion
This study refines our functional understanding of an ecologically critical process, the cross-modal integration of speech, and provides an accessible example of the sensation-perception continuum. We show that unique neural subsystems mediate the distinction observed behaviorally between sensory correspondence and perceptual fusion, a neural acknowledgment of the fundamental schism between reality and experience.
Footnotes
This work was supported by a grant from the National Institutes of Health-National Institute on Deafness and Other Communication Disorders. We thank Ben Inglis for technical assistance with the scanner.
Correspondence should be addressed to Dr. Lee M. Miller, Section of Neurobiology, Physiology, and Behavior, University of California, One Shields Avenue, Davis, CA 95616. E-mail: leemiller@ucdavis.edu.
Copyright © 2005 Society for Neuroscience 0270-6474/05/255884-10$15.00/0
References
- Andersen RA (1997) Multimodal integration for the representation of space in the posterior parietal cortex. Philos Trans R Soc Lond B Biol Sci 352: 1421-1428. [DOI] [PMC free article] [PubMed] [Google Scholar]
- Andersen RA, Buneo CA (2002) Intentional maps in posterior parietal cortex. Annu Rev Neurosci 25: 189-220. [DOI] [PubMed] [Google Scholar]
- Bamiou DE, Musiek FE, Luxon LM (2003) The insula (Island of Reil) and its role in auditory processing. Literature review. Brain Res Brain Res Rev 42: 143-154. [DOI] [PubMed] [Google Scholar]
- Banati RB, Goerres GW, Tjoa C, Aggleton JP, Grasby P (2000) The functional anatomy of visual-tactile integration in man: a study using positron emission tomography. Neuropsychologia 38: 115-124. [DOI] [PubMed] [Google Scholar]
- Beauchamp MS, Argall BD, Bodurka J, Duyn JH, Martin A (2004) Unraveling multisensory integration: patchy organization within human STS multisensory cortex. Nat Neurosci 7: 1190-1192. [DOI] [PubMed] [Google Scholar]
- Belin P, Zilbovicius M, Crozier S, Thivard L, Fontaine A, Masure MC, Samson Y (1998) Lateralization of speech and auditory temporal processing. J Cogn Neurosci 10: 536-540. [DOI] [PubMed] [Google Scholar]
- Belin P, Zatorre RJ, Ahad P (2002) Human temporal-lobe response to vocal sounds. Brain Res Cogn Brain Res 13: 17-26. [DOI] [PubMed] [Google Scholar]
- Benoit C, Mohamadi T, Kandel S (1994) Effects of phonetic context on audio-visual intelligibility of French. J Speech Hear Res 37: 1195-1203. [DOI] [PubMed] [Google Scholar]
- Binder JR, Frost JA, Hammeke TA, Bellgowan PS, Springer JA, Kaufman JN, Possing ET (2000) Human temporal lobe activation by speech and nonspeech sounds. Cereb Cortex 10: 512-528. [DOI] [PubMed] [Google Scholar]
- Binder JR, Liebenthal E, Possing ET, Medler DA, Ward BD (2004) Neural correlates of sensory and decision processes in auditory object identification. Nat Neurosci 7: 295-301. [DOI] [PubMed] [Google Scholar]
- Boemio A, Fromm S, Braun A, Poeppel D (2005) Hierarchical and asymmetric temporal sensitivity in human auditory cortices. Nat Neurosci 8: 389-395. [DOI] [PubMed] [Google Scholar]
- Bremmer F, Schlack A, Shah NJ, Zafiris O, Kubischik M, Hoffmann K, Zilles K, Fink GR (2001) Polymodal motion processing in posterior parietal and premotor cortex: a human fMRI study strongly implies equivalencies between humans and monkeys. Neuron 29: 287-296. [DOI] [PubMed] [Google Scholar]
- Broca P (1861) Perte de la parole, remollissement chronique et destruction partielle du lobe anterieur gauche du cerveau. Bull Soc Anthropol 2: 235-238. [Google Scholar]
- Burock MA, Buckner RL, Woldorff MG, Rosen BR, Dale AM (1998) Randomized event-related experimental designs allow for extremely rapid presentation rates using functional MRI. NeuroReport 9: 3735-3739. [DOI] [PubMed] [Google Scholar]
- Bushara KO, Grafman J, Hallett M (2001) Neural correlates of auditory-visual stimulus onset asynchrony detection. J Neurosci 21: 300-304. [DOI] [PMC free article] [PubMed] [Google Scholar]
- Bushara KO, Hanakawa T, Immisch I, Toma K, Kansaku K, Hallett M (2003) Neural correlates of cross-modal binding. Nat Neurosci 6: 190-195. [DOI] [PubMed] [Google Scholar]
- Callan DE, Callan AM, Kroos C, Vatikiotis-Bateson E (2001) Multimodal contribution to speech perception revealed by independent component analysis: a single-sweep EEG case study. Brain Res Cogn Brain Res 10: 349-353. [DOI] [PubMed] [Google Scholar]
- Callan DE, Jones JA, Munhall K, Callan AM, Kroos C, Vatikiotis-Bateson E (2003) Neural processes underlying perceptual enhancement by visual speech gestures. NeuroReport 14: 2213-2218. [DOI] [PubMed] [Google Scholar]
- Callan DE, Jones JA, Munhall K, Kroos C, Callan AM, Vatikiotis-Bateson E (2004) Multisensory integration sites identified by perception of spatial wavelet filtered visual speech gesture information. J Cogn Neurosci 16: 805-816. [DOI] [PubMed] [Google Scholar]
- Calvert GA (2001) Crossmodal processing in the human brain: insights from functional neuroimaging studies. Cereb Cortex 11: 1110-1123. [DOI] [PubMed] [Google Scholar]
- Calvert GA, Brammer MJ, Bullmore ET, Campbell R, Iversen SD, David AS (1999) Response amplification in sensory-specific cortices during crossmodal binding. NeuroReport 10: 2619-2623. [DOI] [PubMed] [Google Scholar]
- Calvert GA, Campbell R, Brammer MJ (2000) Evidence from functional magnetic resonance imaging of crossmodal binding in the human heteromodal cortex. Curr Biol 10: 649-657. [DOI] [PubMed] [Google Scholar]
- Calvert GA, Hansen PC, Iversen SD, Brammer MJ (2001) Detection of audio-visual integration sites in humans by application of electrophysiological criteria to the BOLD effect. NeuroImage 14: 427-438. [DOI] [PubMed] [Google Scholar]
- Davis MH, Johnsrude IS (2003) Hierarchical processing in spoken language comprehension. J Neurosci 23: 3423-3431. [DOI] [PMC free article] [PubMed] [Google Scholar]
- Demonet JF, Chollet F, Ramsay S, Cardebat D, Nespoulous JL, Wise R, Rascol A, Frackowiak R (1992) The anatomy of phonological and semantic processing in normal subjects. Brain 115: 1753-1768. [DOI] [PubMed] [Google Scholar]
- D'Esposito M, Postle BR, Jonides J, Smith EE (1999) The neural substrate and temporal dynamics of interference effects in working memory as revealed by event-related functional MRI. Proc Natl Acad Sci USA 96: 7514-7519. [DOI] [PMC free article] [PubMed] [Google Scholar]
- Ditterich J, Mazurek ME, Shadlen MN (2003) Microstimulation of visual cortex affects the speed of perceptual decisions. Nat Neurosci 6: 891-898. [DOI] [PubMed] [Google Scholar]
- Dixon NF, Spitz L (1980) The detection of auditory visual desynchrony. Perception 9: 719-721. [DOI] [PubMed] [Google Scholar]
- Dronkers NF (1996) A new brain region for coordinating speech articulation. Nature 384: 159-161. [DOI] [PubMed] [Google Scholar]
- Ferrari PF, Gallese V, Rizzolatti G, Fogassi L (2003) Mirror neurons responding to the observation of ingestive and communicative mouth actions in the monkey ventral premotor cortex. Eur J Neurosci 17: 1703-1714. [DOI] [PubMed] [Google Scholar]
- Formisano E, Linden DE, Di Salle F, Trojano L, Esposito F, Sack AT, Grossi D, Zanella FE, Goebel R (2002) Tracking the mind's image in the brain I: time-resolved fMRI during visuospatial mental imagery. Neuron 35: 185-194. [DOI] [PubMed] [Google Scholar]
- Frens MA, Van Opstal AJ, Van der Willigen RF (1995) Spatial and temporal factors determine auditory-visual interactions in human saccadic eye movements. Percept Psychophys 57: 802-816. [DOI] [PubMed] [Google Scholar]
- Gaymard B, Lynch J, Ploner CJ, Condy C, Rivaud-Pechoux S (2003) The parieto-collicular pathway: anatomical location and contribution to saccade generation. Eur J Neurosci 17: 1518-1526. [DOI] [PubMed] [Google Scholar]
- Georgopoulos AP, Lurito JT, Petrides M, Schwartz AB, Massey JT (1989) Mental rotation of the neuronal population vector. Science 243: 234-236. [DOI] [PubMed] [Google Scholar]
- Geschwind N (1970) The organization of language and the brain. Science 170: 940-944. [DOI] [PubMed] [Google Scholar]
- Giard MH, Peronnet F (1999) Auditory-visual integration during multimodal object recognition in humans: a behavioral and electrophysiological study. J Cogn Neurosci 11: 473-490. [DOI] [PubMed] [Google Scholar]
- Giraud AL, Kell C, Thierfelder C, Sterzer P, Russ MO, Preibisch C, Kleinschmidt A (2004) Contributions of sensory input, auditory search and verbal comprehension to cortical activity during speech processing. Cereb Cortex 14: 247-255. [DOI] [PubMed] [Google Scholar]
- Goodale MA, Milner AD (1992) Separate visual pathways for perception and action. Trends Neurosci 15: 20-25. [DOI] [PubMed] [Google Scholar]
- Grant KW, Greenberg S (2001) Speech intelligibility derived from asynchronous processing of auditory-visual information. In: Proceedings of the International Conference on Auditory-Visual Speech Processing, pp 132-137. Santa Cruz, CA: Perceptual Science Laboratory.
- Grant KW, Seitz PF (2000) The use of visible speech cues for improving auditory detection of spoken sentences. J Acoust Soc Am 108: 1197-1208. [DOI] [PubMed] [Google Scholar]
- Grant KW, Walden BE, Seitz PF (1998) Auditory-visual speech recognition by hearing-impaired subjects: consonant recognition, sentence recognition, and auditory-visual integration. J Acoust Soc Am 103: 2677-2690. [DOI] [PubMed] [Google Scholar]
- Hershenson M (1962) Reaction time as a measure of intersensory facilitation. J Exp Psychol 63: 289-293. [DOI] [PubMed] [Google Scholar]
- Hickok G, Poeppel D (2004) Dorsal and ventral streams: a framework for understanding aspects of the functional anatomy of language. Cognition 92: 67-99. [DOI] [PubMed] [Google Scholar]
- Hickok G, Buchsbaum B, Humphries C, Muftuler T (2003) Auditory-motor interaction revealed by fMRI: speech, music, and working memory in area Spt. J Cogn Neurosci 15: 673-682. [DOI] [PubMed] [Google Scholar]
- Hughes HC, Reuter-Lorenz PA, Nozawa G, Fendrich R (1994) Visual-auditory interactions in sensorimotor processing: saccades versus manual responses. J Exp Psychol Hum Percept Perform 20: 131-153. [DOI] [PubMed] [Google Scholar]
- Jiang W, Jiang H, Stein BE (2002) Two corticotectal areas facilitate multisensory orientation behavior. J Cogn Neurosci 14: 1240-1255. [DOI] [PubMed] [Google Scholar]
- Kaas JH, Hackett TA (2000) Subdivisions of auditory cortex and processing streams in primates. Proc Natl Acad Sci USA 97: 11793-11799. [DOI] [PMC free article] [PubMed] [Google Scholar]
- Kerns JG, Cohen JD, MacDonald III AW, Cho RY, Stenger VA, Carter CS (2004) Anterior cingulate conflict monitoring and adjustments in control. Science 303: 1023-1026. [DOI] [PubMed] [Google Scholar]
- Klucharev V, Mottonen R, Sams M (2003) Electrophysiological indicators of phonetic and non-phonetic multisensory interactions during audiovisual speech perception. Brain Res Cogn Brain Res 18: 65-75. [DOI] [PubMed] [Google Scholar]
- Liberman AM, Mattingly IG (1985) The motor theory of speech perception revised. Cognition 21: 1-36. [DOI] [PubMed] [Google Scholar]
- Liu TT, Frank LR, Wong EC, Buxton RB (2001) Detection power, estimation efficiency, and predictability in event-related fMRI. NeuroImage 13: 759-773. [DOI] [PubMed] [Google Scholar]
- Macaluso E, Frith CD, Driver J (2000) Modulation of human visual cortex by crossmodal spatial attention. Science 289: 1206-1208. [DOI] [PubMed] [Google Scholar]
- Macaluso E, George N, Dolan R, Spence C, Driver J (2004) Spatial and temporal factors during processing of audiovisual speech: a PET study. NeuroImage 21: 725-732. [DOI] [PubMed] [Google Scholar]
- MacLeod A, Summerfield Q (1987) Quantifying the contribution of vision to speech perception in noise. Br J Audiol 21: 131-141. [DOI] [PubMed] [Google Scholar]
- McGrath M, Summerfield Q (1985) Intermodal timing relations and audio-visual speech recognition by normal-hearing adults. J Acoust Soc Am 77: 678-685. [DOI] [PubMed] [Google Scholar]
- McGurk H, MacDonald J (1976) Hearing lips and seeing voices. Nature 264: 746-748. [DOI] [PubMed] [Google Scholar]
- Morrell LK (1968) Temporal characteristics of sensory interaction in choice reaction times. J Exp Psychol 77: 14-18. [DOI] [PubMed] [Google Scholar]
- Mottonen R, Schurmann M, Sams M (2004) Time course of multisensory interactions during audiovisual speech perception in humans: a magnetoencephalographic study. Neurosci Lett 363: 112-115. [DOI] [PubMed] [Google Scholar]
- Munhall KG, Gribble P, Sacco L, Ward M (1996) Temporal constraints on the McGurk effect. Percept Psychophys 58: 351-362. [DOI] [PubMed] [Google Scholar]
- Nishitani N, Hari R (2002) Viewing lip forms: cortical dynamics. Neuron 36: 1211-1220. [DOI] [PubMed] [Google Scholar]
- Ojanen V, Mottonen R, Pekkola J, Jaaskelainen IP, Joensuu R, Autti T, Sams M (2005) Processing of audiovisual speech in Broca's area. NeuroImage 25: 333-338. [DOI] [PubMed] [Google Scholar]
- Ollinger JM, Shulman GL, Corbetta M (2001) Separating processes within a trial in event-related functional MRI. NeuroImage 13: 210-217. [DOI] [PubMed] [Google Scholar]
- Olson IR, Gatenby JC, Gore JC (2002) A comparison of bound and unbound audio-visual information processing in the human cerebral cortex. Brain Res Cogn Brain Res 14: 129-138. [DOI] [PubMed] [Google Scholar]
- Pandya DN, Yeterian EH (1985) Architecture and connections of cortical association areas. In: Cerebral cortex (Peters A, Jones EG, eds), pp 3-61. New York: Plenum.
- Pekkola J, Ojanen V, Autti T, Jaaskelainen IP, Mottonen R, Tarkiainen A, Sams M (2005) Primary auditory cortex activation by visual speech: an fMRI study at 3 T. NeuroReport 16: 125-128. [DOI] [PubMed] [Google Scholar]
- Perrott DR, Saberi K, Brown K, Strybel TZ (1990) Auditory psychomotor coordination and visual search performance. Percept Psychophys 48: 214-226. [DOI] [PubMed] [Google Scholar]
- Perrott DR, Sadralodabai T, Saberi K, Strybel TZ (1991) Aurally aided visual search in the central visual field: effects of visual load and visual enhancement of the target. Hum Factors 33: 389-400. [DOI] [PubMed] [Google Scholar]
- Picard N, Strick PL (2001) Imaging the premotor areas. Curr Opin Neurobiol 11: 663-672. [DOI] [PubMed] [Google Scholar]
- Poldrack RA, Wagner AD, Prull MW, Desmond JE, Glover GH, Gabrieli JD (1999) Functional specialization for semantic and phonological processing in the left inferior prefrontal cortex. NeuroImage 10: 15-35. [DOI] [PubMed] [Google Scholar]
- Puce A, Perrett D (2003) Electrophysiology and brain imaging of biological motion. Philos Trans R Soc Lond B Biol Sci 358: 435-445. [DOI] [PMC free article] [PubMed] [Google Scholar]
- Richter W, Somorjai R, Summers R, Jarmasz M, Menon RS, Gati JS, Georgopoulos AP, Tegeler C, Ugurbil K, Kim SG (2000) Motor area activity during mental rotation studied by time-resolved single-trial fMRI. J Cogn Neurosci 12: 310-320. [DOI] [PubMed] [Google Scholar]
- Rizzolatti G, Arbib MA (1998) Language within our grasp. Trends Neurosci 21: 188-194. [DOI] [PubMed] [Google Scholar]
- Rizzolatti G, Fadiga L, Gallese V, Fogassi L (1996) Premotor cortex and the recognition of motor actions. Brain Res Cogn Brain Res 3: 131-141. [DOI] [PubMed] [Google Scholar]
- Romanski LM, Bates JF, Goldman-Rakic PS (1999) Auditory belt and parabelt projections to the prefrontal cortex in the rhesus monkey. J Comp Neurol 403: 141-157. [DOI] [PubMed] [Google Scholar]
- Schulz M, Ross B, Pantev C (2003) Evidence for training-induced crossmodal reorganization of cortical functions in trumpet players. NeuroReport 14: 157-161. [DOI] [PubMed] [Google Scholar]
- Scott SK, Blank CC, Rosen S, Wise RJ (2000) Identification of a pathway for intelligible speech in the left temporal lobe. Brain 123: 2400-2406. [DOI] [PMC free article] [PubMed] [Google Scholar]
- Sekiyama K, Kanno I, Miura S, Sugita Y (2003) Auditory-visual speech perception examined by fMRI and PET. Neurosci Res 47: 277-287. [DOI] [PubMed] [Google Scholar]
- Shadlen MN, Newsome WT (1996) Motion perception: seeing and deciding. Proc Natl Acad Sci USA 93: 628-633. [DOI] [PMC free article] [PubMed] [Google Scholar]
- Shadlen MN, Newsome WT (2001) Neural basis of a perceptual decision in the parietal cortex (area LIP) of the rhesus monkey. J Neurophysiol 86: 1916-1936. [DOI] [PubMed] [Google Scholar]
- Shams L, Kamitani Y, Shimojo S (2002) Visual illusion induced by sound. Brain Res Cogn Brain Res 14: 147-152. [DOI] [PubMed] [Google Scholar]
- Shmuel A, Yacoub E, Pfeuffer J, Van de Moortele PF, Adriany G, Hu X, Ugurbil K (2002) Sustained negative BOLD, blood flow and oxygen consumption response and its coupling to the positive response in the human brain. Neuron 36: 1195-1210. [DOI] [PubMed] [Google Scholar]
- Stein BE, Meredith MA, Huneycutt WS, McDade L (1989) Behavioural indices of multisensory integration: orientation to visual cues is affected by auditory stimuli. J Cogn Neurosci 1: 12-24. [DOI] [PubMed] [Google Scholar]
- Stein BE, Jiang W, Wallace MT, Stanford TR (2001) Nonvisual influences on visual-information processing in the superior colliculus. Prog Brain Res 134: 143-156. [DOI] [PubMed] [Google Scholar]
- Stein BE, Wallace MW, Stanford TR, Jiang W (2002) Cortex governs multisensory integration in the midbrain. The Neuroscientist 8: 306-314. [DOI] [PubMed] [Google Scholar]
- Sumby WH, Pollack I (1954) Visual contribution to speech intelligibility in noise. J Acoust Soc Am 26: 212-215. [Google Scholar]
- Williams ZM, Elfar JC, Eskandar EN, Toth LJ, Assad JA (2003) Parietal activity and the perceived direction of ambiguous apparent motion. Nat Neurosci 6: 616-623. [DOI] [PubMed] [Google Scholar]
- Wise RJ, Scott SK, Blank SC, Mummery CJ, Murphy K, Warburton EA (2001) Separate neural subsystems within “Wernicke's area.” Brain 124: 83-95. [DOI] [PubMed] [Google Scholar]
- Worsley KJ, Marrett S, Neelin P, Vandal AC, Friston KJ, Evans AC (1996) A unified statistical approach for determining significant signals in images of cerebral activation. Hum Brain Mapp 4: 58-73. [DOI] [PubMed] [Google Scholar]
- Zatorre RJ, Meyer E, Gjedde A, Evans AC (1996) PET studies of phonetic processing of speech: review, replication, and reanalysis. Cereb Cortex 6: 21-30. [DOI] [PubMed] [Google Scholar]