

Abstract
In the adult olfactory bulb (OB), particular chemical classes of odorants preferentially activate glomeruli within loosely defined regions, resulting in a coarse and fractured “chemotopic” map. In zebrafish, amino acids and bile acids predominantly stimulate glomeruli in the lateral and medial OB, respectively. We studied the development of these spatial response maps in zebrafish. At 3 d postfertilization (dpf), the OB contained protoglomerular structures that became refined and more numerous during subsequent days. In a transgenic zebrafish line expressing the Ca2+ indicator protein inverse pericam, mainly in mitral cells, odor responses in the OB were first detected at 2.5-3 dpf. Already at this stage, amino acids and bile acids evoked activity predominantly in the lateral and medial OB, respectively. Two-photon Ca2+ imaging using a synthetic indicator was used to reconstruct activity patterns at higher resolution in three dimensions. Responses to amino acids and bile acids were detected predominantly in the lateral and medial OB, respectively, with little overlap. Between 2.5 and 6 dpf, the number of odor-responsive units increased, but the overall spatial organization of activity persisted. Hence, a coarse spatial organization of functional activity maps is established very early during OB development when glomeruli are not yet differentiated. This spatial organization is maintained during development and growth of neuronal circuits and may have important functions for odor processing in larvae, for the differentiation of glomeruli, and for the refinement of activity maps at later developmental stages.
Keywords: olfactory bulb, sensory map, neural development, in vivo imaging, transgenic calcium indicator, zebrafish
Introduction
In the adult olfactory bulb (OB), odors are initially represented by patterns of sensory activity across the array of input units, the olfactory glomeruli, in which olfactory sensory neurons (OSNs) converge onto local interneurons and the output neurons of the OB, the mitral cells (MCs). In rodents, each adult glomerulus receives sensory input from a functionally uniform population of OSNs expressing the same single odorant receptor (Ressler et al., 1994; Vassar et al., 1994; Mombaerts et al., 1996; Malnic et al., 1999; Treloar et al., 2002; Wachowiak et al., 2004). Glomerular positions within this map are preserved across individuals. Moreover, glomeruli responding similarly to chemical groups of odorants tend to be loosely clustered (Stewart et al., 1979; Friedrich and Korsching, 1997, 1998; Bozza and Kauer, 1998; Johnson and Leon, 2000; Strotmann et al., 2000; Uchida et al., 2000; Meister and Bonhoeffer, 2001; Wachowiak and Cohen, 2001; Xu et al., 2003). Hence, the array of glomeruli establishes not only a topographic map of odorant receptor expression, but also a functional “chemotopic” map of odor space. Compared with functional maps in other sensory systems, however, the mapping of stimulus qualities in the OB appears more fractured, and the tuning of individual glomeruli is often remarkably complex (Friedrich and Stopfer, 2001).
In glomerular activity patterns of adult zebrafish and rodents, two hierarchical levels of functional spatial mapping are observed. At the coarse level, different chemical classes of odorants (e. g., amino acids and bile acids in zebrafish or aldehydes and alcohols in rodents) predominantly stimulate glomeruli within relatively large regions of the OB. At the finer level, secondary chemical features (e. g., charge or length of amino acid side chains in zebrafish) are mapped onto smaller subregions within the coarse regions in a complex manner (Friedrich and Korsching, 1997, 1998; Johnson and Leon, 2000; Uchida et al., 2000; Friedrich and Stopfer, 2001; Meister and Bonhoeffer, 2001).
Functional maps of stimulus properties are common in the brain and may be important for the representation and processing of stimulus information. The development of functional maps has been studied predominantly in the visual system (Katz and Crowley, 2002). In the OB of mammals, OSN axons appear during embryogenesis and gradually segregate together with MC dendrites into discrete glomerular structures shortly after birth (Malun and Brunjes, 1996; Treloar et al., 1999; Conzelmann et al., 2001; Potter et al., 2001). Later during development, glomerular structures are refined by mechanisms that appear to depend on neuronal activity (Yu et al., 2004; Zou et al., 2004). The formation of functional response maps in the OB, however, is not well understood, especially during early developmental stages.
We examined the spatial organization of activity patterns in the presumptive OB of transparent zebrafish larvae using anatomical techniques and Ca2+ imaging with transgenic and synthetic indicators. A coarse spatial mapping of amino acid and bile acid stimuli was already observed in the developing OB when neurons first responded to odors and glomeruli were not yet fully differentiated. Hence, coarse spatial patterning of activity in the OB is established very early and may have important consequences for the differentiation and function of neuronal circuits in the developing olfactory system.
Materials and Methods
Animals and preparation. Zebrafish (Danio rerio) were kept at a day/night rhythm of 13/11 h under standard conditions. Embryos for imaging experiments were treated with 0.003% N-phenylthiourea starting at 10-20 h after fertilization to suppress pigment formation. Larvae were raised in 90 mm Petri dishes at 28.5°C in standard embryo medium containing the following (in mm): 5 NaCl, 0.17 KCl, 0.33 CaCl2, and 0.33 MgSO4. Before 2-3 d postfertilization (dpf), methyl blue (0.5-2 ppm) was added.
For imaging experiments, larvae were paralyzed by immersion in 0.5 mg/ml mivacurim chloride (Mivacron; GlaxoSmithKline, Munich, Germany) (Brustein et al., 2003). This drug acts as a muscle relaxant by blocking muscular acetylcholine receptors without known effects in the CNS. Larvae were embedded in 2% low-melting agarose (type VII; Sigma, St. Louis, MO) in a custom-made perfusion chamber. The body axis was inclined by 20° for better optical access to the developing OBs. Agarose covering the noses was carefully removed. Larvae spontaneously recovered from paralysis after a few hours and continued to develop without obvious defects.
Imaging experiments on the adult OB were performed in an explant of the intact brain and nose as described previously (Tabor et al., 2004). Briefly, zebrafish were decapitated and olfactory structures exposed ventrally under cold anesthesia. Odors were then applied to the nose as in larvae while fluorescence in the OB was measured. All animal procedures were performed in accordance with the animal care guidelines issued by the Federal Republic of Germany.
Odor stimulation. A constant stream (∼2 ml/min) of zebrafish Ringer's solution was delivered through a tube (inner diameter, 0.75 mm) positioned in front of the noses and removed by continuous suction. Ringer's solution was used to avoid contact of neurons with nonphysiological solutions, especially when micropipettes were inserted into the brain. Larvae showed no obvious reactions to Ringer's solution and survived for many hours without obvious defects. Odors were dissolved in Ringer's solution and introduced into the perfusion stream using a computer-controlled, pneumatically actuated HPLC injection valve (Rheodyne, Cotati, CA). All parts of the odor application apparatus that came in contact with odor-containing solutions were made of Teflon or stainless steel. Standard odor stimuli were a mixture of seven amino acids (Ala, Met, His, Lys, Trp, Phe, Val; 0.1 or 1 mm each), a mixture of three bile acids (glycocholic acid, taurocholic or taurodeoxycholic acid, taurochenodeoxycholic acid; 10 μm each), and a mixture of two nucleotides (ATP, inosine monophosphate; 10 or 100 μm each). These stimuli were chosen because they activate glomeruli in different regions of the adult OB and are diagnostic for the functional spatial organization of activity patterns (Friedrich and Korsching, 1997, 1998). In some experiments, the components in the mixtures were applied also individually. In addition, two food odors were used that are known to activate large numbers of glomeruli in the adult OB (Tabor et al., 2004). Commercially available fish food (200 mg; TetraMin or TetraDelica; Tetra Werke, Melle, Germany) was incubated in 50 ml of Ringer's solution for at least 1 h, filtered through filter paper, and diluted 1:10.
Local injection of synthetic Ca2+ indicator. Individual larvae were embedded in agarose as described. Fifty micrograms of Rhod-2-AM-ester (Molecular Probes, Eugene, OR) were dissolved in 8 μl of DMSO containing 20% Pluronic F-127 (Molecular Probes) and diluted 1:20-1:40 in teleost artificial CSF (ACSF) (Mathieson and Maler, 1988). A patch-clamp micropipette (resistance, 8-13 MΩ when filled with ACSF) was loaded with the dye solution and inserted into the developing OB. This procedure was performed under two-photon optics with a motorized manipulator to ensure precise pipette placement. Care was taken not to damage the olfactory epithelia and nerves. Pressure (50-500 mbar) was applied to the pipette while fluorescence in the target region was monitored continuously to avoid the application of excessive amounts of dye solution. Fluorescent labeling was usually observed within seconds. Dye ejection was terminated and the pipette removed after one to a few minutes.
Transgenic zebrafish lines and transient expression of HuC::GFP. HuC::IP transgenic lines were generated as described previously for HuC::YC (Higashijima et al., 2003). An expression construct was generated by subcloning a fragment of the HuC promoter (Higashijima et al., 2003), the cDNA encoding inverse pericam (IP) (Nagai et al., 2001), and a simian virus 40 poly(A) signal (Invitrogen, San Diego, CA) into pBluescript-SK (Stratagene, La Jolla, CA). DNA injection into embryos and generation of stable transgenic zebrafish was performed as described previously (Higashijima et al., 1997). Multiple independent transgenic lines were obtained and crossed. The offspring was selected for high expression levels and, most likely, carried multiple insertions of the transgene. No difference was observed between larvae derived from crosses of different founders.
For transient expression experiments, the IP cDNA in the HuC::IP construct was replaced by cDNA encoding enhanced green fluorescent protein (GFP; Clontech, Cambridge, UK). Circular plasmid (100 ng/μl) was microinjected into cell stage 1-2 embryos following standard procedures.
Ca2+ imaging. Ca2+ signals in the forebrain were measured with a custom-made upright wide-field and two-photon microscope through a 20× [numerical aperture (NA), 0.95; Olympus, Melville, NY] or 60× (NA, 1.1; Olympus) water immersion objective (Wachowiak et al., 2004). In the wide-field mode, fluorescence was excited through an excitation filter (495/30) by a stabilized 150 W Xe arc lamp attenuated to 1.5-6% of the full intensity. Fluorescence emission light was projected through a dichroic mirror (520 long pass) and an emission filter (545/50) onto the chip of a sensitive cooled CCD camera (CoolSnapHQ; PhotoMetrics, Tucson, AZ). Only the central quadrant of the chip was read out. Images were binned to 87 × 65 or 174 × 130 pixels and digitized at 12 bits and 5-10 Hz.
Two-photon fluorescence was excited with a mode-locked Ti:Sapphire laser (Mira900; 76 MHz; 830-930 nm; Coherent, Santa Clara, CA) pumped by a 10 W diode laser (Verdi; Coherent). Fluorescence emission was detected externally by a photomultiplier-based whole-field detector through emission filters (515/30 or 545/60 for GFP and IP; 610/75 for Rhod-2 AM). Image acquisition was controlled by custom software [CFNT; written by Ray Stepnoski at Bell Labs (Murry Hill, NJ) and Michael Müller at the Max-Planck-Institute for Medical Research]. To measure Ca2+ signals, a series of images was usually acquired at 8 Hz and 64 × 64 pixels or 4 Hz and 128 × 128 pixels. Anatomical images were acquired at 256 × 256 or 512 × 512 pixels. To measure Ca2+ signals with IP, 8-12 trials were averaged to enhance the signal-to-noise ratio. For three-dimensional reconstructions of activity patterns from Rhod-2 imaging, three to five repeated trials were averaged at each focal plane.
Analysis of imaging data. Data analysis was performed using routines written in IgorPro (WaveMetrics, Lake Oswego, OR) and MatLab (MathWorks, Natick, MA). A series of images around the onset of odor stimulation was converted into a frame series representing the relative change in fluorescence (ΔF/F) in each pixel and frame. The baseline fluorescence F was determined by averaging raw images over ∼2 s before stimulus onset. Response maps were constructed by averaging ΔF/F frames over a period of ∼3 s covering the peak of the response. Response maps were spatially low-pass filtered using a mild Gaussian kernel (width, 5 pixels and σ = 1.2 pixels or width, 7 pixels and σ = 2.4 pixels) and color-coded. Data obtained with IP were corrected for bleaching by subtracting a ΔF/F series obtained without odor stimulation. Image analysis parameters were kept constant for all trials that were compared with each other.
Three-dimensional activity patterns were reconstructed from activity maps measured at different depths by two-photon imaging of Rhod-2. The positions of focal Ca2+ signals (units) in the glomerular/MC layer were outlined manually after spatial bandpass filtering of response maps to enhance the contrast in activity patterns. The position of each unit was plotted in a three-dimensional coordinate system with the size of the plot symbol representing the magnitude of the Ca2+ signal.
Quantitative analysis of focality was performed mainly on larvae that did not undergo repeated paralysis to avoid possible subtle effects on development. All larvae analyzed with the synthetic indicator and 50 of 57 larvae analyzed with the transgenic indicator were not paralyzed repeatedly. Seven larvae that were paralyzed repeatedly were included in the data set, because no obvious differences to the remaining larvae were observed.
Analysis of focality. The developing OB was outlined manually, and the average distance <d> between all pixels of the OB was determined. Pixels with ΔF/F values exceeding 50% of the maximum response were selected. The distances between all pairs of selected pixels were weighted by the product of their response intensities (normalized so that the sum of all weights was unity) and averaged. The resulting weighted average distance between strongly responding pixels was then divided by <d> to obtain the focality index. If strongly responding pixels are randomly distributed the focality index approaches unity; a focality index <1 indicates a focal response pattern. The three-dimensional focality index was calculated accordingly from the response magnitudes and coordinates of units in the glomerular/MC layer.
Response similarity as a function of distance. This analysis was performed on three-dimensional data sets obtained by two-photon imaging of Ca2+ signals with Rhod-2. For each identified unit, the response magnitudes to the amino acid, bile acid, and nucleotide mixtures were determined and represented by a three-element vector. The pairwise similarity between response profile vectors was quantified by the correlation coefficient for all possible pairs of units. In addition, the Euclidian distance between each pair was determined and normalized to the OB diameter to correct for size differences. The correlation between the response profiles was then averaged in a histogram as a function of the distance between responding units.
Immunohistochemistry and lipophilic dye tracing. Whole-mount antibody staining was performed using standard procedures. Briefly, larvae (5 dpf) were fixed overnight at 4°C in 4% paraformaldehyde supplemented with 1% glutaraldehyde. Fixed larvae were incubated in 1:200 rabbit anti-GABA (AB131; Chemicon, Temecula, CA) at 4°C for 48 h. The secondary antibody was conjugated to Alexa Fluor 568 (A-11011; Molecular Probes). No cells were stained when the primary antibody was omitted.
To label OSN axons, a stock solution of 10 mm 4-(4-dihexadecylamino)-styryl)-N-methylpyridinium iodide (DiA; 4-Di-16-ASP; Molecular Probes) in DMSO was diluted to 2.5 μm in embryo medium. Larvae were immersed in this solution for 80 min, washed three times, and incubated overnight. For time-lapse experiments, larvae were incubated in DiA solution overnight. Larvae were then anesthetized in MS-222, mounted dorsal-side-up in low-melting agarose, and examined by confocal or two-photon microscopy.
An upright confocal microscope (TCS SP2; Leica, Nussloch, Germany) equipped with a 63× objective (NA, 1.2; Leica) was used for most anatomical experiments. Ar (488 nm) and HeNe (543 nm) lasers were used for simultaneous excitation of GFP and DiA or Alexa Fluor 568, respectively. Overlap of emission spectra was corrected for by Leica LCA software. Optical sections were acquired at 0.5 or 1 μm intervals in the z-dimension. In some experiments, especially when individual larvae were imaged repeatedly during development, images were acquired with the two-photon microscope at 1 or 2 μm intervals in the z-dimension. Overlap of emission spectra in the two channels was corrected after measuring the relative intensity of each fluorophore in each channel. Three-dimensional visualization of image stacks was done using Volocity (Improvision, Lexington, MA).
To create maps of protoglomeruli for quantitative analysis, distinct structures containing both DiA+ OSN axons and dlx4/6::GFP+ dendrites were delineated manually in individual optical sections of OBs from five individual fish at each developmental day. Dlx4/6::GFP rather than HuC::YC transgenics were used, because dendritic neuropil structures were difficult to delineate against the high density of somata in the same layer in HuC::YC transgenics.
Results
Development of glomerular structures in zebrafish larvae
The adult zebrafish OB contains a stereotyped arrangement of ∼80 prominent glomeruli and a dense plexus-like region with an additional ∼100 small glomerular structures (Baier and Korsching, 1994; Friedrich and Korsching, 1997). During development, the earliest projection from the nose to the presumptive OB is made by a transient population of dendrite-less neurons at ∼30 h after fertilization (Hansen and Zeiske, 1993; Whitlock and Westerfield, 1998). First OSN projections to the presumptive OB are established by ∼2 dpf, and segregation of axon terminals into discrete structures has been observed by 2-3 dpf (Wilson et al., 1990; Hansen and Zeiske, 1993; Dynes and Ngai, 1998; Whitlock and Westerfield, 1998). The precise nature of these terminal structures and their further development is, however, unclear.
We investigated the formation of glomerular structures by anterograde tracing of OSN axons with DiA. To have anatomical landmarks, experiments were performed in a transgenic zebrafish line expressing GFP under the control of enhancer sequences of the homeobox genes distal-less 4 (dlx4) and dlx6 (dlx4/6::GFP) (Zerucha et al., 2000) (Fig. 1A). We first characterized the expression pattern of dlx4/6::GFP. The murine orthologs of dlx4/6, dlx5/6, are expressed in local GABAergic interneurons of the OB, the periglomerular and granule cells (Long et al., 2003; Stenman et al., 2003). Consistent with the murine expression pattern, dlx4/6::GFP+ cells were located in the deep layer of the OB in zebrafish larvae (Fig. 1A,B) (see below) and did not project axons out of the OB. No GFP expression was observed in the olfactory epithelium and nerve. The identity of dlx4/6::GFP+ neurons was further examined using antibodies against GABA. Consistent with a previous study in zebrafish (Sakata et al., 2003), GABA immunoreactivity was found in the deeper layers of the developing OB. Dlx4/6::GFP+ neurons were, with very few exceptions, immunoreactive to GABA (Fig. 1C). Some dlx4/6::GFP+ neurons in peripheral locations were also immunoreactive to antibodies against tyrosine hydroxylase, a marker for a subpopulation of periglomerular cells (M. Mione, unpublished observations). These results indicate that dlx4/6::GFP is expressed in GABAergic interneurons of the OB (i.e., granule cells and periglomerular cells). Some GABA+ cells were dlx4/6::GFP-, suggesting that dlx4/6::GFP marks a subset of all GABAergic interneurons.
Figure 1.
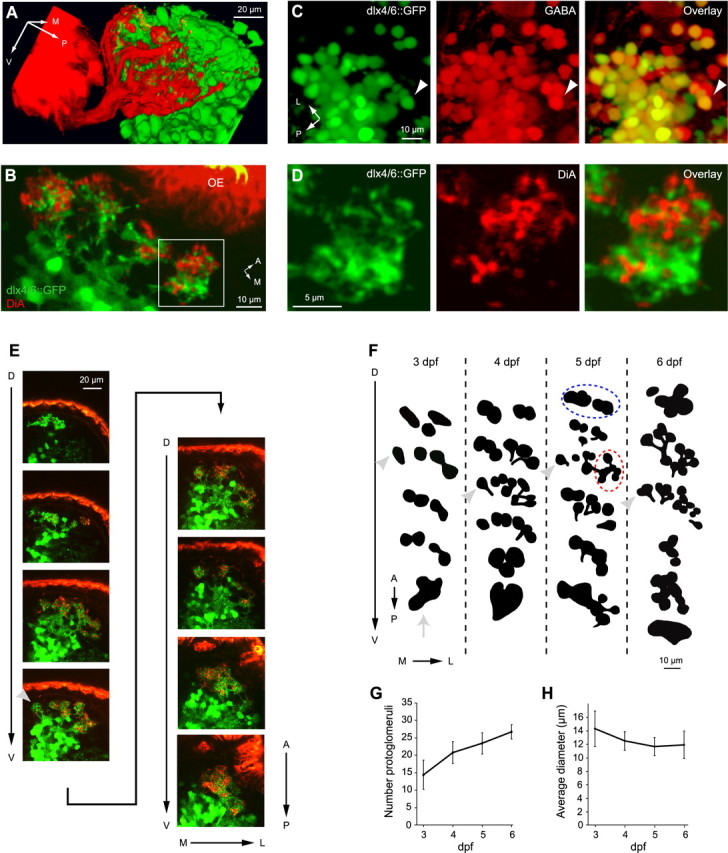
Development of protoglomeruli. A, Three-dimensional confocal reconstruction of DiA-labeled OSN projections to the presumptive OB (red) and dlx4/6::GFP (green) expression at 5 dpf; lateral view. B, DiA labeling (red) and dlx4/6::GFP expression (green) in an individual confocal section through the anterior OB at high magnification (5 dpf). OE, Olfactory epithelium. C, dlx4/6::GFP expression (green) and labeling with an anti-GABA antibody (red) in the OB of a larva (5 dpf). Most dlx4/6::GFP+ neurons are also GABA+. D, DiA labeling (red) and dlx4/6::GFP expression (green) within a single protoglomerulus at higher magnification. Region corresponds to the box in B. E, Confocal stack from dorsal (D) to ventral (V) through an OB at 5 dpf. Images were taken at 1 μm intervals; every 10th image is shown. Medial (M) to lateral (L) and anterior (A) to posterior (P) directions in each image are indicated. The arrowhead in the fourth image depicts an identifiable medial protoglomerulus that is sparsely innervated by OSN axons. F, Schematic maps of protoglomerular structures from representative animals at different developmental days. Each group of black shapes represents the outline of protoglomeruli at one focal plane. From top to bottom, groups of protoglomeruli are depicted at 10 μm intervals along the dorsoventral axis. Protoglomeruli visible in more than one focal plane are depicted only once. At each focal plane, the anterior to posterior axis and the medial to lateral axis are as in E (arrows). Dashed lines label groups of protoglomeruli that can be identified consistently across individuals (see Results). The arrow depicts a plexus-like region present at 3 dpf. Arrowheads show the identifiable medial protoglomerulus. G, H, Quantification of number and diameter of protoglomeruli between 3 and 6 dpf (n = 5 larvae at each dpf). Error bars show SD.
In zebrafish larvae, some dlx4/6::GFP+ neurons projected dendrites to circumscribed neuropil-rich regions in the outer layer of the OB (Fig. 1B). These neuropil regions also contained DiA+ OSN axons (Fig. 1B). Within these neuropil regions, DiA labeling and GFP expression were usually segregated in different subdomains (Fig. 1D). Neuropil regions containing both DiA+ axons and dlx4/6::GFP+ dendrites resembled glomeruli. However, adult glomeruli are not densely innervated by dlx4/6::GFP+ dendrites (data not shown). Moreover, the pattern of neuropil regions in larvae contained fewer distinct structures than the adult glomerular pattern and changed during development (see below), suggesting that neuropil structures in larvae are glomerular precursors that are not yet fully differentiated. We therefore refer to the larval neuropil structures containing DiA+ axons and dlx4/6::GFP+ dendrites as protoglomeruli (Oland et al., 1990; Valverde et al., 1992; Treloar et al., 1999; Conzelmann et al., 2001).
The development of protoglomeruli was examined by confocal microscopy in double-labeled larvae. Complete OBs of at least five individuals at each developmental day between 3 and 6 dpf were optically sectioned (Fig. 1E). Representative patterns of protoglomeruli from different individuals between 3 and 6 dpf are shown schematically in Figure 1F. Consistent with previous observations at 3.5 dpf (Dynes and Ngai, 1998), characteristic groups of protoglomeruli were found in stereotyped positions: a small group in the dorsal OB (Fig. 1F, dashed blue line), a dense group in the lateral OB (Fig. 1F, red), and a group in the medial OB. Individual protoglomeruli could, however, not be identified unequivocally between different animals and developmental stages, with two exceptions: a plexus-like region in the ventral OB was prominent at 3 dpf (Fig. 1F, arrow) but developed into more distinct protoglomeruli at later stages, and a protoglomerulus with sparse OSN innervation in the medial group was recognized in most individuals (Fig. 1E,F, arrowheads).
The average number of protoglomeruli observed at 3 dpf was 14.4, corresponding well to the number of ∼16 neuropil structures reported previously at 3.5 dpf (Dynes and Ngai, 1998). Between 3 and 6 dpf, however, the pattern of protoglomeruli changed (Fig. 1F). The average number of identifiable protoglomeruli increased from 14.4 to 26.8, whereas their average diameter decreased slightly from 14.3 to 11.9 μm (Fig. 1G,H), suggesting that glomerular differentiation involves the remodeling of protoglomerular neuropil. Protoglomeruli were therefore imaged repeatedly between 3 and 6 dpf in the same individuals using two-photon microscopy (n = 4 OBs). Each larva was stained with DiA and imaged once every 24 h. Between imaging sessions, larvae recovered from paralysis and showed no obvious developmental abnormalities. Although the gross pattern of protoglomeruli was relatively stable between 3 and 6 dpf, the fine morphology of protoglomeruli became refined. In particular, some protoglomeruli were initially loosely defined and subsequently developed into multiple smaller and more distinct structures (Fig. 2). Concomitantly, the density of innervation by DiA+ axons increased. These results indicate that the development of glomeruli proceeds gradually and locally by differentiation of larger precursors. Moreover, the number and appearance of glomerular structures differed markedly from the adult OB even at the latest stages examined, implying that the differentiation of glomeruli continues well beyond 6 dpf.
Figure 2.

Time-lapse imaging of a protoglomerulus. Two-photon optical section through a protoglomerular structure in the same individual at three subsequent developmental days. Red, DiA labeling; green, dlx4/6::GFP expression. The arrowheads depict a small glomerular structure that appears to segregate from a preexisting protoglomerulus.
Measurement of odor-evoked activity patterns with a transgenic Ca2+ indicator
We generated transgenic zebrafish lines expressing the genetically encoded Ca2+ indicator IP under the control of a fragment of the HuC promoter (Park et al., 2000; Higashijima et al., 2003). HuC is an RNA-binding protein expressed in neurons. Individual founders were crossed randomly to obtain transgenic offspring carrying different integrations of the same transgene. Another transgenic line expressing yellow cameleon (YC) 2.1 under the control of the identical promoter fragment has been described recently (Higashijima et al., 2003). The expression patterns of HuC::IP and HuC::YC in the OB were indistinguishable, but HuC::YC fluorescence was more intense. Both indicator proteins were excluded from the nucleus, as reported previously in mice (Hasan et al., 2004).
We first examined the expression pattern of Ca2+ indicator proteins in the larval OB. Somata expressing YC or IP at high levels were densely packed in the outer layer of the anterior and lateral OB (Fig. 3A, arrow). Low levels of fluorescence were detected in deeper OB layers (Fig. 3A, asterisk). Fluorescence was also observed in medial and lateral axon tracts projecting to the telencephalon (Fig. 3A, arrowheads) and in the anterior commissure, suggesting that the indicators were expressed in projection neurons of the OB. To examine this further, GFP was transiently expressed under the control of the identical HuC promoter fragment by injection of a HuC::GFP DNA construct into one-cell embryos. The resulting expression pattern is much sparser than in stable transgenic lines, facilitating the morphological examination of single neurons. HuC::GFP+ neurons often had small dendritic tufts and axonal processes projecting to the telencephalon (Fig. 3B), thus confirming that the HuC promoter fragment drives expression in projection neurons of the OB.
Figure 3.

Expression of the transgenic Ca2+ indicator. A, Expression of HuC::YC in the forebrain of a larva at 4 dpf (z-projection of stack acquired with two-photon microscope in vivo). Strong expression in neurons in the outer layers of the OB is indicated by white arrow. The asterisk denotes weak expression in deeper layers of OB. Arrowheads depict axon tracts projecting to the telencephalon (Tel). B, Individual neuron labeled by transient mosaic expression of HuC::GFP (5 dpf). A long axon (arrowhead) to the telencephalon is visible. The halo around the somatic and dendritic region is caused by strong fluorescence. Other fluorescent structures in the field of view were removed from the image for clarity. C, Expression of HuC::YC and dlx4/6::GFP in a double-transgenic larva (5 dpf). D, HuC::YC expression (green) and labeling with an anti-GABA antibody (red) in the forebrain of a larva at 5 dpf (z-projection of a small confocal stack). E, HuC::YC expression in an optical section through the adult OB (z-projection of a two-photon stack). HuC::YC+ somata (arrows) and projecting axons (arrowheads) are visible. No HuC::YC+ somata are found in the deeper layers (asterisk). AC, Anterior commissure; L, lateral; A, anterior; P, posterior; M, medial.
We next examined dlx4/6::GFP and HuC::YC double-transgenic animals. The two transgenes were expressed in a complementary pattern in the OB. HuC::YC+ neurons were located in a peripheral layer, whereas dlx4/6::GFP+ somata were located in deeper layers (Fig. 3C). Some dlx4/6::GFP+ neurons extended dendrites between the somata of HuC::YC+ neurons. Immunohistochemical experiments were performed to examine whether the HuC::YC+ neurons include GABAergic interneurons. Most, if not all, HuC::YC+ neurons were not immunoreactive to an antibody against GABA but were located in a layer peripheral to the GABA+ neurons (Fig. 3D). A previous study (Sakata et al., 2003) reported that neurons at the location of the HuC::YC+ neurons express high levels of glutamate, the neurotransmitter of MCs. Together, these observations indicate that the transgenic Ca2+ indicators are only weakly expressed in GABAergic interneurons and that strong expression occurs predominantly or exclusively in MCs.
We also examined the expression pattern of transgenic Ca2+ indicators in the adult OB. Consistent with the larval expression pattern, strongly fluorescent neurons were found only in the outer (glomerular/MC) layer of the adult OB (Fig. 3E, arrows). Projecting axons were observed within the OB and the olfactory tracts (Fig. 3E, arrowheads). Unlike in larvae, weakly fluorescent somata in deeper layers were not detected, but intermediate to weak fluorescence was observed in afferent OSN axons. Fluorescent somata within the adult glomerular/MC layer were often scattered at low density. This expression pattern is consistent with the distribution of MCs in the adult the OB (Edwards and Michel, 2002). The number of HuC::IP+ or HuC::YC+ somata in 4- to 8-month-old fish, extrapolated from counts in the ventral half of the OB, was 1654 ± 283 (n = 7). This number is in agreement with a rough estimate of the total number of MCs in adults derived from retrograde tracing studies (C. Byrd, personal communication), suggesting that most or all MCs expressed the transgene.
IP fluorescence is highest at low Ca2+ concentrations and decreases after Ca2+ binding with an apparent dissociation constant of 200 nm (Nagai et al., 2001). The functionality of HuC::IP was first tested in the OB of adult zebrafish using amino acid and bile acid stimuli. These stimulus classes stimulate different classes of OSNs (Hansen et al., 2003). Previous studies using activity indicators in OSN axons demonstrated that amino acids and bile acids evoke sensory input to glomeruli predominantly in the lateral and anteromedial OB, respectively (Friedrich and Korsching, 1997, 1998). Electrophysiological responses of OB neurons to amino acids and bile acids were detected in similar regions in other fish species (Døving et al., 1980; Nikonov and Caprio, 2001). In the OB of HuC::IP transgenic fish, odor stimulation elicited decreases in fluorescence intensity (Fig. 4), indicating that, on average, the intracellular Ca2+ concentration in OB neurons increased. Mixtures of amino acids and bile acids evoked responses predominantly in the lateral and anteromedial OB (Fig. 4), consistent with the distribution of glomerular inputs measured previously.
Figure 4.

Function of inverse pericam in the adult OB. Fluorescence of an adult HuC::IP OB (top left) and activity maps evoked by an amino acid mixture (AA Mix; 10 μm each), a bile acid mixture (BA Mix; 1 μm each), and four individual amino acids (10 μm each) measured with a CCD camera are shown. Foci of fluorescence signals in response to AA Mix and BA Mix are indicated by black and gray outlines, respectively. The trace shows time course of response to AA Mix in the region outlined in black. The bar indicates odor stimulus. The color scale ranges from -6 to +1.5% (AA Mix), -3 to +0.75% (BA Mix), and -5 to +1.25% (others). L, Lateral; A, anterior; min, minimum; max, maximum.
Within the lateral OB of adults, individual amino acids stimulate different but overlapping sets of glomerular inputs that are spatially organized in a complex manner (Friedrich and Korsching, 1997). In HuC::IP transgenic fish, patterns of fluorescence signals evoked by individual amino acids were overlapping and more widespread than patterns of glomerular input activity. This was expected because electrical activity in MCs evokes Ca2+ signals throughout their dendrites (Charpak et al., 2001) (R. Tabor and R. W. Friedrich, unpublished observations), which are more extensive than individual glomeruli. The fine spatial structure of odor-evoked activity in the MC population can therefore not be resolved. Nevertheless, stimulus class-specific spatial differences in activity patterns evoked by amino acids and bile acids were detected reliably.
Development of spatial activity patterns: analysis with a transgenic Ca2+ indicator
The development of spatial activity patterns was examined in HuC::IP transgenic larvae. Responses to individual odorants were first detected in the larval OB between 2.5 and 4 dpf, depending on the stimulus. We therefore started to measure odor-evoked activity patterns at 3 dpf, shortly after hatching. Because the imaging procedure is noninvasive, the same larvae could be analyzed repeatedly at later stages of development (n = 7). Figure 5A shows patterns of fluorescence signals evoked by mixtures of amino acids and bile acids in the developing olfactory system of the same larva at 3 and 5 dpf. In Figure 5B, responses in the developing OBs to 14 odors are shown at 3 and 5 dpf. At 3 dpf, some individual odorants still evoked small or no signals. By 5 dpf, fluorescence changes were larger, and all stimuli evoked clear responses. The observed responsiveness to a broader range of odorants at 5 dpf is consistent with the finding that the number of different odorant receptors expressed by OSNs increases between 3 and 5 dpf (Barth et al., 1996; Byrd et al., 1996; Argo et al., 2003).
Figure 5.
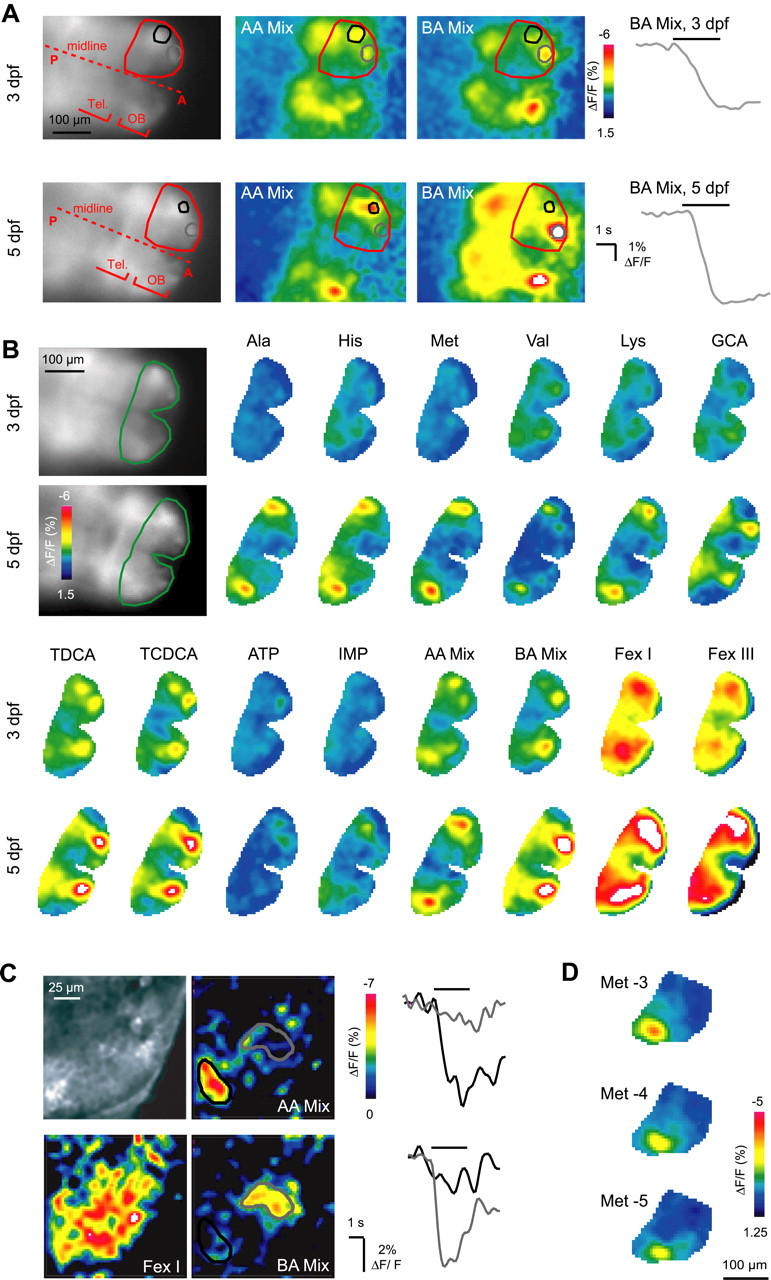
Development of activity maps analyzed with a transgenic Ca2+ indicator. A, Expression patterns of HuC::IP (left) and activity maps (color-coded) evoked by stimulation with mixtures of amino acids (1 mm each) and bile acids (10 μm each). The same larva was examined at 3 dpf and again at 5 dpf. Measurements were taken with a CCD camera. Red outline depicts one OB; black and gray outlines indicate foci of signals evoked by the two stimuli. Traces show time course of fluorescence changes evoked by the bile acid mixture in the regions outlined in gray. Bars indicate odor stimulus. Tel., Telencephalon; A, anterior; P, posterior. B, HuC::IP expression (left) and response patterns in the OBs (color-coded; region outlined in raw fluorescence images) to 14 different odor stimuli at 3 and 5 dpf in the same larva. Stimulus concentrations were 1 mm for amino acids, 10 μm for bile acids (GCA, glycocholic acid; TDCA, taurodeoxycholic acid; TCDCA, taurochenodeoxycholic acid) and nucleotides (IMP, inosine monophosphate). Food extracts (FexI and FexIII) were diluted 1:10 from the raw extract (see Materials and Methods). ΔF/F values exceeding the color scale are represented white. C, Raw fluorescence (top left) and response maps (color-coded) evoked by three different stimuli in an optical section through the OB of a HuC::IP transgenic larva (4 dpf; two-photon microscopy). Each response map is an average of 8-12 trials. Traces show response time courses to amino acid and bile acid mixtures (each component 1 mm and 10 μm, respectively) in the two outlined regions. Bars indicate odor stimulus. D, Response patterns to different concentrations of Met in one OB of a zebrafish larva (5 dpf). AA Mix, Amino acid mixture; BA Mix, bile acid mixture.
Already at 3 dpf, clear regional differences in the distribution of activity evoked by different stimuli were observed. A mixture of amino acids evoked fluorescence signals predominantly in the lateral OB, whereas the medial OB responded only weakly. A mixture of bile acids, in contrast, strongly stimulated the anteromedial OB, whereas responses in the lateral OB were weak. Food extracts containing many different compounds evoked stronger and wide-spread signals. This odor-dependent distribution of activity was similar at 3 and 5 dpf. In a transgenic line expressing IP more ubiquitously under the control of the zebrafish β-actin promoter, a similar preference of the lateral and medial OB for amino acid and bile acid stimuli, respectively, was observed at 3 dpf and thereafter, although response patterns were somewhat more widespread (J. Li and Friedrich, unpublished observations). Hence, a coarse spatial organization of odor response patterns consistent with activity patterns in the adult OB is present already at very early stages of OB development.
Odor-evoked fluorescence signals in HuC::IP transgenic fish were measured at higher spatial resolution by two-photon microscopy. Figure 5C shows fluorescence signals in an optical section through the OB. Consistent with the results from wide-field imaging, the amino acid and bile acid mixtures evoked fluorescence signals in complementary regions of the lateral and medial OB, respectively, whereas food extracts evoked more wide-spread responses. However, the signal-to-noise ratio was low, because the number of photons that can be collected from a thin optical section without excessive bleaching was small.
In some experiments (n = 11), responses to amino acid concentrations between 10 μm and 1 mm were compared. With decreasing odor concentration, response magnitude decreased slightly, but the spatial distribution of the fluorescence signal remained similar (Fig. 5D).
To quantify the odor-dependent focality of activity patterns in the developing OB, zebrafish larvae between 3 and 5 dpf were stimulated with mixtures of amino acids (1 mm each) and bile acids (10 μm each). Relatively high odor concentrations were chosen to evoke intense and spatially extensive activity patterns. These are conservative conditions for the detection of focal activity patterns, because patterns may become more widespread with increasing concentration. At all stages, amino acid-evoked Ca2+ signals had a focus in the lateral OB, whereas bile acid-evoked signals had a focus in the medial OB (Fig. 5A,B). A focality index was derived to quantify the spatial concentration of responding pixels in each activity map. This index is based on the weighted average distance between strongly responding pixels, normalized to the average distance between all pixels in the map (see Materials and Methods). Values near unity indicate no spatial concentration of strongly responding pixels, whereas values <1 indicate the presence of one or more foci in a response pattern. In addition, the similarity between activity patterns evoked by amino acid and bile acid mixtures in the same OBs was quantified by the correlation coefficient.
The average focality index of activity maps evoked by amino acid bile acid mixtures at 3 dpf was 0.69 ± 0.12 and 0.63 ± 0.10 (mean ± SD), respectively, indicating that responses had distinct foci. At subsequent stages, the focality of response patterns decreased slightly (Fig. 6A). The average correlation between activity patterns evoked by amino acid and bile acid mixtures and was low already at 3 dpf and decreased slightly between 3 and 4 dpf (Fig. 6B). These results indicate that the coarse spatial organization of activity patterns evoked by amino acids and bile acids are established already when the OB starts to respond to odors.
Figure 6.

Quantitative analysis of chemotopy during development. A, Average focality index of response patterns to amino acid (AA) and bile acid (BA) mixtures as a function of developmental time. B, Pearson correlation (similarity) of response patterns evoked amino acid and bile acid mixtures as a function of developmental time. Error bars show SD.
Development of activity patterns: analysis with a synthetic Ca2+ indicator
To study odor-evoked activity patterns in the developing OB by a second approach at higher spatial resolution, neurons in the developing OB of dlx4/6::GFP transgenic larvae were labeled with the red-fluorescing Ca2+ indicator Rhod-2 by injection of the AM-ester form (Brustein et al., 2003; Stosiek et al., 2003). Using two-photon microscopy, GFP and Rhod-2 fluorescence in optical sections through the OB was monitored simultaneously at separate emission wavelengths (Fig. 7A,B). The signal-to-noise ratio of Ca2+ measurements with the synthetic indicator Rhod-2 was substantially higher than that obtained with IP. As a consequence, responses to multiple stimuli at different focal planes were obtained at high resolution (Fig. 7C-H). The anatomical location of Ca2+ signals was identified by overlaying the expression of the GFP marker (Fig. 7C).
Figure 7.
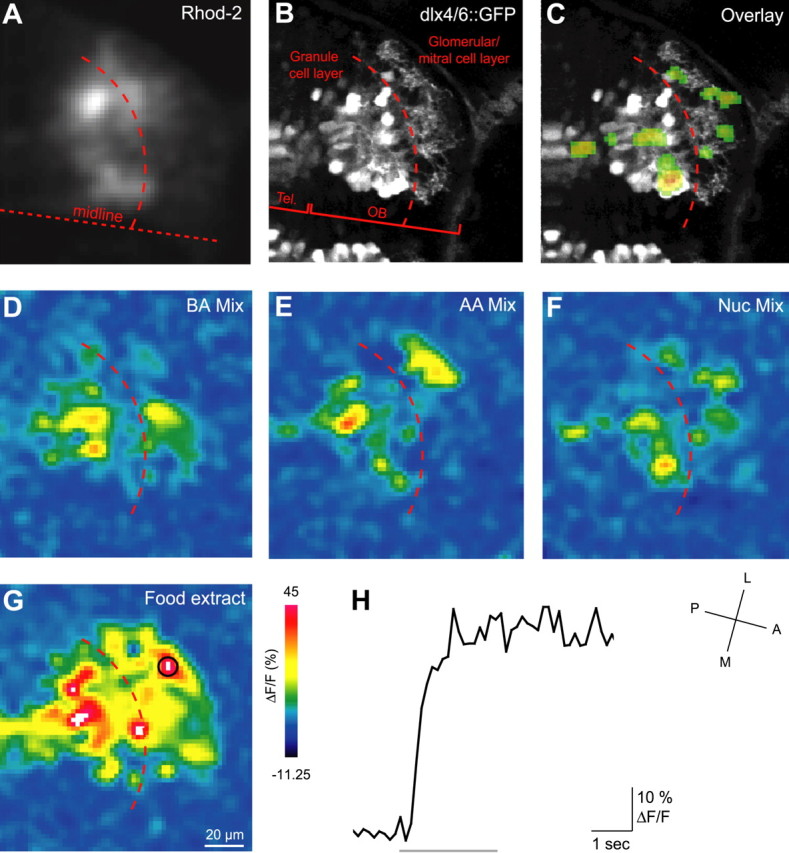
Two-photon imaging of odor-evoked activity in the developing OB with a synthetic Ca2+ indicator. A, Raw fluorescence in the OB after injection of Rhod-2-AM (red fluorescence channel). B, dlx4/6::GFP expression in the same field of view (green channel). Tel., Telencephalon. C, Overlay of activity pattern evoked by nucleotide mixture (F) onto dlx4/6::GFP expression pattern (B). D-G, Color-coded response (ΔF/F) patterns evoked by bile acid (BA) mixture, amino acid (AA) mixture, nucleotide (Nuc) mixture, and a food extract. The dashed line indicates estimated border between glomerular/MC layer and deeper (granule cell) layers.H, Response time course to food extract in the encircled region. The bar indicates odor stimulus. A, Anterior; P, posterior; L, lateral; M, medial.
Odor-evoked Ca2+ signals in the developing OB comprised multiple “hot spots” (Fig. 7C-G). For comparison to data obtained in HuC::IP transgenic fish, we concentrated on signals in the protoglomerular/MC layer. In this layer, hot spots may correspond to MC somata, protoglomerular neuropil, or both. Because the precise anatomical correlate of each hot spot could not be identified, the positions of hot spots are referred to as units. As in the HuC::IP transgenic line, odor responses to individual odorants were first detected between 2.5 and 4 dpf, depending on the stimulus. Responses to mixtures of amino acids (100 μm each), bile acids (10 μm each), and nucleotides (100 μm each) were first detectable at 2.5 dpf and measured in larvae up to 6 dpf (Fig. 7D-H). In addition, two food extracts were included in the stimulus set because they consistently activated a large number of units (Fig. 7G). Responses to single amino acid odorants were also measured. In each larva, data were obtained from optical sections covering the entire OB, spaced by 10 μm in the z-dimension. Activity patterns were then reconstructed in three dimensions.
Figure 8A shows the three-dimensional reconstruction of activity patterns in the glomerular/MC layer, evoked by three amino acids with side chains carrying different functional groups (Phe, Lys, Val; 100 μm). Each dot represents one unit (i.e., the location of a hot spot evoked by at least one stimulus). Activity patterns were unique but overlapping (i.e., a considerable fraction of active units responded to more than one stimulus) (Fig. 8C, yellowish color of spheres in the overlay indicates responses to both Lys and Phe). At the level of sensory input to the OB, activity patterns evoked by these stimuli in adult fish are spatially separated within the lateral OB (Friedrich and Korsching, 1997), even at a concentration of 100 μm (Friedrich, unpublished results). In the measurements from neurons in the OB of larvae, however, an obvious spatial segregation of activity was not observed. Rather, all activity patterns were concentrated within a common volume (Fig. 8A).
Figure 8.
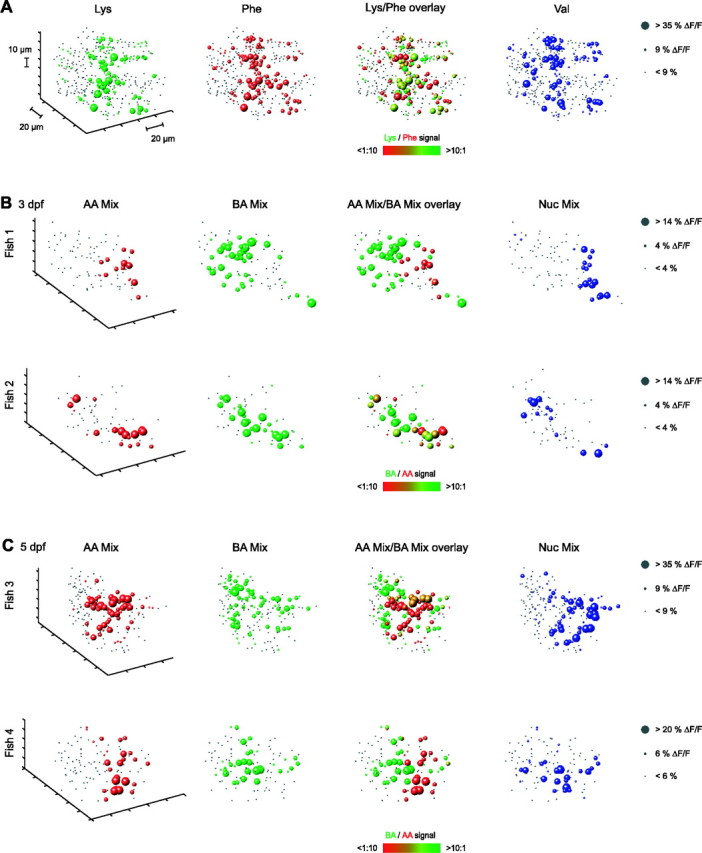
Three-dimensional activity patterns in the glomerular/MC layer. A, Three-dimensional reconstructions of activity patterns evoked by three individual amino acids (100 μm) at 4 dpf. Activity was measured by two-photon Ca2+ imaging using the synthetic indicator Rhod-2 in a dlx4/6::GFP background. Optical sections were spaced by 10 μm. Each dot represents the position of one unit (see Results) in the glomerular/MC layer. Gray dots indicate units that did not respond to a given stimulus (ΔF/F smaller than an arbitrary threshold). Spheres of different sizes depict units responding with different magnitudes (right). Colors correspond to odors. In the overlay, response patterns evoked by Lys and Phe are combined. The size of spheres represents the magnitude of the larger response to the two stimuli; the color varies between red and green and indicates the response ratio to the two stimuli. B, Activity patterns evoked by mixtures of amino acids (AA Mix), bile acids (BA Mix), and nucleotides (Nuc Mix) at 3 dpf. Each row shows results from one larva to illustrate interindividual variability. C, Activity patterns evoked by mixtures of amino acids (AA), bile acids (BA), and nucleotides (Nuc) at 5 dpf in two different larvae.
A coarse spatial separation of activity patterns was, however, observed in response to stimuli of different chemical classes. At 3 dpf, units responding to amino acids and bile acids were concentrated in the lateral and medial OB, respectively (Fig. 8B). Units responding to nucleotides were mainly localized in a volume in between the clusters responding to amino acids and bile acids. At 5 dpf, the number of responsive units was higher, and activity patterns appeared more complex (Fig. 8C). However, responses were still concentrated in the same regions as at 3 dpf. The precise topology of activity patterns differed between individuals of the same developmental stage (Fig. 8B,C). However, in different individuals, units responding to amino acids were always found predominantly in the lateral OB, whereas units responding to bile acids were located mainly in the medial OB. Hence, a coarse spatial organization of response patterns to different stimulus classes was consistently observed.
Three-dimensional activity patterns were measured in three to six individual larvae at each dpf, and the focality of response patterns was quantified by the three-dimensional focality index (see Materials and Methods). The average focality was well below 1 at 2.5 dpf, indicating focal response patterns, and further decreased during subsequent days (Fig. 9A).
Figure 9.

Quantitative analysis of chemotopy from three-dimensional activity patterns. A, Focality index of three-dimensionally reconstructed activity patterns evoked by amino acid (AA) and bile acid (BA) mixtures as a function of developmental age. B, Plots of the average similarity of response profiles of units in the glomerular/mitral cell layer as a function of their distance at different ages. Similarity was quantified by the correlation coefficient of vectors describing the response intensity (ΔF/F) to mixtures of amino acids, bile acids, and nucleotides. Distance was measured relative (rel.) to the maximal distance in the glomerular/mitral cell layer of the OB to correct for size differences. Each curve represents an average over experiments in three to five individual larvae. Error bars show SD.
The spatial organization of activity patterns was further analyzed by determining the responses profile of each unit to the three diagnostic odors (mixtures of amino acids, bile acids, and nucleotides). The similarity of response profiles was quantified by the correlation coefficient for all possible pairs of units and plotted against their distance (see Materials and Methods). The average correlation of response profiles declined with increasing distance between units, indicating that units with similar response profiles tended to be spatially concentrated. The steepness of this decline can be taken as a simple quantitative measure of the spatial mapping of chemical similarity. The decline of the average correlation with distance was similar for all developmental stages between 2.5 and 6 dpf (Fig. 9B). Hence, spatially concentrated responses to different stimulus classes were present early and persisted despite a substantial increase in the number of responding units. High-resolution three-dimensional imaging of activity patterns with a synthetic indicator therefore indicates that a spatial organization of odor-evoked activity in the OB is established already at 2.5 dpf, consistent with results from HuC::IP transgenic fish.
Discussion
Using anatomical and in vivo Ca2+ imaging techniques, we studied the early development of functional topographic maps in the OB of zebrafish. Anatomical results suggest that glomeruli differentiate gradually from precursor structures by local refinements and growth. Ca2+ imaging showed that a coarse spatial organization of activity patterns is established very early and maintained during the subsequent growth and development of neuronal circuits in the OB. The early establishment of a coarse chemotopic response map may be important for the function of the developing OB and for the progressive differentiation of glomeruli and activity maps.
Initial development of glomeruli
The presumptive OB of early zebrafish larvae contains axonal and dendritic condensations reminiscent of glomerular structures but different from glomeruli in the adult OB. Similar glomerular precursors have been described during the development of the insect antennal lobe (Oland et al., 1990) and the rodent OB (Valverde et al., 1992; Treloar et al., 1999; Conzelmann et al., 2001; Potter et al., 2001). These protoglomeruli are surrounded by densely packed MC somata.
Between 3 and 6 dpf, the mean number of identifiable protoglomeruli increased from 14.4 (18% of the number of identifiable glomeruli in the adult OB) (Baier and Korsching, 1994) to 26.8 (32%). The onset of expression of individual odorant receptors is asynchronous (Barth et al., 1996; Byrd et al., 1996; Argo et al., 2003) and, based on expression studies (Argo et al., 2003), is estimated to increase from ∼70 (64%) to ∼90 (82%; assuming a repertoire of 110 odorant receptor genes) between 3 and 6 dpf. Because individual zebrafish OSNs probably express only one dominant odorant receptor (Barth et al., 1997), each protoglomerulus must be innervated by multiple types of OSNs. Adult glomeruli, in contrast, are likely to be innervated by only one type of OSN as in rodents (Fuss and Korsching, 2001; Tabor et al., 2004). In time-lapse experiments, discrete neuropil structures were observed to emerge from larger protoglomerular precursors. We therefore hypothesize that the differentiation of glomeruli involves the refinement of protoglomerular neuropil into more distinct and specific glomerular structures. Consistent with this hypothesis, OSN axons in the mouse OB first form loose aggregates containing multiple types of OSNs before they segregate into smaller and discrete glomeruli (Conzelmann et al., 2001; Potter et al., 2001).
Odors already stimulate swimming behavior in zebrafish larvae immediately after hatching (Lindsay and Vogt, 2004). Consistent with these results, we first detected odor responses in the OB and telencephalon shortly before hatching (2.5 dpf). Hence, OSNs and central neuronal circuits are already functional when glomeruli are still poorly developed. Some odors evoked small or no responses at 2.5-3 dpf but substantial responses at 5 dpf, suggesting that the onset of expression of the odorant receptors detecting these odors occurs within this time window (Barth et al., 1996; Byrd et al., 1996; Argo et al., 2003). In adult zebrafish, the different stimuli of the panel used here activate different types of OSNs (Hansen et al., 2003) and either large or small glomeruli in the OB (Friedrich and Korsching, 1997, 1998). Because all stimuli evoked responses in larvae by 4 dpf, we hypothesize that protoglomeruli give rise to both small and large glomeruli in the adult OB. However, additional experiments involving the intermediate developmental stages are necessary to resolve this question.
Ca2+ imaging of odor-evoked activity in zebrafish larvae
Transgenic Ca2+ indicators are promising tools for the optical measurement of neuronal activity in vivo (Miyawaki et al., 1997; Nagai et al., 2001; Zemelman and Miesenbock, 2001), but their use in vertebrates has so far been limited (Higashijima et al., 2003; Hasan et al., 2004). Here, we measured odor-evoked activity patterns in the developing OB with the genetically encoded Ca2+ indicator IP. No Ca2+ signals were detected using YC 2.1 (data not shown), although fluorescence was strong and Ca2+ signals were observed in spinal cord neurons (Higashijima et al., 2003). The most likely explanation is that the dynamic range of IP matched the Ca2+ concentrations in OB neurons better than the dynamic range of YC.
One advantage of the genetically encoded Ca2+ indicator was that activity patterns could be measured repeatedly in the same fish during development, because no invasive dye application procedures were required. Another important advantage is the possibility of targeting neurons of interest. Compared with other methods for measuring neuronal population activity such as intrinsic signal imaging, field potential recordings, or functional magnetic resonance imaging, genetically encoded Ca2+ indicators can therefore provide enhanced cell-type specificity. In the HuC-transgenic lines used here, strong IP expression occurred in many, if not all, MCs, whereas GABAergic interneurons expressed the transgene only at low levels. The recorded fluorescence signals therefore reflected predominantly MC activity.
As expected, the signal (ΔF/F) amplitude and the signal-to-noise ratio was substantially lower for transgenic Ca2+ indicators than for synthetic indicators. High-resolution analysis of three-dimensional activity patterns was therefore performed with a synthetic Ca2+ indicator injected into the brain (Brustein et al., 2003; Stosiek et al., 2003). This method provided an excellent signal-to-noise ratio, and the simultaneously acquired GFP image permitted the localization of Ca2+ signals to OB layers.
Our analysis of activity patterns in the OB concentrated on their spatial structure. In adults, MC activity also exhibits temporal structure that arises from neuronal interactions in the OB and may contribute to the processing of odor information (Friedrich and Laurent, 2001; Friedrich et al., 2004). Most current imaging methods, including those used here, lack the temporal resolution to detect these dynamics. Additional experiments using other techniques such as electrophysiology are therefore necessary to study the temporal structure of odor-evoked activity in the developing OB.
Early establishment of a functional topographic map
Already at 2.5-3 dpf, amino acids and bile acids evoked activity predominantly in the lateral and medial OB, respectively. Hence, a coarse spatial organization of odor-evoked activity patterns, often referred to as chemotopy, is already established when larvae start to respond to odors and the OB is only beginning to develop.
Between 3 and 6 dpf, the pattern of protoglomeruli became refined, the number of responding units increased, and activity patterns became more complex (Fig. 8B,C), indicating that the neuronal circuitry in the OB changed. Concomitantly, new types of OSNs expressing additional odorant receptors have to be integrated (Barth et al., 1996; Byrd et al., 1996; Argo et al., 2003). Nevertheless, the coarse spatial organization of odor-evoked activity in the OB was maintained. Functional changes associated with the development of neuronal circuits did therefore not affect the coarse distribution of odor-evoked activity in the OB, suggesting that they were local in nature. The functional development of the OB probably continues for an extended period of time beyond the latest stages examined here (6 dpf). Yet, even in the adult OB, the spatial patterning of odor-evoked activity was similar to that observed in early larvae, suggesting that the development of the OB progresses in a local manner through adulthood.
High-resolution two-photon imaging demonstrated that the fine structure of activity patterns evoked by the same stimulus varied between animals. The coarse distribution of activity evoked by different stimulus classes was, however, consistent across individuals. Within a given OB, activity patterns evoked by individual compounds of the same chemical class were unique but overlapped substantially. Hence, odor information appears to be encoded in the larval OB in a combinatorial manner, similar to adults (Friedrich and Laurent, 2001; Friedrich and Stopfer, 2001).
Because the activity patterns measured here originated from OB neurons, they cannot be directly compared with previously measured activity patterns in adult zebrafish, because these originated from sensory inputs (Friedrich and Korsching, 1997). Unlike in sensory afferents of adult zebrafish, no evidence for a fine spatial map of chemical features was found in OB neurons of larvae stimulated with individual amino acids. One possible explanation for this result is that such a spatial organization does not exist at the level of MCs. Alternatively, a fine chemotopic organization of MC response patterns may arise later during development. Additional experiments on later larval stages and on adult zebrafish are necessary to resolve these questions.
Together, our anatomical and physiological results suggest that neuronal circuits in the OB develop by predominantly local refinements and elaborations of an initial state, as opposed to a possible large-scale reorganization of the OB. The initial establishment of a coarse spatial map of odorant properties may thus be necessary to ensure the correct topography of the adult functional map. A developmental process governed by local rearrangements would minimize the cost and logistic complexity necessary to establish the adult organization. In addition, it is possible that the coarse topographic map at the protoglomerular stage plays a role in the encoding or processing of odor information in the larval olfactory system, for example by providing an efficient spatial layout for lateral interactions between MCs responding to similar odors.
Footnotes
This work was supported by Deutsche Forschungsgemeinschaft Grants SFB 488 and GK 791 (R.W.F., J.L., J.A.M.), the Max-Planck-Society, the Boehringer Ingelheim Fonds (E.Y.), National Institutes of Health Grant NS26539 (J.R.F.), Wellcome Trust Grant 069903 (M.M.), and the Japan Society for the Promotion of Science (S.H.). We are grateful to G. Mandel for generous support and help with generating a transgenic fish line, to M. Ekker for generously providing the dlx4/6::GFP line, and to A. Miyawaki for providing the inverse pericam cDNA.
Correspondence should be addressed to Rainer W. Friedrich, Department of Biomedical Optics, Max-Planck-Institute for Medical Research, Jahnstrasse 29, 69120 Heidelberg, Germany. E-mail: Rainer.Friedrich@mpimf-heidelberg.mpg.de.
S. Higashijima's present address: National Institutes of Natural Sciences, Okazaki Institute for Integrative Bioscience, 5-1 Higashiyama, Myodaiji, Okazaki, Aichi 444-8787, Japan.
J. R. Fetcho's present address: Department of Neurobiology and Behavior, Cornell University, Mudd Hall, Ithaca, NY 14853.
Copyright © 2005 Society for Neuroscience 0270-6474/05/255784-12$15.00/0
J.L. and J.A.M. contributed equally to this work.
References
- Argo S, Weth F, Korsching SI (2003) Analysis of penetrance and expressivity during ontogenesis supports a stochastic choice of zebrafish odorant receptors from predetermined groups of receptor genes. Eur J Neurosci 17: 833-843. [DOI] [PubMed] [Google Scholar]
- Baier H, Korsching S (1994) Olfactory glomeruli in the zebrafish olfactory system form an invariant pattern and are identifiable across animals. J Neurosci 14: 219-230. [DOI] [PMC free article] [PubMed] [Google Scholar]
- Barth AL, Justice NJ, Ngai J (1996) Asynchronous onset of odorant receptor expression in the developing zebrafish olfactory system. Neuron 16: 23-34. [DOI] [PubMed] [Google Scholar]
- Barth A, Dugas JC, Ngai J (1997) Noncoordinate expression of odorant receptor genes tightly linked in the zebrafish genome. Neuron 19: 359-369. [DOI] [PubMed] [Google Scholar]
- Bozza TC, Kauer JS (1998) Odorant response properties of convergent olfactory receptor neurons. J Neurosci 18: 4560-4569. [DOI] [PMC free article] [PubMed] [Google Scholar]
- Brustein E, Marandi N, Kovalchuk Y, Drapeau P, Konnerth A (2003) “In vivo” monitoring of neuronal network activity in zebrafish by two-photon Ca2+ imaging. Pflügers Arch 446: 766-773. [DOI] [PubMed] [Google Scholar]
- Byrd CA, Jones JT, Quattro JM, Rogers ME, Brunjes PC, Vogt RG (1996) Ontogeny of odorant receptor gene expression in zebrafish, Danio rerio J Neurobiol 29: 445-458. [DOI] [PubMed] [Google Scholar]
- Charpak S, Mertz J, Beaurepaire E, Moreaux L, Delaney K (2001) Odor-evoked calcium signals in dendrites of rat mitral cells. Proc Natl Acad Sci USA 98: 1230-1234. [DOI] [PMC free article] [PubMed] [Google Scholar]
- Conzelmann S, Malun D, Breer H, Strotmann J (2001) Brain targeting and glomerulus formation of two olfactory neuron populations expressing related receptor types. Eur J Neurosci 14: 1623-1632. [DOI] [PubMed] [Google Scholar]
- Døving KB, Selset R, Thommesen G (1980) Olfactory sensitivity to bile acids in salmonid fishes. Acta Physiol Scand 108: 123-131. [DOI] [PubMed] [Google Scholar]
- Dynes JL, Ngai J (1998) Pathfinding of olfactory neuron axons to stereotyped glomerular targets revealed by dynamic imaging in living zebrafish embryos. Neuron 20: 1081-1091. [DOI] [PubMed] [Google Scholar]
- Edwards JG, Michel WC (2002) Odor-stimulated glutamatergic neurotransmission in the zebrafish olfactory bulb. J Comp Neurol 454: 294-309. [DOI] [PubMed] [Google Scholar]
- Friedrich RW, Korsching SI (1997) Combinatorial and chemotopic odorant coding in the zebrafish olfactory bulb visualized by optical imaging. Neuron 18: 737-752. [DOI] [PubMed] [Google Scholar]
- Friedrich RW, Korsching SI (1998) Chemotopic, combinatorial and non-combinatorial odorant representations in the olfactory bulb revealed using a voltage-sensitive axon tracer. J Neurosci 18: 9977-9988. [DOI] [PMC free article] [PubMed] [Google Scholar]
- Friedrich RW, Laurent G (2001) Dynamic optimization of odor representations in the olfactory bulb by slow temporal patterning of mitral cell activity. Science 291: 889-894. [DOI] [PubMed] [Google Scholar]
- Friedrich RW, Stopfer M (2001) Recent dynamics in olfactory population coding. Curr Opin Neurobiol 11: 468-474. [DOI] [PubMed] [Google Scholar]
- Friedrich RW, Habermann CJ, Laurent G (2004) Multiplexing using synchrony in the zebrafish olfactory bulb. Nat Neurosci 7: 862-871. [DOI] [PubMed] [Google Scholar]
- Fuss SH, Korsching SI (2001) Odorant feature detection: activity mapping of structure response relationships in the zebrafish olfactory bulb. J Neurosci 21: 8396-8407. [DOI] [PMC free article] [PubMed] [Google Scholar]
- Hansen A, Zeiske E (1993) Development of the olfactory organ in the zebrafish, Brachydanio rerio J Comp Neurol 333: 289-300. [DOI] [PubMed] [Google Scholar]
- Hansen A, Rolen SH, Anderson K, Morita Y, Caprio J, Finger TE (2003) Correlation between olfactory receptor cell type and function in the channel catfish. J Neurosci 23: 9328-9339. [DOI] [PMC free article] [PubMed] [Google Scholar]
- Hasan MT, Friedrich RW, Euler T, Larkum ME, Giese G, Both M, Duebel J, Waters J, Bujard H, Griesbeck O, Tsien RY, Nagai T, Miyawaki A, Denk W (2004) Functional fluorescent Ca2+ indicator proteins in transgenic mice under TET control. PLoS Biol 2: 763-775. [DOI] [PMC free article] [PubMed] [Google Scholar]
- Higashijima S, Okamoto H, Ueno N, Hotta Y, Eguchi G (1997) High-frequency generation of transgenic zebrafish which reliably express GFP in whole muscles or the whole body by using promoters of zebrafish origin. Dev Biol 192: 289-299. [DOI] [PubMed] [Google Scholar]
- Higashijima S, Masino MA, Mandel G, Fetcho JR (2003) Imaging neuronal activity during zebrafish behavior with a genetically encoded calcium indicator. J Neurophysiol 90: 3986-3997. [DOI] [PubMed] [Google Scholar]
- Johnson BA, Leon M (2000) Modular representations of odorants in the glomerular layer of the rat olfactory bulb and the effects of stimulus concentration. J Comp Neurol 422: 496-509. [DOI] [PubMed] [Google Scholar]
- Katz LC, Crowley JC (2002) Development of cortical circuits: lessons from ocular dominance columns. Nat Rev Neurosci 3: 34-42. [DOI] [PubMed] [Google Scholar]
- Lindsay SM, Vogt RG (2004) Behavioral responses of newly hatched zebrafish (Danio rerio) to amino acid chemostimulants. Chem Senses 29: 93-100. [DOI] [PubMed] [Google Scholar]
- Long JE, Garel S, Depew MJ, Tobet S, Rubenstein JL (2003) DLX5 regulates development of peripheral and central components of the olfactory system. J Neurosci 23: 568-578. [DOI] [PMC free article] [PubMed] [Google Scholar]
- Malnic B, Hirono J, Sato T, Buck LB (1999) Combinatorial receptor codes for odors. Cell 96: 713-723. [DOI] [PubMed] [Google Scholar]
- Malun D, Brunjes PC (1996) Development of olfactory glomeruli: temporal and spatial interactions between olfactory receptor axons and mitral cells in opossums and rats. J Comp Neurol 368: 1-16. [DOI] [PubMed] [Google Scholar]
- Mathieson WB, Maler L (1988) Morphological and electrophysiological properties of a novel in vitro preparation: the electrosensory lateral line lobe brain slice. J Comp Physiol [A] 163: 489-506. [DOI] [PubMed] [Google Scholar]
- Meister M, Bonhoeffer T (2001) Tuning and topography in an odor map of the rat olfactory bulb. J Neurosci 21: 1351-1360. [DOI] [PMC free article] [PubMed] [Google Scholar]
- Miyawaki A, Llopis J, Heim R, McCaffery JM, Adams JA, Ikura M, Tsien RY (1997) Fluorescent indicators for Ca2+ based on green fluorescent proteins and calmodulin. Nature 388: 882-887. [DOI] [PubMed] [Google Scholar]
- Mombaerts P, Wang F, Dulac C, Chao SK, Nemes A, Mendelsohn M, Edmondson J, Axel R (1996) Visualizing an olfactory sensory map. Cell 87: 675-686. [DOI] [PubMed] [Google Scholar]
- Nagai T, Sawano A, Park ES, Miyawaki A (2001) Circularly permuted green fluorescent proteins engineered to sense Ca2+ Proc Natl Acad Sci USA 98: 3197-3202. [DOI] [PMC free article] [PubMed] [Google Scholar]
- Nikonov AA, Caprio J (2001) Electrophysiological evidence for a chemotopy of biologically relevant odors in the olfactory bulb of the channel catfish. J Neurophysiol 86: 1869-1876. [DOI] [PubMed] [Google Scholar]
- Oland LA, Orr G, Tolbert LP (1990) Construction of a protoglomerular template by olfactory axons initiates the formation of olfactory glomeruli in the insect brain. J Neurosci 10: 2096-2112. [DOI] [PMC free article] [PubMed] [Google Scholar]
- Park HC, Kim CH, Bae YK, Yeo SY, Kim SH, Hong SK, Shin J, Yoo KW, Hibi M, Hirano T, Miki N, Chitnis AB, Huh TL (2000) Analysis of upstream elements in the HuC promoter leads to the establishment of transgenic zebrafish with fluorescent neurons. Dev Biol 227: 279-293. [DOI] [PubMed] [Google Scholar]
- Potter S, Zheng C, Koos DS, Feinstein P, Fraser SE, Mombaerts P (2001) Structure and emergence of specific olfactory glomeruli in the mouse. J Neurosci 21: 9713-9723. [DOI] [PMC free article] [PubMed] [Google Scholar]
- Ressler KJ, Sullivan SL, Buck LB (1994) Information coding in the olfactory system: evidence for a stereotyped and highly organized epitope map in the olfactory bulb. Cell 79: 1245-1255. [DOI] [PubMed] [Google Scholar]
- Sakata Y, Olson JK, Michel WC (2003) Assessment of neuronal maturation and acquisition of functional competence in the developing zebrafish olfactory system. Methods Cell Sci 25: 39-48. [DOI] [PubMed] [Google Scholar]
- Stenman J, Toresson H, Campbell K (2003) Identification of two distinct progenitor populations in the lateral ganglionic eminence: implications for striatal and olfactory bulb neurogenesis. J Neurosci 23: 167-174. [DOI] [PMC free article] [PubMed] [Google Scholar]
- Stewart WB, Kauer JS, Shepherd GM (1979) Functional organization of rat olfactory bulb analysed by the 2-deoxyglucose method. J Comp Neurol 185: 715-734. [DOI] [PubMed] [Google Scholar]
- Stosiek C, Garaschuk O, Holthoff K, Konnerth A (2003) In vivo two-photon calcium imaging of neuronal networks. Proc Natl Acad Sci USA 100: 7319-7324. [DOI] [PMC free article] [PubMed] [Google Scholar]
- Strotmann J, Conzelmann S, Beck A, Feinstein P, Breer H, Mombaerts P (2000) Local permutations in the glomerular array of the mouse olfactory bulb. J Neurosci 20: 6927-6938. [DOI] [PMC free article] [PubMed] [Google Scholar]
- Tabor R, Yaksi E, Weislogel JM, Friedrich RW (2004) Processing of odor mixtures in the zebrafish olfactory bulb. J Neurosci 24: 6611-6620. [DOI] [PMC free article] [PubMed] [Google Scholar]
- Treloar HB, Purcell AL, Greer CA (1999) Glomerular formation in the developing rat olfactory bulb. J Comp Neurol 413: 289-304. [PubMed] [Google Scholar]
- Treloar HB, Feinstein P, Mombaerts P, Greer CA (2002) Specificity of glomerular targeting by olfactory sensory axons. J Neurosci 22: 2469-2477. [DOI] [PMC free article] [PubMed] [Google Scholar]
- Uchida N, Takahashi YK, Tanifuji M, Mori K (2000) Odor maps in the mammalian olfactory bulb: domain organization and odorant structural features. Nat Neurosci 3: 1035-1043. [DOI] [PubMed] [Google Scholar]
- Valverde F, Santacana M, Heredia M (1992) Formation of an olfactory glomerulus: morphological aspects of development and organization. Neuroscience 49: 255-275. [DOI] [PubMed] [Google Scholar]
- Vassar R, Chao SK, Sitcheran R, Nunez JM, Vosshall LB, Axel R (1994) Topographic organization of sensory projections to the olfactory bulb. Cell 79: 981-991. [DOI] [PubMed] [Google Scholar]
- Wachowiak M, Cohen LB (2001) Representation of odorants by receptor neuron input to the mouse olfactory bulb. Neuron 32: 723-735. [DOI] [PubMed] [Google Scholar]
- Wachowiak M, Denk W, Friedrich RW (2004) Functional organization of sensory input to the olfactory bulb glomerulus analyzed by two-photon calcium imaging. Proc Natl Acad Sci USA 101: 9097-9102. [DOI] [PMC free article] [PubMed] [Google Scholar]
- Whitlock KE, Westerfield M (1998) A transient population of neurons pioneers the olfactory pathway in the zebrafish. J Neurosci 18: 8919-8927. [DOI] [PMC free article] [PubMed] [Google Scholar]
- Wilson SW, Ross LS, Parrett T, Easter Jr SS (1990) The development of a simple scaffold of axon tracts in the brain of the embryonic zebrafish, Brachydanio rerio Development 108: 121-145. [DOI] [PubMed] [Google Scholar]
- Xu F, Liu N, Kida I, Rothman DL, Hyder F, Shepherd GM (2003) Odor maps of aldehydes and esters revealed by functional MRI in the glomerular layer of the mouse olfactory bulb. Proc Natl Acad Sci USA 100: 11029-11034. [DOI] [PMC free article] [PubMed] [Google Scholar]
- Yu CR, Power J, Barnea G, O'Donnell S, Brown HE, Osborne J, Axel R, Gogos JA (2004) Spontaneous neural activity is required for the establishment and maintenance of the olfactory sensory map. Neuron 42: 553-566. [DOI] [PubMed] [Google Scholar]
- Zemelman BV, Miesenbock G (2001) Genetic schemes and schemata in neurophysiology. Curr Opin Neurobiol 11: 409-414. [DOI] [PubMed] [Google Scholar]
- Zerucha T, Stuhmer T, Hatch G, Park BK, Long Q, Yu G, Gambarotta A, Schultz JR, Rubenstein JL, Ekker M (2000) A highly conserved enhancer in the Dlx5/Dlx6 intergenic region is the site of cross-regulatory interactions between Dlx genes in the embryonic forebrain. J Neurosci 20: 709-721. [DOI] [PMC free article] [PubMed] [Google Scholar]
- Zou DJ, Feinstein P, Rivers AL, Mathews GA, Kim A, Greer CA, Mombaerts P, Firestein S (2004) Postnatal refinement of peripheral olfactory projections. Science 304: 1976-1979. [DOI] [PubMed] [Google Scholar]