

Abstract
The polycomb transcriptional repressor Bmi1 promotes cell cycle progression, controls cell senescence, and is implicated in brain development. Loss of Bmi1 leads to a decreased brain size and causes progressive ataxia and epilepsy. Recently, Bmi1 was shown to control neural stem cell (NSC) renewal. However, the effect of Bmi1 loss on neural cell fate in vivo and the question whether the action of Bmi1 was intrinsic to the NSCs remained to be investigated. Here, we show that Bmi1 is expressed in the germinal zone in vivo and in NSCs as well as in progenitors proliferating in vitro, but not in differentiated cells. Loss of Bmi1 led to a decrease in proliferation in zones known to contain progenitors: the newborn cortex and the newborn and adult subventricular zone. This decrease was accentuated in vitro, where we observed a drastic reduction in NSC proliferation and renewal because of NSC-intrinsic effects of Bmi1 as shown by the means of RNA interference. Bmi1-/- mice also presented more astrocytes at birth, and a generalized gliosis at postnatal day 30. At both stages, colocalization of bromodeoxyuridine and GFAP demonstrated that Bmi1 loss did not prevent astrocyte precursor proliferation. Supporting these observations, Bmi1-/- neurospheres generate preferentially astrocytes probably attributable to a different responsiveness to environmental factors. Bmi1 is therefore necessary for NSC renewal in a cell-intrinsic mode, whereas the altered cell pattern of the Bmi1-/- brain shows that in vivo astrocyte precursors can proliferate in the absence of Bmi1.
Keywords: cortex, p16, p19, neurogenesis, brain development, neural cell proliferation
Introduction
During embryogenesis, neural stem cells (NSCs) participate in brain formation. First, the NSC population expands. Next, NSCs generate successive waves of neural precursors in a temporal and coordinate manner (Zhu et al., 1999; Caviness et al., 2000); then starting at embryonic day 18 (E18), NSCs give rise to astrocytes and oligodendrocytes (Marmur et al., 1998). Throughout neurogenesis, the NSC pool is maintained by asymmetric stem cell divisions to generate one stem cell and one committed cell, whereas the initial expansion of NSCs necessitates symmetric divisions (Morrison et al., 1997). Several sets of genes are necessary to control NSC renewal by ensuring the maintenance of the nondifferentiated state, multipotency, survival, quiescence, and a long-term proliferation potential (for review, see Arsenijevic, 2003). Because Bmi1-deficient mice present a smaller brain after 2 weeks of age, a profound defect in cerebellum growth, and progressive neurological defects (van der Lugt et al., 1994), Bmi1 could play an important role in brain maintenance and regulate brain growth through the control of NSC proliferation. Bmi1 is a transcription factor of the polycomb group acting on the cell cycle by promoting entry into the S phase through p16ink4a inhibition. Another action of Bmi1 is the depletion of p53 expression through p19arf repression, leading to a decrease in apoptosis (Jacobs et al., 1999). Bmi1 regulates long-term renewal of fibroblasts (Jacobs et al., 1999) and was recently described to be essential for the renewal of adult hematopoietic stem cells (Park et al., 2003). It was demonstrated that Bmi1 loss leads to impairment in NSC proliferation and renewal (Molofsky et al., 2003). A recent study showed that Bmi1 is crucial in the expansion of cerebellar granular cells both in vivo and in vitro (Leung et al., 2004). However, the effect of Bmi1 loss in other brain regions remains to be addressed, as well as the question whether the action of Bmi1 is intrinsic to the NSCs or attributable to the stem cell niche.
Here, we show that Bmi1 is expressed in the subventricular zone (SVZ) and in vitro in cortical NSCs as well as in progenitor cells. We observed a decreased proliferation in the cortex at birth as well as in the newborn and adult SVZ of Bmi1-/- mice. In accordance with these results, NSCs showed a failure in self-renewal in vitro. Our results also demonstrate that some environmental factors can partially compensate for Bmi1 loss of function. Additionally, using an RNA interference approach, we provide evidence that the effect of Bmi1 is intrinsic to NSCs and not resulting from surrounding cells (i.e., the stem cell niche). Concerning the cell population of the Bmi1-/- brain, we observed an increased number of astrocytes at birth and a generalized gliosis at postnatal day 30 (P30). The increased astrocytic population appeared to proliferate normally, as assessed by bromodeoxyuridine (BrdU) incorporation. Together, our data show that Bmi1 is intrinsically required for NSC renewal, leading to a reduced proliferation in vivo and to an increased astroglial population that retains the ability to proliferate.
Materials and Methods
Animals. The breeding and genotyping of Bmi1+/+, Bmi1+/-, and Bmi1-/- mice, on an FVB inbred genetic background, have been handled as described previously (Jacobs et al., 1999).
Brain size evaluation, cell count, and statistics. To evaluate whether a difference in brain size exists between the genotypes at birth, we measured the cross-sectional area of the cortex, the striatum, and the SVZ on four coronal sections per animal (n = 4 animals per genotype) taken from the telencephalon [corresponding to 1.0, 0.7, 0.5, and 0.2 mm from bregma in the adult brain, as defined in the mouse brain atlas by Hof et al. (2000)] using the SIS (Münster, Germany) image analysis system. The mean cross-sectional areas were calculated from these four samples and compared between genotypes. The surface of the cortex was measured from the anterior cingulated cortex to the upper limit of the piriform cortex, and from the corpus callosum and the external capsule to the cortical layer 1 included. For the striatum, we measured the surface including the caudate-putamen and the nuclei accumbens (core and shell). Concerning cell count, BrdU-positive or terminal deoxynucleotidyl transferase-mediated biotinylated UTP nick end labeling (TUNEL)-positive cells were counted in four 15-μm-thick cryosections with the same brain coordinates as described for the evaluation of brain surfaces. To quantify the number of labeled cells in the SVZ, the corpus callosum, and the cortex, the entire region investigated on the section was taken into account. We quantified BrdU- and TUNEL-positive cells in the same regions as defined for the cross-sectional area measures. Because no differences of brain size between genotypes were observed, we expose the data as the mean number of positive cells per section (mean of the four slices) for each analyzed region. The cell count in the corpus callosum included the genu (for the anterior part), the cingulum bundle, and the external capsule. For cell counts in the adult brains, three sections were analyzed at 0.5, 0.7, and 0.9 mm from bregma. Concerning the striatum and cortex, the GFAP-positive cells were counted in 10 random 40× fields, with colocalization with a 4′,6-diamidino-2-phenylindole (DAPI)-positive nucleus as the criterion to identify countable GFAP+ cells. For all stainings on histological sections, the counted cell numbers per section were corrected using Abercrombie's correction factor (Abercrombie, 1946), defined as M/(M + L), where M is the thickness of the section (15 μm) and L is the mean height (diameter) of the counted nuclei (Abercrombie, 1946). L was measured from several randomly selected 40× fields with an Olympus (Tokyo, Japan) BX60 optical microscope using the SIS image analysis system. Typically, >100 nuclei were measured for each staining (BrdU, TUNEL, GFAP, and BrdU/GFAP), each genotype, each region, and each age analyzed. The significance of the results for the cell counts in vivo and in vitro was assessed by calculating p values with a two-way ANOVA test when three groups were compared or by an unpaired t test when two groups were analyzed. Results are presented as mean ± SEM. The number of animals and the p values are specified here for each analysis.
Dissection and primary culture. The cerebral cortex was dissected and removed from newborn (P0-P1) or E14 mice. The dissection included all of the dorsal part of the ventricular zone and the SVZ of Bmi1+/+, Bmi1+/-, and Bmi1-/- mice and was processed as described previously (Arsenijevic et al., 2001b). Dissociated cells were grown in the presence of epidermal growth factor (EGF; 20 ng/ml; Peprotech, Rocky Hill, NJ) in 96-well plates (Nunc, Naperville, IL) at a concentration of 5000 cells per well in 200 μl of medium, corresponding to a density of 15,000 cells/cm2. The number of spheres was counted after 8-10 d in vitro (DIV). Six to eight wells were counted for each animal tested.
Renewal and differentiation assays. To evaluate the self-renewal capacity of progenitor cells, individual spheres were transferred into new 96-well plates with 200 μl of growth medium (one sphere per well), visually checked, and mechanically dissociated. Secondary neurospheres were counted after 8-10 DIV. Sphere differentiation was performed as described previously (Arsenijevic et al., 2001b) with indication here of the specific substrates used.
Bmi1 silencing experiments. We designed a morpholino oligonucleotide (Gene Tools, Philomath, OR) to bind the Bmi1 mRNA, and a missense control morpholino oligonucleotide, with the following sequences: 5′-GCATTTCTGCTTGATAAAAGATCCC-3′ and 5′-GgATTgTGCTTcATAAAAcATgCC-3′, respectively. For both primary cultures and renewal assays, we plated the cells as described above, adding 0.2-0.7 μm morpholino or missense and EPEI, removing the mix after an incubation of 3 h at 37°C, and replacing it with fresh growth medium. HIV-BmiRNAi-GFP was generated by inserting the cassette containing the H1 promoter and the Bmi target sequence from pRETRO-SUPER-Bmi in front of the green fluorescent protein (GFP) expression cassette of HIV-CS-CG (Bmi1 target sequence and cloning details are available on request). Lentiviruses were produced as described previously (Naldini et al., 1996) and added to cells dissociated from primary neurospheres, 1 d after dissociation. Cells were plated at low density (15,000 cells/cm2). Because transgene expression occurs in ∼48 h and NSC division in 72 h, we can expect that the Bmi1 silencing vectors act directly in the NSCs. In another experimental paradigm, performed at higher cell density (50,000 cells/cm2), lentiviral infection was performed at 3 DIV, and the spheres were transferred at 9 DIV onto poly-ornithin- and laminin-treated coverslips for 24 h to be fixed with 4% paraformaldehyde (PAF) at 10 DIV after a treatment with the annexin V-cyanine 3 apoptosis detection kit (Biovision, Mountain View, CA) following the manufacturer's instructions.
RNA extraction and reverse transcription-PCR. RNA was isolated from freshly dissociated neurospheres, reverse transcribed, and amplified with a previously described method (Jacobs et al., 1999). The primer pair used for the amplification of the Bmi1 mRNA was 5′-CAGCAATGACTGTGATGC-3′ (sense) and 5′-CTCCAGCATTCGTCAGTC-3′ (antisense). The glyceraldehyde-3-phosphate dehydrogenase (GAPDH) reverse transcription (RT)-PCR was performed as a control, with the primer pair for GAPDH being 5′-ACCACAGTCCATGCCATCAC-3′ (sense) and 5′-TCCACCACCCTGTTGCTGTA-3′ (antisense).
BrdU labeling and TUNEL detection. Anti-BrdU staining was performed on cryostat brain slices from newborn mice that received intraperitoneal injections of BrdU (65 μg/g body weight; Boehringer Mannheim, Mannheim, Germany) 30 min before being killed or at E18 by intraperitoneal injection into the pregnant mother. For proliferation analysis in adult mice, BrdU was injected at P28 and P29, then the mice were perfusion fixed at P30 for histological analysis. BrdU incorporation was detected using the protocol from the proliferation detection kit (Boehringer Mannheim) with the antibody listed below. Only bright cells were counted. TUNEL was performed on cryostat newborn brain slices with the DeadEnd Colorimetric TUNEL System (Promega, Madison, WI) following the manufacturer's directions. Counting of cells positive for BrdU or the TUNEL assay was undertaken with a double- blind method. Mouse codes were hidden until after the final count.
Immunocytochemistry and histochemistry. For GFAP, neuron-specific nuclear protein (NeuN), and nestin labeling, cryostat slices were first blocked with 10% normal goat serum (NGS) and 0.3% Triton X-100 in PBS for 1 h at room temperature, and then primary antibodies were incubated overnight at 4°C. For oligodendrocyte marker (O4) labeling, slices were treated with 10% NGS without Triton X-100. For Bmi1 labeling, after the blocking treatment, the primary antibody was incubated for 48 h at 4°C. Secondary antibodies were incubated for 1 h at room temperature. DAPI staining was performed by incubating the sections with the DAPI solution (see below) for 10 min. All slides were rinsed three times with PBS after, respectively, primary antibody, secondary antibody, and DAPI incubations. For cultured cell labeling, cells were first fixed with 4% PAF for 20 min and processed as described previously (Arsenijevic et al., 2001b), with the following modifications for the anti-Bmi1 and anti-Lex antibody incubations: the anti-Bmi1 antibody was incubated for 48 h at 4°C, and the anti-Lex antibody was used without detergent.
Antibodies. Primary antibodies for indirect immunochemistry included the following: mouse IgG monocolonal anti-β-tubulin iso-type III antibody (1:1000; Sigma, Buchs, Switzerland), rabbit anti-GFAP antiserum (1:400; Dako, High Wycombe, UK), mouse IgM monoclonal anti-O4 antibody (1:50; Chemicon, Temecula, CA), mouse IgG monoclonal anti-BrdU antibody RPN202 (1:3; Amersham Biosciences, Buckingamshire, UK), mouse F6 monoclonal anti-Bmi1 antibody (1:40) (Alkema et al., 1997), rabbit polyclonal antinestin antibody 130 (1:500; a generous gift from R. D. G. McKay, National Institutes of Health, Bethesda, MD) (Tohyama et al., 1992), and mouse IgM monoclonal anti-LeX antibody (1:200; BD Biosciences, Franklin Lake, NJ). The secondary antibodies (Jackson ImmunoResearch, West Grove, PA) were as follows: cyanine-conjugated, affinity-purified goat antibody to mouse IgG (1:1000), FITC-conjugated affinity-purified goat antibody to mouse IgG (1: 100), and 7-amino-4-methylcoumarin-3-acetic acid- or cyanine-conjugated, affinity-purified goat antibody to mouse IgM (1:100 and 1:400, respectively). DAPI (0.3 μm; Molecular Probes, Eugene, OR) was used for counterstaining.
Results
Bmi1 and body growth
The loss of Bmi1 has no significant consequence on body weight at birth, as reported previously (van der Lugt et al., 1994; Molofsky et al., 2003), with the mean body weight 1.36 ± 0.10, 1.43 ± 0.09, and 1.40 ± 0.09 g, respectively for Bmi1-/-, Bmi1+/-, and Bmi1+/+ newborn mice (n = 6). It is important to underscore that the forebrain of newborn Bmi1-/- mice also is not different in size at birth compared with the other genotypes, whereas it is decreased in the young adult Bmi1-/- mice only. Indeed, at birth, the cross-sectional area of several regions of the telencephalon measured at four different levels (see Materials and Methods) showed no significant variation between genotypes (supplemental Fig. 1, available at www.jneurosci.org as supplemental material). The cortex, striatum, corpus callosum, and SVZ showed no significant differences between groups, indicating that the reduced brain size observed in adults (van der Lugt, 1994; Molofsky et al., 2003; Leung et al., 2004) is a defect of postnatal development. After birth, we observed an important impairment of body growth resulting, at 30 d of age, in a deficit of ∼50% in the knock-out mice compared with the Bmi1+/- mice (9.5 ± 0.7 and 20 ± 0.4 g, respectively; n = 3; p < 0.001), consistent with previous results (van der Lugt et al., 1994; Molofsky et al., 2003; Leung et al., 2004).
Bmi1 is expressed in nondifferentiated cells
To analyze the expression of Bmi1 in the newborn brain, we performed an immunohistochemical staining with an antibody directed against the Bmi1 protein on P0 brain slices from FVB Bmi1+/- mice (no differences of Bmi1 expression were observed between heterozygote and wild-type mice). Bmi1 was mainly expressed around the ventricles in the SVZ, the germinal zone of the newborn brain (Fig. 1a-c). The majority of the Bmi1-positive cells were located in the dorsomedial corner of the SVZ (47%; n = 2 animals). Few positive cells were present in the cortex (9%). Others (37%) formed a continuous chain of cells in the direction of the septum. The remaining 6% were located in the rest of the SVZ and in the corpus callosum. This pattern of expression shows that Bmi1 is mainly expressed in regions known to contain NSCs and multipotent precursors in mammalian brains (Morshead et al., 1994; Doetsch et al., 1999; Arsenijevic et al., 2001a). To better characterize Bmi1-expressing cells, we analyzed its expression in neurospheres, knowing that such colonies contain both NSCs and progenitor cells. In vitro, Bmi1 staining was observed in the nucleus of undifferentiated cells (Fig. 1e), as well as in few GFAP-expressing cells (data not shown). The presence of Bmi1 in progenitor cells was confirmed by RT-PCR analyses of Bmi1 mRNAs in cortical neurospheres (Fig. 1d). Neurospheres derived from Bmi1+/- mice were strongly positive for the presence of Bmi1 mRNAs (Fig. 1) (n = 2 cell preparations). Moreover, when we quantified the percentage of cells in a neurosphere able to generate new neurospheres and the percentage of cells expressing Bmi1 in the same neurosphere, we observed that the majority of the cells express Bmi1 (59 ± 5.6%) but only 17.5 ± 3.5% can self-renew (Fig. 1g). We observed an enhanced Bmi1 expression when the neurospheres were plated on fibronectin in the presence of EGF (Fig. 1) (data not shown). Only rare cells did not express Bmi1. Interestingly, spheres plated on the same substrate expressed markedly, and in numerous cells, the LeX carbohydrate (supplemental Fig. 2, available at www.jneurosci.org as supplemental material) known to be present in NSCs and some other progenitors (Capela and Temple, 2002). However, LeX expression is mainly restricted to the core of the neurosphere. Moreover, it appears that Bmi1 is expressed in both LeX-positive and LeX-negative cells. These results suggest that although Bmi1 is expressed in NSCs, its expression is not absolutely restricted to NSCs but also occurs in a subpopulation of committed precursor cells.
Figure 1.

Bmi1 is expressed in progenitor cells.a, c, Immunolabeling of the Bmi1 antigen (red) in the dorsomedial corner of the SVZ of a Bmi1+/- mouse. b, DAPI staining shows that Bmi1 is preferentially expressed in the germinal zone. VZ, Ventricular zone. d, Bmi1 mRNA expression in cortical neurospheres of newborn Bmi1+/- mice revealed by RT-PCR. Cx, Cortical neurospheres, passage 2; St, embryonic striatal neurospheres, passage 2; C, control. Bmi1 is expressed by nondifferentiated progenitor cells. After sphere growth, the sphere was plated onto fibronectin in the presence of EGF and fixed 24 h later. The great majority of nestin-positive cells (green labeling) were also positive for the Bmi1 antigen (red). Arrows point to cells devoid of Bmi1 labeling (e); the same cells were counterstained with DAPI (blue; f). g, Bmi1 is not a specific marker of stem cells. Single neurospheres were dissociated: one-half of the cells of each tested sphere were rapidly processed for Bmi1 immunolabeling, whereas the rest of the cells were tested for their ability to generate secondary neurospheres. The relationship between the number of generated spheres and the number of Bmi1-positive cells is plotted in the graph in g. Magnification: a, b, 200×; c, e, f, 400×.
Bmi1 loss affects NSC/progenitor cell proliferation in vivo
We next investigated whether Bmi1 has an action on cortical histogenesis, by controlling cell proliferation or apoptosis in vivo. To test the first possibility, we quantified the number of proliferating cells in the brain at birth after giving newborn mice injections of the thymidine analog BrdU 30 min before being killed. We analyzed the SVZ (Fig. 2a), the corpus callosum, and the developing cortex (Fig. 2b) at four different locations, between the septo-striatal and the septo-diencephalic sections (see Materials and Methods). We observed a significant reduction (by ∼64%) in BrdU-positive cells in the Bmi1-/- cortex compared with both Bmi1+/+ and Bmi1+/- (Fig. 2c). The dorsolateral corner of the SVZ also presented a diminished proliferation compared with heterozygous mice, but only a trend was observed when compared with wild-type mice. Other regions investigated (the SVZ and corpus callosum) did not show significant differences between genotypes (Fig. 2c). Note that no region showed a significant variation between wild-type and Bmi1+/- mice. P30 mice that received two injections of BrdU (at P28 and P29) showed a significant decrease in BrdU+ cells in the Bmi1-/- dorsolateral corner of the SVZ, a zone known to contain NSCs and neural progenitors (Fig. 2d) (64.2 ± 4.6 and 53.5 ± 1.5 BrdU+ cells, respectively, in the control and Bmi1-/- SVZ; p < 0.05; n = 3 animals). Because the knock-out mice are two times smaller at this stage, this decrease obviously disappears if one presents the results in function of the animal size. The loss of Bmi1 action may also have affected other developmental cues such as cell survival. To quantify apoptotic cells, we investigated the presence of the cells that had undergone DNA fragmentation by performing the TUNEL assay. We analyzed the same regions as for the BrdU incorporation but found no significant difference between Bmi1+/+, Bmi1+/-, and Bmi1-/- mice (supplemental Fig. 3, available at www.jneurosci.org as supplemental material). These results show that only a subpopulation of cells is affected by Bmi1 loss in vivo during the perinatal period. However, the loss of Bmi1 function produced a defect in proliferation, which may well explain the smaller brain size of the young Bmi1 knock-out mice (van der Lugt et al., 1994; Molofsky et al., 2003; Leung et al., 2004).
Figure 2.

Analysis of cell proliferation in newborn brain as a function of Bmi1 expression. Proliferating cells were identified using BrdU incorporation and analyzed in the cortex, the corpus callosum, the SVZ, the dorsolateral corner of the SVZ, and the ventricular zone. a, b, Anti-BrdU labeling (red) in the SVZ (a) and in the cortex (b) of a Bmi1+/- mouse. Note that proliferating cells are homogenously and densely distributed around the ventricle, whereas dividing cells in the cortex are very dispersed. Magnification: a, 100×; b, 200×. c, Quantification of the BrdU+ cells in the telencephalic regions described above (see Materials and Methods). WT, Wild type; HET, Bmi1+/-; KO, Bmi1-/-. The asterisk indicates the regions where a significant difference was observed between Bmi1-/- and Bmi1+/+ or Bmi1+/- mice in the cortex (n = 3 Bmi1+/+ mice; n = 6 Bmi1+/- mice; n = 6 Bmi1-/- mice; p = 0.028) and between Bmi1-/- and Bmi1+/- in the dorsomedial corner of the SVZ (p = 0.034). d, Quantification of the BrdU+ cells in the dorsolateral corner of the adult SVZ (at P30; n = 3; p < 0.05). *p < 0.05. CX, Cortex; CC, corpus callosum; SVZc, dorsolateral corner of the subventricular zone; VZ, ventricular zone; MZ, marginal zone; CTRL, control; KO, knock-out. Error bars represent SEM.
Effect of Bmi1 loss on NSC proliferation
Next we aimed to investigate whether the defect of cell proliferation in the cortex was linked to an impaired activity of NSCs as a result of Bmi1 loss. To assess the quantity of cortical NSCs present in Bmi1+/+, Bmi1+/-, and Bmi1-/- mice, we used a standard stem cell proliferation assay (Reynolds et al., 1992; Arsenijevic et al., 2001b): at low cell density, NSCs proliferate in vitro in the presence of EGF to form colonies termed neurospheres. Because one neurosphere originates from one single cell, as demonstrated previously by clonal analysis (Reynolds and Weiss, 1996) or by culturing at low cell density (Tropepe et al., 1999), the number of neurospheres obtained then allows estimating the number of NSCs. Under EGF stimulation, cortical NSCs renew (at least 20 passages in our hands) and are multipotent, as described previously (Marmur et al., 1998). Cortical cells from the germinal zone to the mantle zone were isolated from newborn (P0) Bmi1+/+ mice and cultured at low density (see Materials and Methods) in the presence of EGF. They gave rise to 10-fold more neurospheres than cells derived from the Bmi1-/- cortex (p = 0.0001; n = 4 animals for wild type and knock-out; n = 6 animals for Bmi1+/-) (Fig. 3a). Note that Bmi1+/- cultures behaved very similarly to wild type. The majority of Bmi1-/- spheres appeared within the same time frame as Bmi1+/+ and Bmi1+/- spheres. One month after the initial sphere growth, few Bmi1-/- spheres enlarged, but the majority of the spheres remained at the same diminished size, indicating that Bmi1 loss altered neurosphere formation and NSC proliferation. This suggests that the number of NSCs in the cerebral cortex is strongly depleted in the Bmi1-/- animals. To test this hypothesis, we isolated NSCs at E14, before the large expansion of postnatal brain growth. Remarkably, Bmi1-/- embryos also presented fewer neurospheres in vitro compared with heterozygous embryos [Bmi1+/-, 10 ± 2 spheres per 5000 cells (2 ± 0.4 NSCs per 1000 primary cortical cells); Bmi1-/-, 0.6 ± 0.3 spheres per 5000 cells; p = 0.005)] (Fig. 3c). Because the cortex developed almost normally (see below) from E14 to P0, this suggests that a compensatory signal may exist that helps to maintain the NSC pool in vivo. Indeed, when primary E14 Bmi1-/- cortical cells were cultivated at high density (150,000 cells/cm2), 5.6-fold more spheres were generated in vitro compared with cells cultivated at low cell density (15,000 cells/cm2); the frequency of NSCs per 1000 primary cortical cells was, respectively, 0.7 ± 0.12 and 0.125 ± 0.056 (p = 0.004; n = 3 different cultures). These experiments show that the high cell density environment might provide a signal of an as yet unknown mitogen/survival or anti-stress factor, which could play a role in the attenuation of the phenotype observed in vivo. However, besides this moderate rescue, the Bmi1-/- EGF-responsive NSCs are still significantly impaired even at these higher cell densities compared with Bmi1+/- NSCs (2 ± 0.4 NSCs per 1000 primary cortical cells at low cell density).
Figure 3.

Newborn Bmi1-/- mice possess few NSCs. A stem cell proliferation assay was applied to Bmi1+/+ and Bmi1-/- newborn (a) or E14 (c) cerebral cortex primary cultures. Note the decreased primary neurosphere formation capacity of Bmi1-/- cortical cells. Secondary neurospheres formed from Bmi1+/+ and Bmi1-/- dissociated single spheres (b, d) are shown. Quantification of the effect of Bmi1 deletion on the cortical NSC renewal reveals a markedly decreased capacity of sphere formation (b, d). a, c, The columns show the mean number of neurospheres obtained from 5000 plated cells (n = 4-6 animals per group) of P0 (PN0) and E14 mice, respectively. b, d, The columns show the mean number of secondary neurospheres per dissociated primary neurosphere (n = 30 primary neurospheres for Bmi1+/+; n = 19 for Bmi1-/-; n = 41 for Bmi1+/-) of P0 and E14 mice, respectively. *p = 0.001; **p < 0.0001. WT, Wild type; HET, Bmi1+/-; KO, Bmi1-/-. Error bars represent SEM.
Bmi1 is essential for cortical NSC renewal in vitro
To test the self-renewal capacity of P0 NSCs, single spheres were dissociated and plated with EGF to form secondary neurospheres. We observed a drastic decrease of self-renewal for Bmi1-/- neurospheres: although wild-type and heterozygous primary neurospheres gave rise to a mean of 155 ± 27 and 118 ± 25 secondary neurospheres, respectively, Bmi1-/- primary neurospheres showed an almost complete failure to produce secondary neurospheres, with a mean of 0.2 ± 0.12 per dissociated neurosphere (p < 0.0001; n = 30 neurospheres from four animals for Bmi1+/+; n = 19 neurospheres from four animals for Bmi1-/-; n = 41 neurospheres from six animals for Bmi1+/-) (Fig. 3b). Moreover, the percentage of spheres able to renew is markedly diminished in Bmi1-/- mice: only 10% of the spheres generated a secondary sphere(s) compared with 87% for wild-type and 83% for heterozygous spheres. We also observed that both primary and secondary Bmi1-/- neurospheres were smaller (62 ± 3.2 μm; n = 20) than those obtained from wild-type (140 ± 6.3 μm; n = 38) and heterozygous littermates (125 ± 10 μm; n = 21). Similar results were obtained with E14 neurospheres: one Bmi1+/- neurosphere generated a mean of 115 ± 15.8 new spheres after dissociation (n = 50 spheres from four animals), and one Bmi1-/- neurosphere generated a mean of 0.4 ± 0.12 new spheres after dissociation (n = 60; 4 animals; p < 0.0001) (Fig. 3d). Ninety-eight percent of Bmi1+/- neurospheres renew, whereas only 25% of the Bmi1-/- neurospheres generated secondary spheres. These results also show that E14 Bmi1-/- cortical NSCs have a greater capacity to renew compared with P0 Bmi1-/- NSCs (25% vs 10%).
Bmi1 acts on NSC in a cell-intrinsic mode
To further assess that Bmi1 directly controls stem cell renewal in a cell-autonomous manner, we infected neural progenitors with a lentivirus expressing a hairpin Bmi1-small interfering RNA (siRNA) followed by a GFP marker transgene, to stably down-regulate Bmi1 mRNA levels. The siRNA lentivirus expressed the transgene 48 h after infection, and here after plating, when the first NSC divisions take place. When we infected low cell density Bmi1+/- cultures at passage 4, the Bmi1-siRNA reduced by 65% the number of multipotent progenitors able to form new colonies (Fig. 4m) compared with control cells (GFP lentivirus). The downregulation of Bmi1 protein expression was verified by immunocytochemistry on small spheres infected at 4 DIV and checked 5 d later (Fig. 4a-h). The percentage of GFP-positive cells expressing Bmi1 ranged from 48 to 49% in Bmi1-siRNA-treated cultures and from 86 to 92% in control cultures infected with a CMV (cytomegalovirus) promoter-GFP lentivirus. Annexin V staining showed that Bmi1-siRNA treatment did not induce cell death compared with control treatments (Fig. 4i-l). Reduction in the colony number formation was also observed using antisense morpholinos (Fig. 4m). Together, these studies demonstrate that Bmi1 intrinsically controls their self-renewal capacity.
Figure 4.
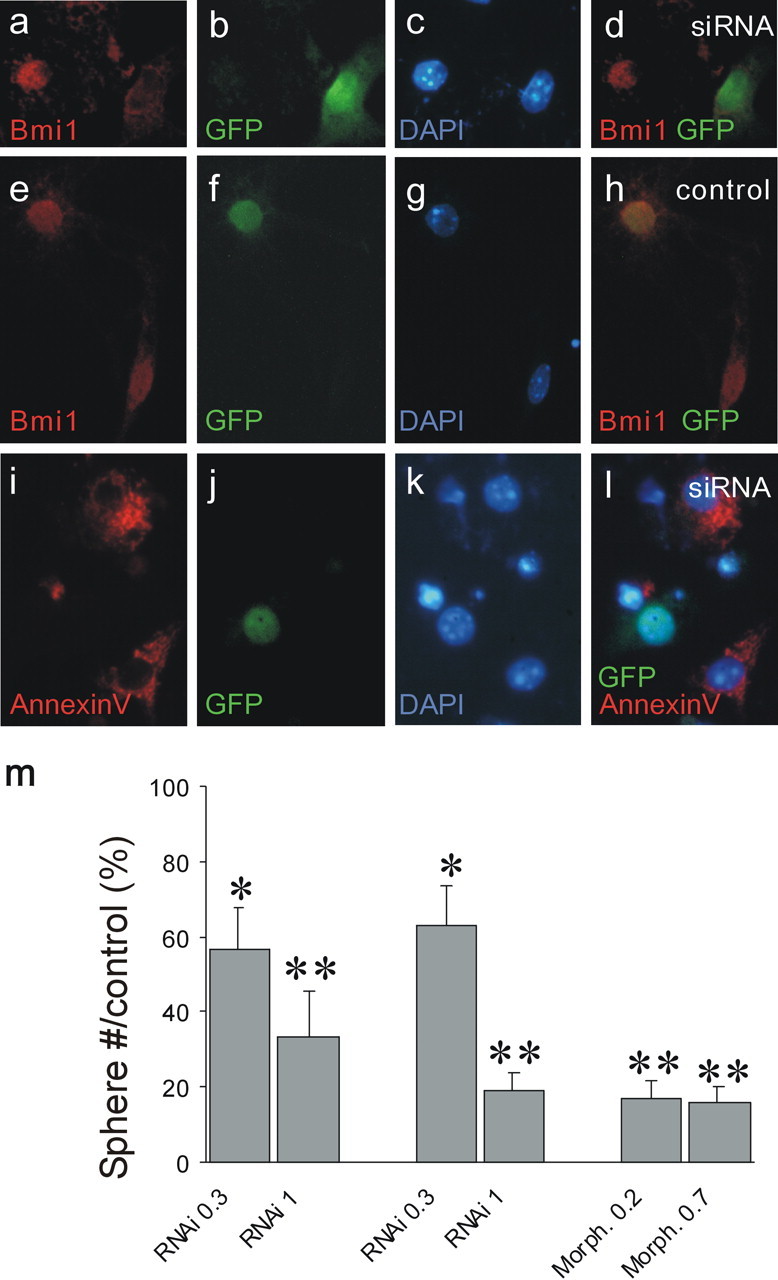
Inhibition of Bmi1 expression by Bmi1-siRNA lentivirus prevents sphere formation. To assess whether Bmi1-siRNA lentivirus blocks Bmi1 expression, small heterozygous spheres were infected with Bmi1-siRNA lentivirus or GFP lentivirus after a growth of 4 DIV and then fixed 5 d later. a-d, Immunolabeling for Bmi1 (red; a) and GFP (green; b) after Bmi1-siRNA lentivirus treatment. Note the reduction of Bmi1 labeling in the GFP-positive cell, infected with the lentivirus encoding the Bmi1-siRNA and the GFP transgene, compared with the noninfected GFP-negative cell. c, DAPI staining of a and b. d, Merged image of a and b. e-h, Immunolabeling for Bmi1 (red; e) and GFP (green; f) after control GFP lentivirus treatment. Note that the GFP-positive cell still expresses Bmi1 (h). g, DAPI staining of e and f. h, Merged image of e and f. i-l, Bmi1-siRNA lentivirus treatment does not induce cell death, as assessed by GFP (expressed by cells infected with the Bmi1-siRNA lentivirus; see Materials and Methods and Results) and annexin V staining. i, Annexin staining (red) on Bmi1-siRNA-treated cortical cell cultures. j, GFP staining (green). k, DAPI staining of i and j. l, Merged image of i-k. Note that the GFP-positive cell is not stained by annexin V. Magnification, 400×. m, Dissociated cortical neurospheres infected with a Bmi1-siRNA lentivirus (0.3 or 1 μl of viral preparation, corresponding to 10 and 30 ng of p24, respectively) or incubated with Bmi1 antisense morpholinos (Morph.) (0.2 or 0.7 μm) significantly reduced neurosphere formation. *p < 0.05 and **p < 0.001 compared with control groups. RNAi, RNA interference.
Bmi1 loss leads to an increase in GFAP+ astrocytes in vivo at birth
We next investigated whether the cellular constitution of the brain is affected by loss of Bmi1. In the perinatal cortex, NSCs give rise mainly to astrocytes (Marmur et al., 1998; Levers et al., 2001). Therefore, we performed anti-GFAP labeling to reveal the astrocyte population. Newborn Bmi1-/- mice showed a stronger GFAP expression and a fivefold higher number of GFAP-positive cells than Bmi1+/- in the marginal zone of the dorsal cortex (46.5 ± 12.9 and 9.3 ± 4.3 astrocytes per section, respectively; p = 0.013; dorsal and temporal cortices together, 229.7 ± 62.8 and 107 ± 36.9 astrocytes per section, respectively in Bmi1-/- and Bmi1+/- mice; p = 0.087) (Fig. 5). The increased number of astrocytes at birth led us to investigate whether it was attributable to an early differentiation of neural progenitor cells into astrocytes, or if it was caused by increased progenitor proliferation. We injected BrdU intraperitoneally into the pregnant mother at E18, killed the pups at P0, and stained the brain slices for BrdU and GFAP. We counted only the GFAP-positive astrocytes presenting an identifiable nucleus, and we observed a strong colocalization of the two markers in both control and Bmi1-/- mice. A total of 49.1 ± 1.9 and 49.1 ± 2.9% of the GFAP+ astrocytes in the mantle zone were strongly BrdU+, respectively (n = 3 animals per genotype) (Fig. 5). Thus, although the number of the astrocytes in the mantle zone at P0 was increased in Bmi1-/- animals (Fig. 5), the percentage of proliferating GFAP-positive cells appeared normal.
Figure 5.
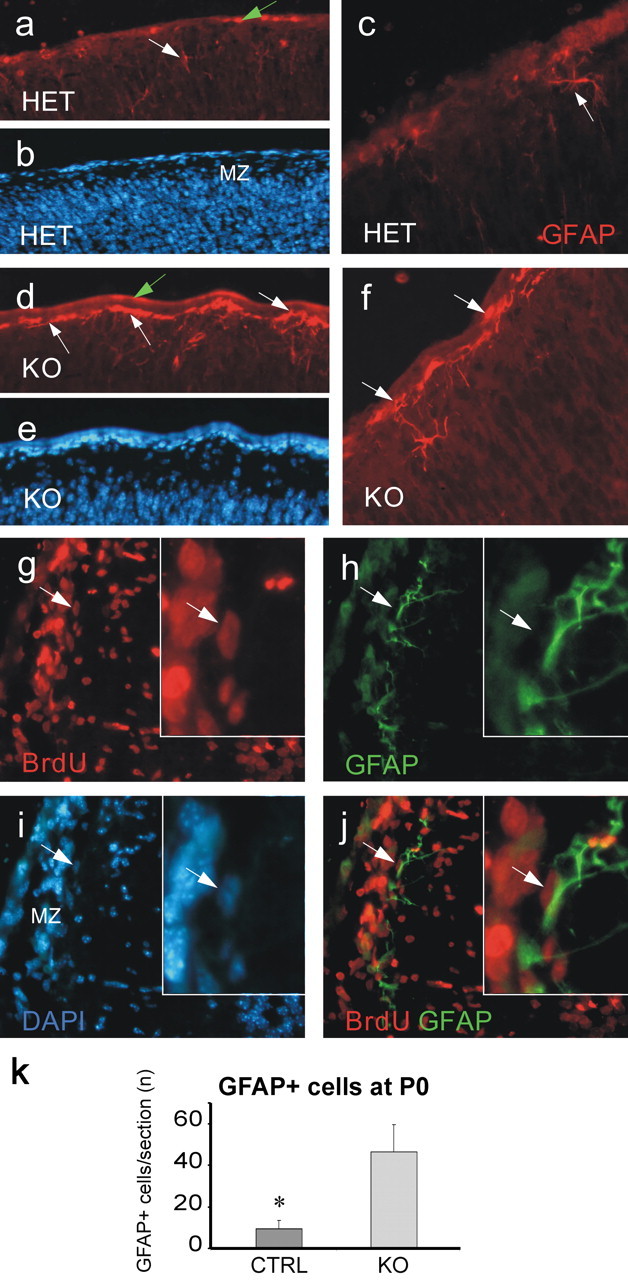
Bmi1-/- mice present more astrocytes in the newborn dorsal cortex. a, c, d, f, GFAP expression in heterozygous mice and in knock-out mice in the marginal zone of the dorsal cortex. Note the increased number of astrocytes in Bmi1-/- mice. The white arrows show the GFAP-positive cell location. The green arrows point to the pial edge. b, e, DAPI staining. g-j, Colocalizazion of BrdU (red; g) and GFAP (green; h) in the marginal zone of a Bmi1-/- cortex. i, DAPI staining of g and h. j, Merged image of g and h. The insets show a detail of a GFAP- and BrdU-positive cell, indicated by a white arrow. k, Quantification of the GFAP+ cells in the marginal zone of the newborn dorsal cortex. Data are represented as absolute numbers of cells per section. Error bars represent SEM. *p = 0.01 compared with controls. HET, Heterozygous mice; KO, knock-out mice; MZ, marginal zone; CTRL, control. Magnification: a, b, 100×; d, e, 200×; c, f, g-j, 400×.
Bmi1-/- animals present a GFAP+ gliosis at P30
The increased generation of astrocytes in the Bmi1-/- brain at birth led us to analyze the astroglial cell population at P30. The number of GFAP+ cells increased dramatically during adulthood, giving rise to a generalized gliosis in Bmi1-/- brains (Fig. 6d,i), which might be influenced by the presence of seizures (Jacobs et al., 1999). We killed adult mice between P30 and P32 after two daily BrdU injections. We counted GFAP+ cells that colocalized clearly with a nucleus (DAPI staining) in three brain regions, including the striatum, corpus callosum, and cortex in both Bmi1-/- and control mice. In all areas but the corpus callosum, the total number of such astrocytes was much more numerous in the knock-out mice (Fig. 6i). Concerning proliferation, we found an increase of 33.6 ± 2.3% in the percentage of proliferating GFAP+ cells in the Bmi1-/- cortex compared with controls (n = 3 animals per genotype; p < 0.001) (Fig. 6e-h). This indicates that glial precursors proliferate normally or are even relatively enhanced in the absence of Bmi1, probably as a response to brain damage. In contrast, we observed no obvious difference in the neuronal and oligodendrocytic cell populations, as revealed by NeuN and O4 labeling, respectively (data not shown), but further characterization might be needed to detect a potential discrete change. No obvious changes in the pattern of cells expressing the nestin filament were observed in newborn and adult brains (data not shown), suggesting that generation of the majority of undifferentiated committed progenitor cells are not disturbed by the absence of Bmi1 function. Indeed, nearly all of the nestin-positive cells in the SVZ are restricted progenitors, and NSCs represent only a very small subpopulation. The loss of NSC pool in the knock-out mice is consequently difficult to identify and may also be hidden by the remaining stem cells able to generate a normal number of progenitors. Moreover, some of these progenitors may have a greater capacity to expand (evidenced by the increased number of astrocytes). Together with the BrdU incorporation data, these observations suggest that astroglial precursors can proliferate in the absence of Bmi1 in vivo.
Figure 6.
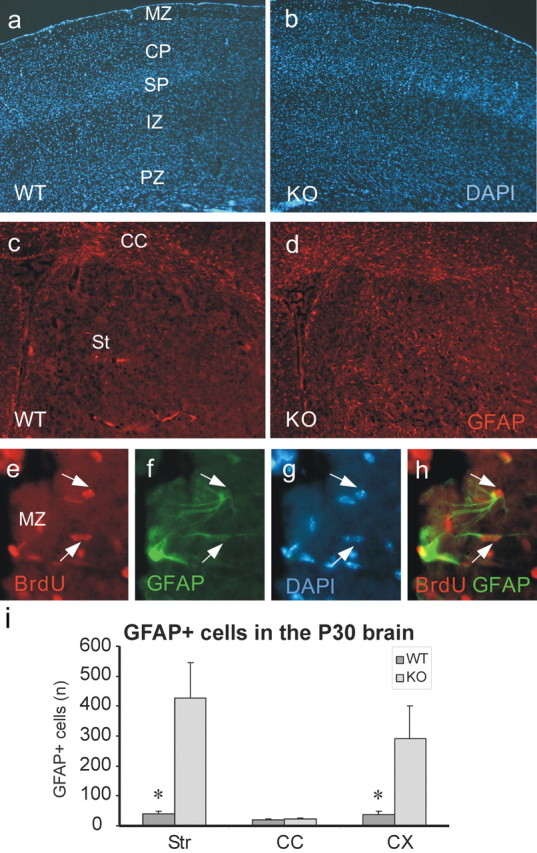
Bmi1-/- adult mice have a normal cortical architecture but produce a strong gliosis. a, b, DAPI staining of the dorsal cortex at the septo-striatal level.c, d, GFAP labeling (red). Note the gliosis in the Bmi1-/- brain. e-h, Colocalization of BrdU (red; e) and GFAP (green; f) in the marginal zone of the Bmi1-/- cortex. g, DAPI-stained nuclei. h, Merged image of e and f. The white arrows point out two GFAP+ astrocytes colocalizing with BrdU+ nuclei. i, Quantification of the GFAP+ cells in the adult (P30) cortex. Data are represented as absolute numbers of cells per section for the corpus callosum and as absolute numbers per 10 fields for the cortex and the striatum. Error bars represent SEM. *p < 0.05 compared with controls (n = 3). PZ, Proliferating zone; IZ, intermediate zone; SP, subplate; CP, cortical plate; MZ, marginal zone; CC, corpus callosum; St/Str, striatum; CX, cortex; KO, knock-out; WT, wild type. Magnification: a-d, 100×; e-h, 400×.
Bmi1-/- neurospheres generate mainly astrocytes
After observing proliferation impairments in vitro and in vivo, as well as the altered cell pattern in vivo, we wanted to determine whether the rare Bmi1-/- neurospheres differentiate normally. In vitro differentiation of E14 Bmi1-/- spheres revealed that cells remained mainly undifferentiated in conditions known to induce differentiation in wild-type spheres (laminin plus FBS) and that the main phenotype observed was astrocytic. Indeed, 100% of the spheres (15 of 15) presented few GFAP-positive cells and numerous cells without any specific markers (Fig. 7). β-Tubulin-III-positive cells with a neuronal-like immature morphology were detected only in 3 of 15 spheres. Spheres derived from newborn Bmi1-/- mice also presented a loss of multipotency in standard cell culture conditions: of 17 spheres plated on laminin plus 2% FBS, 1 was multipotent, 2 contained neurons and astrocytes, 3 had astrocytes and oligodendrocytes, and 11 had only astrocytes. For all Bmi1-/- spheres, few or several cells did not express GFAP or β-tubulin-III: some of these cells expressed either nestin or the S100β antigen with no overlap (data not shown). Seven of seven spheres of heterozygous mice were multipotent on laminin. These results indicate that differentiation of Bmi1-/- spheres is altered in vitro in standard conditions that normally allow wild-type NSCs to generate glia and neurons.
Figure 7.

Bmi1-/- neurospheres show a restricted differentiation potential on laminin substrate. Primary neurospheres derived from Bmi1-/- mice were plated individually onto laminin substrate in a medium containing FBS and no growth factors. Seven days later, cells were fixed and processed for immunocytochemistry. a, Nucleus staining by the DAPI dye. b, GFAP-positive cells are present in the center of the sphere. c, Rare spheres contained rare cells positive for the neuronal marker β-tubulin-III (arrows; red labeling; see Results). These cells presented an immature morphology. Note that numerous cells do not express neuronal or glial markers. No positive cells for O4, a marker of oligodendrocytes, were observed. Magnification, 100×.
Discussion
In this study, we report that the loss of Bmi1 causes a decrease in proliferating cells in the cortex and the lateral corner of the SVZ at birth as well as in the adult, likely related to a cell-intrinsic action of Bmi1 in the control of NSC renewal. Our data also suggest that an environmental factor(s) might compensate partially for Bmi1 loss. Additionally, we observed an increased astrocytic population at birth and a generalized gliosis at P30. Interestingly, Bmi1 loss did not prevent astrocyte precursor proliferation, whereas NSCs were affected.
In the adult brain, NSCs represent a relatively quiescent cell population, whereas the actively proliferating cells are mostly progenitors (Morshead et al., 1994). BrdU treatment for 2 d before being killed at P30 targets rather rapidly dividing progenitors than slowly dividing stem cells (Maslov et al., 2004). Therefore, the reduced BrdU incorporation in the Bmi1-/- newborn cortex and SVZ (after a 30 min treatment) and in the Bmi1-/- adult SVZ (after a 48 h treatment) evokes a decrease in a subpopulation of cycling progenitor cells. This decrease is probably linked to the progressive depletion of the NSC pool (Molofsky et al., 2003; present study) and might explain the brain size reduction, which is only detectable in young adult Bmi1-/- mice (van der Lugt et al., 1994; Leung et al., 2004; our unpublished observations). The reduced proliferation in the Bmi1-/- SVZ might be related to the upregulation of p16ink4a and p19arf that is observed in the normal brain and enhanced by the absence of Bmi1 (Molofsky et al., 2003). Moreover, p19arf was recently shown to be a preferential target for Bmi1 in the CNS (Bruggeman et al., 2005). Other CNS regions could also be affected by Bmi1 loss and could be related to the reduced brain size appearing postnatally. Accordingly, Leung et al. (2004) have shown that the loss of Bmi1 also leads to a depletion of proliferation capacity of cerebellar granule cell precursors.
The decrease in proliferation in vivo is likely related to a diminished NSC pool, which would correlate with our data showing a reduction of stem cell colony formation in vitro from cortical cells derived from E14 Bmi1-/- embryos and newborn mice. The impact of Bmi1 loss on the capacity of NSCs to proliferate and self-renew was attenuated when we cultured E14 cortical cells at high cell density. Likewise, the effect of Bmi1 loss on cell proliferation in vivo is also reduced compared with neurosphere formation in vitro. This suggests that an unidentified environmental factor may partially compensate for Bmi1 loss in vivo and at high cell density in vitro. Interestingly, the effect of cell density only occurred in E14 cells, indicating that NSCs become more sensitive to Bmi1 loss at the end of embryonic development. This also suggests that the in vivo compensating signal is either lost or downregulated during development.
Alternatively, it is possible that cells undergoing the culture process were submitted to stress that could upregulate p16ink4a and/or p19arf, which are already derepressed in Bmi1-/- cultures because of the absence of its inhibitor Bmi1. This phenomenon has been described in mouse and human embryonic fibroblasts (Jacobs et al., 1999) and more recently in Bmi1-/- NSCs (Molofsky et al. 2003; Bruggeman et al., 2005). This would suggest that Bmi1-/- NSCs are more sensitive to stress and could explain why our data from low cell density cultures are more pronounced compared with high-density cultures and in vivo data. In agreement with our observations, progressive consequences of Bmi1 loss on NSC proliferation during brain maturation were also observed in the study by Molofsky et al. (2003), but with a delayed appearance of self-renewal failure. This difference may be attributable to the different culture conditions (growth factors, chick embryo extract, etc.) or to the different genetic background of the knock-out mice. Indeed, in their study, the effect of Bmi1 loss on NSC renewal was observed to be more pronounced at birth and during adulthood than during embryogenesis. In our study, by using more restrictive culture conditions using only EGF, we show that Bmi1 affects proliferation and self-renewal of the EGF-responsive NSCs, and this effect already occurs at E14. Altogether, these data suggest that the renewal ability of NSCs becomes more dependent on the presence of Bmi1 as brain development progresses.
EGF is known to act directly on stem cells, as shown by clonal analysis (Reynolds and Weiss, 1996; Arsenijevic et al., 2001b). The first NSC division in such culture conditions occurs only 72 h after plating. Because the siRNA lentivirus expressed the transgene 48 h after infection, and given that Bmi1--siRNA prevents sphere formation, these experiments are best compatible with a cell-intrinsic effect of Bmi1 on NSC renewal and not because of the stem cell niche. As an alternative, Bmi1 loss may have affected the daughter cells generated by the stem cells that will prevent the NSCs from proliferating. However, the experiments with the siRNA-expressing lentivirus during sphere growth and annexin V staining suggest that the loss of Bmi1 did not induce acute cell death, rendering this hypothesis unlikely. However, the expression of Bmi1 is also expressed in a subpopulation of neural progenitor cells; we therefore cannot exclude additional roles for Bmi1 on these cells.
With regard to the altered cell population pattern of the Bmi1-/- brain, the increased glial population at P0 may be attributable either to a change of NSC responsiveness to environmental cues or a premature differentiation of NSCs into astrocytes, the cells that they are programmed to form at birth. The BrdU incorporation assay clearly shows that astrocyte precursors retain the ability to proliferate in the absence of Bmi1. This observation is reinforced by the presence of actively proliferating GFAP+ cells observed at P30 in both knock-out and control animals, showing that astroglial precursors can proliferate even in the Bmi1-/- adult brain. Thus, the increased number of astrocytes at birth cannot be linked to premature NSC differentiation because of cell cycle failure. It is, however, not clear whether gliosis and the increased percentage of proliferating astrocytes at P30 are attributable to a direct effect of Bmi1 loss or if they represent a side effect as a result of epilepsy and other neurological problems displayed by Bmi1-/- mice at this age. The increased number of astrocytes at birth also correlates with the in vitro differentiation data. In our study, in standard conditions known to induce NSC differentiation into neurons, astrocytes, and oligodendrocytes, the astrocyte is also the most frequent cell phenotype that appears in vitro after Bmi1-/- sphere differentiation. In contrast, Molofsky et al. (2003) could obtain more multipotent spheres, which could be attributable to the more complex culture conditions used in their study and to the different genetic background of the mice. A possibility is that NSCs are almost depleted. Consequently, the spheres obtained in our culture conditions from Bmi1-/- cortical cells may in part originate from the rare glial progenitors able to proliferate in these conditions (Arsenijevic et al., 2001b), which would also explain their low renewal rate and the increased astrocyte number at birth. Nevertheless, our culture conditions also allowed rare multipotent and bipotent Bmi1-/- NSC/progenitor isolation and differentiation. In contrast, the failure of Bmi1-/- neurospheres to properly differentiate could also be explained by a different capacity to respond to environmental stimuli in vitro compared with wild-type and heterozygous cells. This alteration appears to be partial, because other factors can compensate for this defect (Molofsky et al., 2003). This compensatory phenomenon probably happens almost constantly during brain development in vivo, as is suggested by the almost normal formation of the telencephalon in Bmi1 knock-out mice (Fig. 6b). Together, these data show that Bmi1 loss does not affect the capacity of glial-restricted progenitors to proliferate and suggest that Bmi1 action is specifically required for the control of NSC proliferation in the telencephalon. The requirement of Bmi1 for cerebellar granule cell precursor proliferation, however, suggests that, in other brain areas, Bmi1 action might not be limited to NSCs (Leung et al., 2004; Bruggeman et al., 2005).
The present work shows that Bmi1 controls specifically NSC renewal in a cell-autonomous mode but is not required for astrocyte precursor or glial progenitor proliferation. Interestingly, the control of self-renewal versus differentiation decisions is not limited to the CNS but is also operational in hematopoietic stem cells (Lessard and Sauvageau, 2003; Park et al., 2003), highlighting a novel fundamental and conserved role for Bmi1/polycomb repression. These Bmi1 functions bring new insights and a valuable new key factor to study the generation of new neural cells during adulthood (Altman and Das, 1965; Kempermann et al., 1997; van Praag et al., 1999), and/or focal lesions (Magavi et al., 2000) or ischemia (Nakatomi et al., 2002). However, an inducible system is needed to bypass the problems linked to the epileptic status of the young adult Bmi1-/- mice. Such a model should also allow study of the relevant Bmi1 target genes, anticipating important implications for the development of regenerative therapies and understanding of mechanisms controlling NSC renewal.
Footnotes
This work was supported by the Swiss National Science Foundation, the ProVisu Foundation, the Velux Foundation, and the French Association Against Myopathies. M.L. and E.T. were supported by a Pioneer grant from The Netherlands Organization for Scientific Research to M.v.L. We thank Drs. A. Lund, M. Hernandez, and S. Bruggeman for designing the Bmi1 small interfering RNA and for stimulating discussions, M. Curchod for technical assistance, and R. D. G. McKay for the generous gift of the anti-nestin antibody.
Correspondence should be addressed to either of the following: Dr. Yvan Arsenijevic, Unit of Oculogenetics, Jules Gonin Eye Hospital, 15, avenue de France, 1004 Lausanne, Switzerland, E-mail: Yvan.Arsenijevic@ophtal.vd.ch; or Dr. Maartenvan Lohuizen, Division of Molecular Genetics, The Netherlands Cancer Institute, Plesmanlaan 121, 1066 CX Amsterdam, The Netherlands, E-mail: M.V.Lohuizen@nki.nl.
Copyright © 2005 Society for Neuroscience 0270-6474/05/255774-10$15.00/0
References
- Abercrombie M (1946) Estimation of nuclear population from microtome sections. Anat Rec 94: 239-247. [DOI] [PubMed] [Google Scholar]
- Alkema MJ, Bronk M, Verhoeven E, Otte A, van 't Veer LJ, Berns A, van Lohuizen M (1997) Identification of Bmi1-interacting proteins as constituents of a multimeric mammalian polycomb complex. Genes Dev 11: 226-240. [DOI] [PubMed] [Google Scholar]
- Altman J, Das GD (1965) Autoradiographic and histological evidence of postnatal hippocampal neurogenesis in rats. J Comp Neurol 124: 319-335. [DOI] [PubMed] [Google Scholar]
- Arsenijevic Y (2003) Mammalian neural stem cell renewal: nature versus nurture. Mol Neurobiol 27: 73-98. [DOI] [PubMed] [Google Scholar]
- Arsenijevic Y, Villemure JG, Brunet JF, Bloch JJ, Deglon N, Kostic C, Zurn A, Aebischer P (2001a) Isolation of multipotent neural precursors residing in the cortex of the adult human brain. Exp Neurol 170: 48-62. [DOI] [PubMed] [Google Scholar]
- Arsenijevic Y, Weiss S, Schneider B, Aebischer P (2001b) Insulin-like growth factor-I is necessary for neural stem cell proliferation and demonstrates distinct actions of epidermal growth factor and fibroblast growth factor-2. J Neurosci 21: 7194-7202. [DOI] [PMC free article] [PubMed] [Google Scholar]
- Bruggeman SWM, Valk-Lingbeek ME, van der Stoop PPM, Jacobs JJL, Kieboom K, Tanger E, Hulsman D, Leung C, Arsenijevic Y, Marino S, van Lohvizen M (2005) Ink4a and Arf differentially affect cell proliferation and neural stem cell self-renewal in Bmi1-deficient mice. Genes Dev, in press. [DOI] [PMC free article] [PubMed]
- Capela A, Temple S (2002) LeX/ssea-1 is expressed by adult mouse CNS stem cells, identifying them as nonependymal. Neuron 35: 865-875. [DOI] [PubMed] [Google Scholar]
- Caviness Jr VS, Takahashi T, Nowakowski RS (2000) Neuronogenesis and the early events of neocortical histogenesis. Results Probl Cell Differ 30: 107-143. [DOI] [PubMed] [Google Scholar]
- Doetsch F, Caille I, Lim DA, Garcia-Verdugo JM, Alvarez-Buylla A (1999) Subventricular zone astrocytes are neural stem cells in the adult mammalian brain. Cell 97: 703-716. [DOI] [PubMed] [Google Scholar]
- Hof PR, Young WG, Bloom FE, Belichenko PV, Celio MR (2000) Comparative cytoarchitectonic atlas of the C57BL/6 and 129/Sv mouse brains. Amsterdam: Elsevier Science B.V.
- Jacobs JJ, Kieboom K, Marino S, DePinho RA, van Lohuizen M (1999) The oncogene and Polycomb-group gene bmi-1 regulates cell proliferation and senescence through the ink4a locus. Nature 397: 164-168. [DOI] [PubMed] [Google Scholar]
- Kempermann G, Kuhn HG, Gage FH (1997) More hippocampal neurons in adult mice living in an enriched environment. Nature 386: 493-495. [DOI] [PubMed] [Google Scholar]
- Lessard J, Sauvageau G (2003) Bmi-1 determines the proliferative capacity of normal and leukaemic stem cells. Nature 423: 255-260. [DOI] [PubMed] [Google Scholar]
- Leung C, Lingbeek M, Shakhova O, Liu J, Tanger E, Saremaslani P, van Lohuizen M, Marino S (2004) Bmi1 is essential for cerebellar development and is overexpressed in human medulloblastoma. Nature 428: 337-341. [DOI] [PubMed] [Google Scholar]
- Levers TE, Edgar JM, Price DJ (2001) The fates of cells generated at the end of neurogenesis in developing mouse cortex. J Neurobiol 48: 265-277. [DOI] [PubMed] [Google Scholar]
- Magavi SS, Leavitt BR, Macklis JD (2000) Induction of neurogenesis in the neocortex of adult mice. Nature 405: 951-955. [DOI] [PubMed] [Google Scholar]
- Marmur R, Mabie PC, Gokhan S, Song Q, Kessler JA, Mehler MF (1998) Isolation and developmental characterization of cerebral cortical multipotent progenitors. Dev Biol 204: 577-591. [DOI] [PubMed] [Google Scholar]
- Maslov AY, Barone TA, Plunkett RJ, Pruitt SC (2004) Neural stem cell detection, characterization, and age-related changes in the subventricular zone of mice. J Neurosci 24: 1726-1733. [DOI] [PMC free article] [PubMed] [Google Scholar]
- Molofsky AV, Pardal R, Iwashita T, Park IK, Clarke MF, Morrison SJ (2003) Bmi-1 dependence distinguishes neural stem cell self-renewal from progenitor proliferation. Nature 425: 962-967. [DOI] [PMC free article] [PubMed] [Google Scholar]
- Morrison SJ, Shah NM, Anderson DJ (1997) Regulatory mechanisms in stem cell biology. Cell 88: 287-298. [DOI] [PubMed] [Google Scholar]
- Morshead CM, Reynolds BA, Craig CG, McBurney MW, Staines WA, Morassutti D, Weiss S, van der Kooy D (1994) Neural stem cells in the adult mammalian forebrain: a relatively quiescent subpopulation of subependymal cells. Neuron 13: 1071-1082. [DOI] [PubMed] [Google Scholar]
- Nakatomi H, Kuriu T, Okabe S, Yamamoto S, Hatano O, Kawahara N, Tamura A, Kirino T, Nakafuku M (2002) Regeneration of hippocampal pyramidal neurons after ischemic brain injury by recruitment of endogenous neural progenitors. Cell 110: 429-441. [DOI] [PubMed] [Google Scholar]
- Naldini L, Blomer U, Gallay P, Ory D, Mulligan R, Gage FH, Verma IM, Trono D (1996) In vivo gene delivery and stable transduction of nondividing cells by a lentiviral vector. Science 272: 263-267. [DOI] [PubMed] [Google Scholar]
- Park IK, Qian D, Kiel M, Becker MW, Pihalja M, Weissman IL, Morrison SJ, Clarke MF (2003) Bmi-1 is required for maintenance of adult self-renewing haematopoietic stem cells. Nature 423: 302-305. [DOI] [PubMed] [Google Scholar]
- Reynolds BA, Weiss S (1996) Clonal and population analyses demonstrate that an EGF-responsive mammalian embryonic CNS precursor is a stem cell. Dev Biol 175: 1-13. [DOI] [PubMed] [Google Scholar]
- Reynolds BA, Tetzlaff W, Weiss S (1992) A multipotent EGF-responsive striatal embryonic progenitor cell produces neurons and astrocytes. J Neurosci 12: 4565-4574. [DOI] [PMC free article] [PubMed] [Google Scholar]
- Tohyama T, Lee VM, Rorke LB, Marvin M, McKay RD, Trojanowski JQ (1992) Nestin expression in embryonic human neuroepithelium and in human neuroepithelial tumor cells. Lab Invest 66: 303-313. [PubMed] [Google Scholar]
- Tropepe V, Sibilia M, Ciruna BG, Rossant J, Wagner EF, van der Kooy D (1999) Distinct neural stem cells proliferate in response to EGF and FGF in the developing mouse telencephalon. Dev Biol 208: 166-188. [DOI] [PubMed] [Google Scholar]
- van der Lugt NM, Domen J, Linders K, van Roon M, Robanus-Maandag E, te Riele H, van der Valk M, Deschamps J, Sofroniew M, van Lohuizen M (1994) Posterior transformation, neurological abnormalities, and severe hematopoietic defects in mice with a targeted deletion of the bmi-1 proto-oncogene. Genes Dev 8: 757-769. [DOI] [PubMed] [Google Scholar]
- van Praag H, Kempermann G, Gage FH (1999) Running increases cell proliferation and neurogenesis in the adult mouse dentate gyrus. Nat Neurosci 2: 266-270. [DOI] [PubMed] [Google Scholar]
- Zhu G, Mehler MF, Mabie PC, Kessler JA (1999) Developmental changes in progenitor cell responsiveness to cytokines. J Neurosci Res 56: 131-145. [DOI] [PubMed] [Google Scholar]