

Abstract
Disruption of motor cortex activity is hypothesized to play a major role in the slowed movement (bradykinesia) associated with reduced dopaminergic function. We recorded single neurons in the motor cortex of free-moving rats performing a forelimb-reaching task. The same neurons were examined before and after induction of bradykinesia with the D2 dopamine receptor antagonist haloperidol. Within-cell changes in the firing rate and firing pattern of individual cells and the correlation between simultaneously recorded cells after injection of haloperidol were statistically compared with vehicle-only control experiments. During haloperidol-induced bradykinesia (mean movement time increase, +231%), there was an average 11% decrease in baseline firing rate. Movement-related peaks in firing rate were more dramatically affected, with an overall reduction in peak amplitudes of 40%. Bradykinesia was also associated with decreased intensity of bursting and amplitude of cross-correlation peaks at rest. The results show for the first time that significant reductions can be detected in motor cortex activity at rest in animals with impaired ability to generate movements induced by reduced dopamine action and confirm that impaired movements are associated with reduced cortical activation. Together, these changes in neural activity may reduce recruitment and rate modulation of motor units in the spinal cord.
Keywords: haloperidol, skilled reaching task, extracellular recordings, motor cortex, Parkinson's disease, movement
Introduction
Slowed movement (bradykinesia) is a prominent symptom of hypodopaminergic states, whether induced acutely with supratherapeutic doses of dopamine-blocking neuroleptic drugs (Fleminger, 1992; Breier et al., 2002) or by chronic lesions of dopamine pathways (Denny-Brown, 1968; Marsden, 1989; Breier et al., 2002; Obeso et al., 2002). Although bradykinesia is ultimately caused by abnormal development of muscle force (Berardelli et al., 2001), the link from dopamine dysfunction to peripheral dynamics remains poorly understood.
Motor deficits arising from disordered dopaminergic function are considered likely to be expressed via changes in neural processing at the level of the primary motor cortex (Dick et al., 1984; Berardelli et al., 2001). This hypothesis is derived from the fact that the motor cortex is the final output site for initiation and guidance of skilled voluntary movements and receives inputs from basal ganglia circuits that are known to be severely disrupted by dopamine deficiency (Sanderson et al., 1986; Miller and DeLong, 1987; Pan and Walters, 1988; Filion and Tremblay, 1991; Bergman et al., 1994; Kreiss et al., 1997; Chen et al., 2001; Boraud et al., 2002; Ruskin et al., 2002). However, despite these strong theoretical reasons to predict reduced motor cortical activity during slowed movement induced by an abnormality of the dopamine system, the nature or even existence of these presumed cortical disturbances remains uncertain. To date, no studies have demonstrated changes in single-unit firing rate in primary motor cortex of dopamine-deficient animals at rest (Doudet et al., 1990; Goldberg et al., 2002). Studies of regional brain metabolism have failed to consistently find reductions in the sensorimotor cortex of rats with 6-hydroxy dopamine lesions of dopamine pathways (Pelled et al., 2002) or in primary motor cortex of patients with Parkinsonian dopamine deficiency, despite such reductions observed in secondary motor areas (Jenkins et al., 1992; Playford et al., 1992; Rascol et al., 1992, 1994; Jahanshahi et al., 1995; Sabatini et al., 2000; Haslinger et al., 2001; Turner et al., 2003). In addition, although neural activity during movement would be most directly relevant to the mechanism of bradykinesia, this has not been addressed extensively. This is attributable to, in part, difficulties obtaining suitable animal models, because permanent destruction of the dopamine pathways often leaves animals too akinetic for movement studies (Miller and DeLong, 1987; Raz et al., 2000; Goldberg et al., 2002; Heimer et al., 2002). The available data are inconsistent, with two studies reporting a reduction in movement-related activity following lesions of the dopamine system (Gross et al., 1983; Watts and Mandir, 1992) but another finding no changes (Doudet et al., 1990).
To test the hypothesis that bradykinesia induced by disrupted dopamine function would be accompanied by disruption of motor cortex activity, we used the reversible dopamine D2 receptor antagonist bradykinesia model (Hauber and Schmidt, 1990; White and Rebec, 1993; Hauber, 1996). This provides multiple opportunities to obtain bradykinetic levels of disruption in dopamine function. It also enables within-cell comparisons of activity across normal and bradykinetic states, thus enhancing sensitivity for small changes.
Materials and Methods
All procedures were approved by the University of Otago Committee on Ethics in Care and Use of Laboratory Animals and were in accordance with the National Institutes of Health Principles of Laboratory Animal Care. Male Wistar rats (290-350 g at the time of surgery) were maintained on a 12 h light/dark cycle (lights off at 8:00 A.M.), and all experiments were conducted during the animal's dark phase. Rats were trained to reach into a 25-mm-wide, 14-mm-high rectangular opening positioned 55 mm above the floor of a Perspex box to retrieve chocolate-flavored breakfast cereal (Coco Pops; Kellogg's, Auckland, New Zealand) placed on a tray attached to the Perspex box (Hyland and Jordan, 1997). There were two testing or training sessions each day over which rats received ≥100 pieces of cereal (∼2.4 g). To maintain motivation for the task, rats were limited to an additional 15 g of standard rat chow after the sessions and were weighed daily to ensure that their weight was maintained at 90% of their predicted body weight. It took 3-5 d to train rats to reach for the food, and another 2 weeks of training were undertaken to ensure stability of paw preference. The preferred paw was defined as the one used ≥80% of the time over five sessions of 100 reaches. Rats were continuously observed, and switches of preferred paw were never observed during subsequent experiments. Movement time for the terminal part of each reach was derived from the time between interruption of two infrared light beams positioned 15 mm apart at 7 mm (beam 1) and 22 mm (beam 2) from the inner surface of the task box. Beams were positioned on each side of the tray, so that one set was interrupted by left paw entry and the other set was interrupted by right paw entry. The signals from each light-beam interruption were converted to transistor-transistor logic (TTL) pulses, which were recorded on the same data file as the cell activity. The TTL output went high for 2 s to ensure that only the first reach of a rapid-reaching sequence was marked.
After the training period, eight extracellular recording electrodes were implanted into the motor cortex contralateral to the preferred reaching paw of each rat. The electrodes were constructed from a 0.0007 inch nichrome wire covered in formvar (A-M Systems, Carlsborg, WA). One end of each wire was stripped of the formvar covering and soldered into a gold amphenol pin (Connector Systems, Christchurch, New Zealand), which was inserted into a 9-way plug housing (Science Technology Centre, Carleton University, Ottawa, Canada). The wires were gathered into a bundle, and the bundle was inserted into a beveled, 30-gauge stainless-steel cannula so that the tips protruded 1-2 mm from the cannula. Each wire was trimmed with a fresh scalpel blade, with final electrode impedances of 1.1-3.7 MΩ, and the bundle was glued in place with cyanoacrylate (Supaglue; Selleys Chemical Company, Auckland, New Zealand). The electrodes were attached to a moveable microdrive that allowed subsequent advance of the electrodes through the cortex in steps of ∼30 μm. An earth-contact lead was soldered to a stainless-steel screw (Lomatt, Quebec, Canada), which was inserted in the skull during surgery.
Electrode implantation was performed under full anesthesia (sodium pentobarbitone, 60 mg/kg, i.p.; Virbac Laboratories, Auckland, New Zealand) and prophylactic antibiotic cover (Strepcin, 1 ml/kg, s.c.; Stock-guard Laboratories, Hamilton, New Zealand). The area of the incision was shaved, and 0.5 ml of a long-acting local anesthetic (0.5% bupiva-caine hydrochloride solution; AstraZeneca, Auckland, New Zealand) was injected along the intended incision line. The rat was mounted in a stereotaxic frame, the skull was exposed by a midline sagittal incision and cleared of subcutaneous connective tissue, and six stainless-steel screws were implanted. A hole was drilled in the skull at the chosen stereotaxic coordinates above the motor cortex, and the dura was reflected. Target recording coordinates were derived from previous microstimulation (Neafsey and Sievert, 1982; Gioanni and Lamarche, 1985; Neafsey et al., 1986) and single-cell recording studies (Hyland, 1998) of the forelimb representation in rat motor cortex and were centered at anteroposterior (AP) +1.0-2.2 mm and lateral ±2.0 mm relative to bregma (flat skull position). The electrode assembly was lowered so that the electrode tips and cannula just penetrated the brain, and the exposed brain surface was sealed with petroleum jelly. The microdrive and a protective box, with holes in the top to permit access to the microdrive for advancing the electrodes, were fixed in place with dental acrylic (Vertex-Dental, AA Zeist, The Netherlands).
During recording sessions, signals from electrodes were amplified and filtered (5000×; 0.3-10 kHz bandpass) using a CyberAmp signal conditioner (Molecular Devices, Union City, CA). Differential recording was achieved by selecting an inactive microwire as the reference for all other wires. Channels with distinguishable single-cell activity were recorded using a Power1401 A-D converter and Spike2 (version 4) data acquisition and analysis software (Cambridge Electronic Design, Cambridge, UK). Extracellular action potentials from single neurons were discriminated off-line based on waveform shape, using the template-matching algorithm in the Spike2 software. Discrimination of spikes from noise was confirmed by the presence of an empty first bin in interspike interval histograms calculated for each template (bin width, 1 ms; time base, 1 s). For each accepted template, the peak-to-peak amplitude and duration were measured from the average waveform. A frequency distribution of all waveform durations was plotted to check for separate “broad” and “narrow” spike populations as reported previously for the cerebral cortex (Wilson et al., 1994).
Haloperidol (Sigma, Auckland, New Zealand) was dissolved in 1% lactic acid solution, and the pH level was adjusted to 3.2 with 1 m NaOH. Dose-response curves for the effect of drug administration on the number of reaches performed per unit time in a series of preliminary experiments (data not shown) identified an intraperitoneal injection of 0.090-0.155 mg/kg as an effective dose range to reduce reach performance, and in these sessions, average movement times were frequently, but not always (see Results), also increased. Typically, 0.12 mg/kg was used intraperitoneally, but this was adjusted if necessary within the above range for individual animals.
Recording sessions began, at the earliest, on the third postoperative day. Each recording session began with an injection of vehicle. After a 5 min settling period, recordings were obtained while the rat performed reaching movements (at least 50 trials). Provision of food at the reaching tube was then stopped, and once the rat had settled quietly in the box, an additional 5 min of recording were taken. After this, either an additional dose of vehicle alone was injected (control experiments) or the previously established dose of haloperidol for the individual rat was administered. For simplicity, data obtained before the second injection are referred to as “preinjection,” and data collected afterward are referred to as “postvehicle” or “posthaloperidol.” Individual cells thus provided both preinjection baseline and postinjection data, enabling the percentage change in activity for each cell to be calculated, which was our main measure of interest in this study. Cells were randomly assigned to either control or haloperidol groups, except that in any one rat, no more than one haloperidol and two control sessions were performed per week. After this injection, a settling period of 14 min allowed for drug action, and recordings were then taken as the animals performed more reaches. The reaching period was extended up to 15 min in an attempt to obtain the target of 50 reaches; however, because of the effect that haloperidol had on reaching rate, rats did not always complete this number. Finally, an additional 5-10 min of data were recorded with the rat resting quietly in the box. Thus, recordings were made 15-40 min after haloperidol injection, spanning the period of peak haloperidol concentration in the brain (Ohman, 1977). In many cases, additional recordings were made 4 h later, at which time movement and cellular responses appeared to have returned to normal levels. However, these data were not obtained for every cell and are not presented here. Data were collected over periods that ranged from 4 to 12 months for individual rats. Rats thus received multiple injections of haloperidol but never more than one injection per week. There was no evidence of any effect of this repeated dosing on the degree of bradykinesia over time, with neither average preinjection movement time values nor the effect of haloperidol showing any significant difference between the first and last 4 weeks of recording (p = 0.35 and 0.789, respectively; one-factor ANOVAs). If cells were encountered on the same wire in consecutive recording sessions with no intervening recording cell-free recording session, they were assumed to be different unless the spike waveform, baseline firing-rate autocorrelation, and movement-related modulations were similar, in which case only the recording with the best signal-to-noise ratio was entered into the data.
Analysis of firing rate. Firing rates were derived from average perievent time histograms (PETHs) centered on interruption of the most distant infrared beam (i.e., marking termination of the extension phase and onset of the grasp phase of each reaching movement) (Hyland and Jordan, 1997). For the PETH, cell activity was averaged across trials in 20 ms bins extending for 2 s before and after the light-beam interruptions generated by the preferred paw (contralateral to the recorded hemisphere) and normalized by converting to instantaneous frequency (spikes per second). The baseline firing rate for each recorded cell was calculated from the first 1500 ms of the PETH. Baseline activity was therefore recorded from a period immediately preceding each reaching movement, providing a degree of behavioral clamping by ensuring that all data were obtained while animals would have been in a similar behavioral state (i.e., preparing for reaching, regardless of whether, overall in the session, they were displaying normal or a reduced number of reaches per unit time). Movement-related modulations in firing rate were defined as a group of at least three consecutive bins (i.e., 60 ms) that were beyond ±2 SDs from the mean baseline firing rate. The duration of the modulation was taken from the leading edge of the first bin to cross the threshold (which also defined the latency of the modulation onset) to the trailing edge of the last bin that remained beyond the threshold, and the movement-related firing rate was measured as the mean firing rate over the duration of the modulation. If a modulation was present during reaches after one injection but not after the other, the average firing rate was analyzed in the nonsignificant PETH over the same time period as that occupied by the significant modulation. If there were two significant modulations of opposite sign in one histogram, they were both analyzed, but where two separate modulations of the same sign occurred, only the largest was used.
In addition to this whole-session analysis, we also performed separate analyses of movement-related firing rate for subsets of trials from preinjection and postinjection periods, which were matched for movement speed. This analysis was designed to examine whether haloperidol had any generalized effect on cortical activity, independent of the bradykinesia. Trials were classified using the raster-ordering function available in Spike2 software. Dot rasters were constructed and centered on the beam 2 interrupt as before, but with the trials within a session ordered from the shortest to the longest movement time. A marker was placed at the time of beam 1 interrupt, and the duration between this marker and time 0 on the PETH indicated the movement time for individual reaches. The movement time value separating “fast” from “slow” movement times in the preinjection period was identified from the inflection on the curve formed by beam 1 interrupt markers. This movement time criterion was then used to also separate fast and slow trials after haloperidol injection. Two new PETHs were then produced for the prehaloperidol and posthaloperidol sessions, one containing fast reaches and the other containing slow reaches. This procedure was repeated for every bradykinetic haloperidol experiment.
Analysis of firing pattern and correlation. The firing pattern of each cell was identified using autocorrelograms, which summed across all spikes within the analysis period the probability (expressed as spikes per second) of encountering subsequent spikes in 10 ms bins for 1 s after each spike. Autocorrelations were defined as showing bursting activity in the cell if there was an early peak consisting of at least three consecutive bins >2 SDs from the baseline mean, which was calculated from the last 500 ms of the autocorrelogram. The amplitude of significant peaks was calculated as the mean value of the bins that were above threshold. In cells in which one data set did not have a significant peak but the other did, the mean was calculated over the same time period as for the significant peak. If the autocorrelogram exceeded the threshold on more than one occasion and there was a consistent interval between the peaks, the cell was classified as showing oscillatory (rhythmic) activity, reflecting underlying regularity of interspike intervals. Flat autocorrelograms indicated cells firing in a random pattern of intervals (neither bursting nor oscillatory).
The degree of coordination in firing of simultaneously recorded cells was determined using cross-correlograms, with a time base of 2 s and a bin width of 10 ms. To classify the correlogram of each cell pair, a baseline was determined from the first or last 0.5 s period of the cross-correlogram (whichever had the largest SD). Thresholds were defined as the baseline ± 2 SD. If at least two consecutive bins of the cross-correlogram exceeded either the upper or lower threshold, the cell was classified as being in the correlated group. Correlation peaks and troughs were classified as narrow (=20 ms) or broad (>20 ms) (Kruger and Aiple, 1988; Singer and Gray, 1995) and as either spanning zero or wholly displaced to one side of time 0 (Murphy et al., 1985; Villa et al., 1996).
The effect of haloperidol on firing rate was determined by calculating the percentage change (from preinjection to postinjection) in baseline and movement-related activity for each cell and comparing these changes with those seen in control experiments. The effect of haloperidol on firing pattern was analyzed by comparing the extent to which cells changed firing pattern in response to haloperidol or vehicle injection and whether the direction of change was toward burstier, more oscillatory, or more random. Similarly, changes in correlation were quantified as loss, gain, or change in type of significant features in the cross-correlogram.
Data are reported as means ± SEM. Percentage changes in continuous measures were compared using one-factor ANOVA (SPSS version 6.1.1; SPSS, Chicago, IL). Additional one-factor ANOVAs were used to compare firing rates and action potential amplitudes across groups defined by action potential duration. Paired t tests were used to compare movement-related firing rates of slow or fast trials within a session. In cases in which data were not normally distributed (Levene test for homogeneity), a Mann-Whitney U test on ranks was used. To determine whether haloperidol had an effect on the distribution of cell types across different classes, χ2 tests were used unless any table-cell contained less than five exemplars, in which case Fisher's exact probability tests were used instead.
After completion of recordings, rats were anesthetized with sodium pentobarbitone and lesions were induced at the tips of selected electrodes by passing a radio frequency current (Owl Radio Frequency Lesioner, Ontario, Canada) of 3 mA for ≥30 s. One week after the lesion, rats were given an anesthetic overdose and perfused through the heart with saline (0.9% NaCl solution) and then a 10% formalin solution (Asia Pacific Specialty Chemicals, Seven Hills, Australia); brains were removed and postfixed in 10% formalin and 30% sucrose until they were sectioned on a freezing microtome. Serial coronal sections (100 μm) of the brain were collected and examined to locate the position of the recording electrode bundle. This enabled the rostrocaudal and lateral coordinate of the bundle to be identified, and recording tracks finished at or just above the corpus callosum in each case. However, because each wire was a slightly different length and lesions from separate wires coalesced, it was not possible to identify on which specific cortical layers individual cells were recorded.
Results
Characteristics of recorded cells
A total of 474 cells was recorded from the motor cortex of four rats, with 151 and 323 cells recorded during the preinjection period of control and haloperidol experiments, respectively. Cells were located, relative to bregma, at +1.3 to +3.7 mm AP and 1.7-2.5 mm lateral, thus including both rostral and caudal motor areas as defined by Neafsey et al. (1986) and Neafsey and Sievert (1982). The majority of cells (353 of 474; 74.5%) were in a region consistent with the location of the rostral motor area, and the remaining 25.5% was located in the caudal motor area. There was no difference in the proportions of movement-related cells obtained from rostral (134 of 353; 38.0%) and caudal (37 of 121; 30.6%) motor areas, and there were no other differences in the baseline firing rate or timing of responses seen in these groups, as reported previously (Hyland, 1998). Therefore, cells from both regions were combined for additional analysis.
Overall, the proportion (171 of 474; 36%) and response type of movement-related cortical cells were similar to previous results from rats performing the reaching task (Dolbakyan et al., 1977; Stashkevich and Bures, 1981; Moroz and Bures, 1984; Storozhuk et al., 1984; Chapin and Woodward, 1986; Zhuravin and Bures, 1989; Hyland, 1998), with the majority (61%) of movement-related cells showing pure excitations, 33% of cells inhibited, and 6% of cells showing both excitations and inhibitions. Overall, 39% of the excitations and 83% of the inhibitions began before the paw entered the feeder and thus may have been related to reach onset or the transport phases of the reach. Another 27% of excitations and 14% of inhibitions began in the narrow time interval from feeder entry until 100 ms after the paw reached the second marker beam and thus may have been related to grasping movements. The remaining 34% of excitations and 3% of inhibitions began later than 100 ms after the paw reached maximum extent and may relate to withdrawal of the limb from the feeder. The proportions of modulations occurring before and after the paw reached the food in the feeder are very similar to values that have been reported in the rat motor cortex, including the preponderance of early responses for inhibitions (Hyland, 1998).
Across all electrodes, most recorded action potentials were initially negative-going biphasic waveforms. The frequency distribution of action potential peak-to-peak durations (data not shown) showed that the majority (444 of 474; 93.7%) were broad (>0.35 ms), with a small separate group (30 of 474; 6.3%) having narrow durations of <0.35 ms. The peak-to-peak durations of broad and narrow spike cells averaged 0.54 ± 0.01 and 0.23 ± 0.01 ms, respectively (mean ± SEM). These values are similar to those reported previously for broad and narrow waveforms in the primate cortex that have been suggested to represent pyramidal and GABAergic interneurons, respectively (Wilson et al., 1994). Consistent with previous results, the average amplitude of broad spike cells (149 ± 3 μV) was larger than for narrow spike cells (123 ± 13 μV; F(1,472) = 6.04; p = 0.014), but unlike reports from primates (Wilson et al., 1994), the mean firing rates (measured over 5 min of quiet rest) for the broad and narrow spike cells were identical (5.1 ± 0.3 and 5.1 ± 1.0 Hz, respectively). These two groups also did not differ significantly in the proportion showing movement-related modulations in activity (35.5% of narrow spike cells; 38.2% of broad spike cells), and there was no significant difference in the proportion of movement-related modulations that were excitatory or inhibitory (82 and 66% excited for narrow and broad spike cells, respectively). Therefore, narrow and broad spike cells were pooled for subsequent analyses.
Haloperidol-induced bradykinesia
A total of 120 haloperidol experiments were performed in four rats, and 40 control experiments also were performed in three of the animals. Preinjection movement time over all recording sessions averaged 42 ± 2 ms (mean ± SEM), equating to an average velocity over the last 15 mm of a normal reach of 0.36 m/s. Over all haloperidol experiments, average movement time increased by 87.7 ± 15.2%, which was significantly different from the control group, in which there was, on average, no change in movement time (-3.1 ± 4.4%; Mann-Whitney U test; p = 0.001). However, of the haloperidol experiments, 27 generated akinesia, with insufficient reaching trials performed for meaningful movement time analysis. Such cessation of reaching (akinesia) was never observed after vehicle injections. In another 59 individual haloperidol experiments, changes in average movement times were within the range seen in controls (Fig. 1). This variability in the neuroleptic bradykinesia model (Hauber and Schmidt, 1990; Mayfield et al., 1993; Hauber, 1996) is akin to the variability seen in human Parkinsonian bradykinesia, in which individual subject movement-speed distributions overlap with age-matched control data (Bonfiglioli et al., 1998; Poizner et al., 2000). However, because the experimental variation could represent slight differences in effective dosage (e.g., different uptake kinetics resulting from intraperitoneal injection into peritoneal fat), we included only cases of unambiguous drug-induced bradykinesia in the analysis. This behavioral clamping was achieved by using the conservative criterion that the change in movement time must exceed the maximum seen in any control experiment for a haloperidol experiment to be accepted as showing bradykinesia. Because the remaining experiments would represent a mixed population, including ineffective injections as well as mildly affected animals, cells from those experiments were excluded. This left 92 cells that were accepted into the study from 34 bradykinetic haloperidol experiments with an average increase in movement time of +231 ± 27%.
Figure 1.
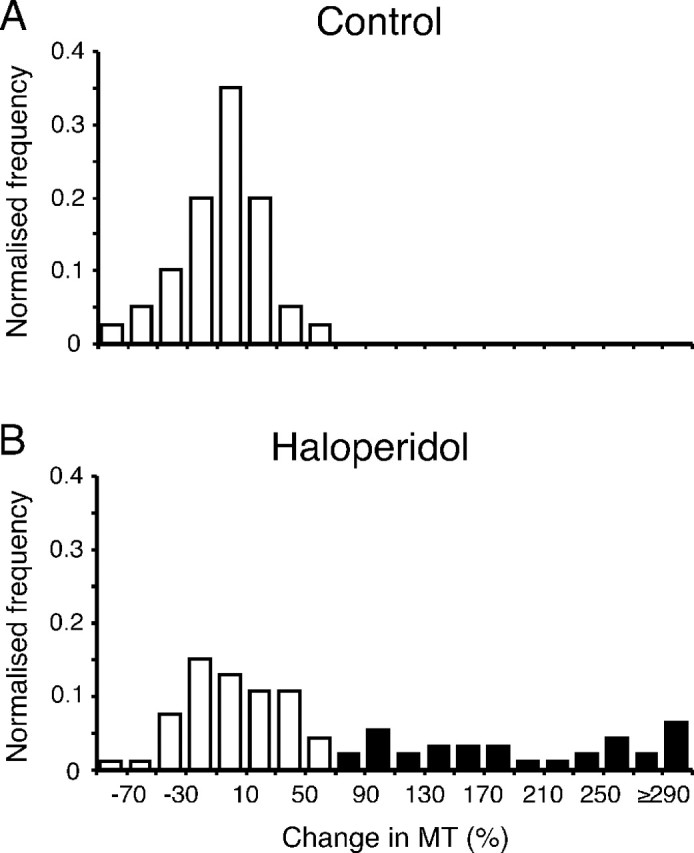
Identification of haloperidol-induced bradykinesia. Graphs show normalized frequency distributions of the change in movement time (MT) after vehicle (A) (control; n = 40) and haloperidol (B) (n = 93) injections. Bradykinetic experiments (filled columns) were defined as those exceeding the maximum percentage increase seen in control experiments.
Baseline firing rate
Baseline firing rate was calculated for each cell from the premovement period of the PETH (Fig. 2). This ensured that baseline rates were obtained in similar circumstances (i.e., immediately before a reaching movement) across all cells, whether in vehicle control or haloperidol experiments. In the preinjection period (i.e., presumed normal activity), the firing rates averaged ∼4.5 Hz (4.6 ± 0.5 Hz, n = 151 for cells in control experiments; 4.5 ± 0.5 Hz, n = 92 for cells in haloperidol experiments).
Figure 2.

Illustrative examples of dot raster and PETH analyses of baseline and movement-related cell activity and the effect of haloperidol. A, Cell recorded in a control experiment (injection of vehicle) with a significant movement-related excitation (filled arrow) and a nonsignificant inhibition. Top and bottom panels show preinjection and postinjection data, respectively. The dot rasters show each action potential in each trial, and the histograms show firing rate averaged across all trials (20 ms bins). Data are aligned to the termination of the extension phase of the reaching movement (time 0). Baseline activity was calculated from the first 1.5 s of the histogram. The inset shows averaged action potential waveforms for the spikes obtained in each recording. Calibration: 1 ms, 50 μV. B, A different cell recorded before and after induction of bradykinesia by haloperidol. Significant excitatory and inhibitory movement-related modulations in preinjection data are indicated by filled and open arrows, respectively.
Analysis of proportions of cells showed that in haloperidol experiments, significantly more cells (57 of 92; 62.0%) decreased baseline firing rates than in the control group (67 of 151; 44.4%; χ2 = 8.76; α = 0.01). Quantitative analysis of percentage changes in firing rate confirmed that over all cells, the percentage change in baseline firing rate in the haloperidol group, which was, on average, a decrease (-11 ± 9%), was significantly different from in the control group (Fig. 3) (F(1,241) = 10.63; p = 0.001).
Figure 3.

Effect of haloperidol on measures of cell activity, expressed as a percentage change from preinjection values. Open bars show mean values from control (vehicle), and filled bars show changes with haloperidol-induced bradykinesia. Error bars represent SEM. Baseline, Baseline firing rate; Movement, movement-related firing rate; Burst, amplitude of autocorrelation peak; CC, amplitude of cross-correlation peak. **p ≤ 0.01, ***p ≤ 0.001; one-factor ANOVAs or Mann-Whitney U tests, comparing vehicle and haloperidol experiments.
To examine whether changes in baseline firing rate, as measured in this study, had any relation to changes in movement performance, we calculated the correlation (Spearman's correlation coefficient) between percentage change in movement time and percentage change in baseline firing rate across all control and bradykinetic haloperidol experiments. However, although statistically significant, the degree of correlation was very small (r = -0.283; p = 0.001) (Fig. 4 A), suggesting a relatively low quantitative relationship between these measures.
Figure 4.

Relationship between change in movement time and cell activity measures. A, Scatter plot of percentage change in baseline firing rate and percentage change in movement time (MT) for cells recorded in vehicle injection control (open circles) or bradykinetic haloperidol experiments (filled circles). B, Scatter plot of percentage change in movement time and percentage change in excitatory movement-related firing rate.
Although the majority of cells decreased baseline firing rate during haloperidol-induced bradykinesia, it is shown in the scatter plot of Figure 4A that there was a population of cells (31 of 92; 34%) that increased firing rate across a wide range of movement time increases. To determine whether this group represented a particular cell type, the proportions with narrow and broad action potentials were compared using χ2 or Fisher's exact tests as appropriate. This analysis revealed no significant difference in the proportion of cells with narrow or broad action potentials in the rate-increase group compared with the rate-decrease group. This was true for both haloperidol and control experiments.
Movement-related firing rate
The typical effects of control vehicle injections and haloperidol injections that led to bradykinesia on movement-related activity are illustrated by the changes seen in peak amplitudes in the example PETHs in Figure 2. The control cell (Fig. 2A) showed little change in the amplitude of movement-related activity. In contrast, haloperidol-induced bradykinesia was associated with a decrease in the amplitude of the movement-related peak (Fig. 2B). We used two methods to assess the changes in movement-related modulations associated with bradykinesia. First, for excitatory and inhibitory modulations combined, we simply counted the numbers of cells that retained significant modulations. Thus, cells such as that shown in Figure 2A, which only had one significant component to the preinjection movement-related modulation contributed one data point, whereas cells such as those shown in Figure 2B, which had significant inhibitory and excitatory components, contributed two data points. This analysis was based on the fact that with stability of movement performance and cell activity, significant modulations found in the preinjection PETH would still be there in the postinjection PETH. This was the case in the control group, in which there was a 94% probability (44 of 47 cases) that a significant modulation (excitation or inhibition) seen before vehicle injection would also be present afterward. In contrast, when haloperidol was injected, there was only a 27% probability (7 of 26 cases) that modulations would remain above the threshold criterion afterward. This difference in the distribution of cells between the two groups was significant (χ2 = 40.12; α = 0.01).
The second analysis quantified the change in amplitude of movement-related modulations. This was limited to excitatory peaks because of the floor effect in amplitude changes for inhibitions (the inability of cell firing rate to fall to <0 Hz), which makes it impossible to obtain an unbiased estimate of the extent of any increases in inhibitory trough amplitude. As would be expected, the firing rates within peaks were not significantly different between the two groups before vehicle or haloperidol injection (11.3 ± 1.2 Hz, n = 42, and 15.3 ± 1.7 Hz, n = 20, respectively). Over all cells, quantitative analysis (Fig. 3) showed that induction of bradykinesia by haloperidol led to a nearly 40% reduction in the size of movement-related peaks, which was significantly different from in control injections (F(2,112) = 10.05; p = 0.002). This reflected a consistent effect of haloperidol across cells, with almost all cells (18 of 20; 90%) tested during haloperidol-induced bradykinesia decreasing their excitatory peak firing rate, which is a significantly different distribution than that for control cells, in which 43% (18 of 42) of cells decreased peak amplitude (p = 0.001; Fisher's exact probability test).
For cells that retained significant excitatory peaks after haloperidol injection, we also analyzed the duration of the peaks. With the numbers available, there was no significant difference in the duration of the surviving peaks for haloperidol or control injections (175 ± 80 ms before haloperidol, 445 ± 240 ms after haloperidol, n = 5; 408 ± 50 ms before vehicle, 557 ± 80 ms after vehicle, n = 34). Therefore, we were unable to demonstrate a significant smearing or broadening of the response duration that may have contributed to the reduction in average peak amplitude (Doudet et al., 1990; Watts and Mandir, 1992).
The degree of association between the change in excitatory peak amplitude and change in movement time was assessed by calculating Spearman's correlation coefficient across all cells in both control and bradykinetic haloperidol experiments. This confirmed the existence of a significant negative correlation (r = -0.537; p = 0.001) between changes in movement-related peaks in cell activity and movement performance (Fig. 4B). Thus, in addition to increases in movement time associated with decreases in movement-related activity, larger increases in movement time were associated with larger decreases in firing rate during movement-related peaks.
Changes in excitatory peak amplitude were consistent with changes in baseline firing rate, as reported above. The scatter plot in Figure 5 shows the relationship between change in baseline and change in movement-related peak firing. Across all cells, there was a moderate, significant, positive correlation between changes in baseline and peak firing rates (r = 0.478; p < 0.01). While examining the groups separately, it is clear that during haloperidol-induced bradykinesia, most cells are represented in the lower left quadrant (i.e., they decreased both baseline and excitatory peak firing rates) (12 of 20; 60%), whereas in control experiments, data points are scattered across all quadrants. This difference in distribution was confirmed by χ2 analysis (χ2 = 8.01; α = 0.01).
Figure 5.

Relationship between change in movement-related firing rate and change in baseline firing rate. Data are shown for each recorded cell in vehicle injection control experiments (open circles) or bradykinetic haloperidol experiments (filled circles).
These data suggest that haloperidol-induced bradykinesia is associated with decreases in both baseline and movement-related activity. However, given that the baseline rate was changing in these cells, there is potential for ambiguity in interpreting changes in peak amplitude. To separate any effects specific for movement-related modulation, we also calculated a modulation index for each histogram as the difference between the mean peak and baseline firing rates. A change in total peak amplitude that was entirely attributable to a drop in baseline firing would not alter this index. This analysis showed a reduction in average modulation index in association with haloperidol-induced bradykinesia (-2.9 ± 2.4 Hz; -37%) that was significantly different from control experiments, in which the change in modulation index was close to 0 (+0.2 ± 0.6 Hz; 3%; p < 0.01; Mann-Whitney U test). This is consistent with a specific effect of haloperidol-induced bradykinesia on movement-related inputs to the cells, in addition to any effects common to both baseline and peak firing rate.
Within-session analysis of the relationship between movement-related activity and movement time
Although we only analyzed experiments in which there was a clear drug-induced bradykinetic effect and found correlations between behavioral and cell-firing measures, it remains theoretically possible that haloperidol could have had an additional affect on cortical activity that was independent of changes in movement speed. To investigate this, we took advantage of the fact that during sessions defined as showing haloperidol-induced bradykinesia on average, rats were able to sometimes execute reaches of the same speed as normal reaches in the preinjection period. Conversely, they produced some slow reaches before haloperidol injections. This trial-to-trial variability is similar to that seen in human Parkinson's disease, in which movement speed shows considerable within-session variability (Sheridan et al., 1987). Therefore, we were able to compare the movement-related firing rate in prehaloperidol and posthaloperidol sessions for trials matched for movement speed (see Materials and Methods). To ensure reasonably representative average histograms, only sessions with at least eight trials in the special (atypically, fast or slow) categories were used in this analysis. This reduced the data set to eight cases with enough fast trials after haloperidol and six cases with enough slow trials before haloperidol injection.
The results of this analysis are shown in Figure 6. The procedure successfully isolated trials that were matched for movement speed across the preinjection and postinjection periods, with no significant difference in the mean movement times of fast reaches from prehaloperidol or posthaloperidol periods, or between slow reaches extracted from these periods. Analysis of movement-related modulations in the histograms generated from these selected, velocity-matched reaches showed that fast reaches were associated with relatively large modulations that were not significantly different in amplitude whether obtained under haloperidol or during the preinjection period. Similarly, slow reaches from the preinjection and postinjection periods were both associated with small excitatory modulations that were not significantly different. These data confirm that, under our experimental conditions, cortical cell firing rate is not influenced by haloperidol, independent of the effects of the drug on movement performance.
Figure 6.

Within-session analysis of movement-related firing rates. The graph shows mean values for movement-related firing rates calculated for selected slow and fast trials obtained from preinjection (open circles) and posthaloperidol (filled circles) periods. Error bars represent SEM. ns, Nonsignificant difference; paired t test.
Firing pattern and synchronization
Firing-pattern changes were assessed by examining autocorrelograms constructed for 151 cells from control experiments and 92 cells in haloperidol experiments from the resting periods. As expected, during the preinjection period, populations from control and haloperidol experiments did not differ in their distribution of random and burst firing cells. In the preinjection period, only four cells exhibited an oscillatory firing pattern. As a result of the low number of oscillatory cells, they were not included in any analyses. We assessed both the firing-pattern stability (numbers of cells gaining or losing a burst firing pattern) and the effect on the amplitude of the early autocorrelogram peak that was used to define bursting. Because firing rates were affected by haloperidol (see above), we extended the recording period after haloperidol injection so that there was no significant difference in the number of spikes contributing to prehaloperidol and posthaloperidol analyses (1369 ± 166 and 2530 ± 426 spikes, respectively; p = 0.410; Mann-Whitney U test).
There was no effect of haloperidol on stability of firing pattern overall, with the proportion of cells changing pattern (i.e., gaining or losing a burst-firing pattern) under haloperidol (23 of 92; 25.0%), not statistically different from the proportion in control experiments (25 of 151; 16.6%). However, haloperidol did reduce burst amplitude. Typical example autocorrelation analyses are shown in Figure 7, and the population average is shown in Figure 3. Compared with vehicle control injections, haloperidol administration led to a significant (p = 0.001; Mann-Whitney U test) decrease (31%) in the amplitude of the early peak in the autocorrelation, consistent with a reduced tendency to burst in these cells.
Figure 7.

Illustrative examples of changes in burst amplitude during quiet rest. Autocorrelograms show average firing rate for 1 s after each spike. A, Cell recorded in prevehicle and postvehicle periods of a control experiment. B, A different cell recorded before and after haloperidol injection. Vertical dotted lines indicate the region from which the mean amplitude of peaks was determined (region >2 SDs of histogram baseline mean, determined from preinjection histogram). Above each autocorrelogram is a 20 s sample of spike train during the rest period.
To investigate levels of correlated activity, cross-correlograms were constructed for 496 pairs of cells, 364 pairs recorded in control experiments and 132 pairs recorded in haloperidol experiments. During quiet rest, 6.3% (31 of 496) of all pairs showed correlated activity before injection. The majority of these were positive correlations (29 of 31; 93.5%), with similar numbers of cell pairs having narrow (16 of 29; 55.2%) and broad (13 of 29; 44.8%) peaks. The majority of narrow peaks (14 of 16; 87.5%) were displaced from the origin, whereas the majority of broad peaks (11 of 13; 84.6%) spanned the origin.
Changes in correlation induced by haloperidol were assessed both in terms of stability of correlation and by measuring changes in amplitude of correlation peaks. As noted above, the reduction in firing rates induced by haloperidol was controlled by increasing the duration of posthaloperidol recordings, so there was not a confounding reduction in the total number of spikes contributing to the cross-correlation analyses. Under haloperidol, 9 of 11 pairs (81.8%) that were correlated before injection showed no significant correlation after, whereas in vehicle control conditions, 11 of 20 correlated pairs (55.0%) lost this correlation, but with the numbers available, this difference did not reach significance (Fisher's test). Changes in the other direction, that is, previously uncorrelated pairs of cells becoming correlated, were rare and not different between haloperidol (7 of 121 pairs; 5.8%) and control (12 of 344 pairs; 3.5%) experiments. However, there was a significantly different (p = 0.003; Mann-Whitney U test) effect for haloperidol than for vehicle on the amplitude of cross-correlation peaks, which was reduced by 52% under haloperidol (Fig. 3).
In summary, during haloperidol-induced bradykinesia, there were reductions in all measures of motor cortex activity. In contrast, comparison of preinjection and postinjection average values in control experiments yielded positive percentage change value across all measures (Fig. 3). This trend might suggest a time-dependent improvement in performance indices, for example, a within-session practice effect. However, none of these changes were significant when tested individually.
Discussion
We found that induction of bradykinesia by haloperidol was associated with reduced baseline firing rate, bursting activity, and movement-related firing. Together, these changes in cell-firing properties demonstrate that systemic dopamine D2 receptor blockade is associated with a profound disruption of cortex activity. This is consistent with current models of mechanisms underlying movement disorders in hypodopaminergic states, in which impaired function of the basal ganglia circuits is assumed to lead to reduced excitatory drive to the cortex and thus insufficient activation of the corticospinal tract, the final common pathway for descending control of voluntary movement (Albin et al., 1989; Alexander and Crutcher, 1990; Wichmann and DeLong, 2003).
For activity recorded at rest, there is considerable evidence that reduced dopamine function is associated with an increase in neuronal firing rates and burst firing in the internal part of the globus pallidus (GPi), a major output structure of the basal ganglia that projects to and inhibits the thalamus (Miller and DeLong, 1987; Filion and Tremblay, 1991; Bergman et al., 1994; Boraud et al., 2002). This increased activity in the inhibitory projection neurons from the basal ganglia would be expected to suppress thalamocortical projections. Indeed, evidence from the cat shows that during acute dopamine receptor blockade with haloperidol, cortically projecting thalamic neurons that receive GPi input have reduced baseline firing (Voloshin et al., 1994). However, previous studies in monkeys failed to find a change in motor cortex firing rate at rest in monkeys with 1-methyl-4-phenyl-1,2,3,6-tetrahydropyridine (MPTP) lesions of the dopamine pathways (Doudet et al., 1990; Goldberg et al., 2002). This may reflect differences in the severity of the behavioral effect of the dopamine depletion, which was mild in one of the studies (Doudet et al., 1990). Another possible explanation relates to the statistical power of investigations in chronic models. We found that changes at rest, detected using within-cell comparisons, were small in magnitude. Such small changes would require large numbers of cells to reach significance when comparing different populations of neurons, as in chronic studies.
Although much research has focused on changes in baseline or resting firing rates, resting activity per se is not directly involved in generating movements, and it is not clear how such changes would impact movement, except insofar as the changes may reflect the existence of generally disordered inputs to the cortical networks. Consistent with this, although the correlation between changes in baseline firing rate and movement performance was significant, the magnitude was very small. In contrast, analysis of modulations in activity around the time of movements more directly addresses the changes associated with bradykinetic movements. The second main finding of this study was that haloperidol-induced bradykinesia was associated with reductions in the number and amplitude of significant movement-related modulations in motor cortex neurons, and the extent of these changes was correlated with change in movement speed. These findings are consistent with previous studies that noted decreases in the proportion of activated motor cortex cells and/or the amplitudes of movement-related modulations in cell activity in animals with chronic MPTP (Watts and Mandir, 1992) or electrolytic (Gross et al., 1983) lesions of the nigrostriatal dopaminergic pathway. In contrast, in MPTP-treated monkeys with relatively mild bradykinesia (movement time increase <25%), no such changes in movement-related activity were apparent (Doudet et al., 1990).
The reduced movement-related activity of cortical cells during periods of haloperidol-induced bradykinesia may be attributable to impaired ability to generate bursts of action potentials. Indeed, we found significant reduction in bursting activity in the cortex at rest when no reaching movements were performed. This was not secondary to the reduced firing rate of the cells affecting the sensitivity of the autocorrelation, because the recording durations were adjusted so that equivalent total numbers of spikes were included in all analyses. This result contrasts with a previous report in severe chronic MPTP-induced dopamine depletion in monkeys (Goldberg et al., 2002), in which an increase in bursting was found. Similarly, we found a significant reduction in the level of cross-correlation between cells during rest, whereas there was an increase in the MPTP-treated monkeys. The most likely cause of these differences is that, unlike the bradykinetic state of the rats in the present study, the monkeys were so severely affected that they were unable to move at all, with the changes seen reflecting extreme muscle rigidity or tremor (Goldberg et al., 2002).
Neuroleptic-induced bradykinesia, as studied here, or any neurotoxic models affecting the mesocortical dopaminergic pathways could affect cortical excitability directly via changes in dopamine function within the motor cortex, in addition to effects within the basal ganglia. A low concentration of dopamine is present in the motor cortex associated with a small population of low-affinity receptors (Scatton et al., 1983; Boyson et al., 1986; Richfield et al., 1989; Leysen et al., 1992). However, our within-session analysis of movement-related activity showed that under haloperidol, cells were sometimes capable of generating normal levels of activity associated with normal movement times. Thus, it is unlikely that the overall changes seen in the present study were attributable to direct reductions in cortical excitability.
In addition to ruling out a generalized sedative effect on cortical function, the finding that motor cortex can occasionally produce normal levels of activity in the face of reduced systemic dopamine function is of possible functional significance. Occasional normal movements (“paradoxical kinesia”) produced in the context of overall bradykinesia/akinesia have long been reported in severe Parkinson's disease (Wilson, 1925; Denny-Brown, 1968; Glickstein and Stein, 1991) and are seen also in primates with MPTP lesions of the dopamine pathways (Miller and DeLong, 1987). Such paradoxical kinesia in chronic Parkinsonism has been suggested to be caused by activation of alternative, nondopamine-dependent inputs to motor cortex that on occasion are able to trigger movements (Glickstein and Stein, 1991). This mechanism would imply normal cortical activation on these occasions, which is what we found in equivalent paradoxical movements under acute D2 blockade.
Together, the reduced baseline and task-related firing rates and indices of bursting and synchronization are consistent with disordered recruitment of cortical cell assemblies (Wickens et al., 1994), secondary to impaired basal ganglia-thalamocortical loop function (Voloshin et al., 1994; Pessiglione et al., 2005). In turn, task-related bursts of activity in motor cortex neurons are directly involved in coding force output by muscles (Evarts, 1968; Smith et al., 1975; Cheney and Fetz, 1980; Evarts et al., 1983; Kalaska et al., 1989). Coincident bursting, as detected by the type of broad cross-correlation peaks that typified the present data, may be essential for reliable recruitment of spinal motor neuronal pools (Lisman, 1997; Rekling et al., 2000). Thus, changes in burst firing at the individual cell level and in synchronization across cells would have an additive effect leading to a profound reduction in drive for the recruitment of spinal motor neurons. Such changes may explain the reductions in peak muscle force and the rate of force development observed in neuroleptic-induced bradykinesia in rat (Hauber and Schmidt, 1990; Hauber, 1996) and in human Parkinson's disease (Dietz et al., 1974; Petajan and Jarcho, 1975; Milner-Brown et al., 1979; Stelmach and Worringham, 1988; Stelmach et al., 1989; Wierzbicka et al., 1991; Corcos et al., 1996)
Footnotes
This study was supported by a grant from the New Zealand Lottery Grants Board. We thank B. Niven for statistical advice and Alan Herbison for comments on this manuscript.
Correspondence should be addressed to Dr. Brian Hyland, Department of Physiology, School of Medical Sciences, University of Otago, P.O. Box 913, Dunedin 9001, New Zealand. E-mail: brian.hyland@otago.ac.nz.
Copyright © 2005 Society for Neuroscience 0270-6474/05/255700-10$15.00/0
References
- Albin RL, Young AB, Penney JB (1989) The functional anatomy of basal ganglia disorders. Trends Neurosci 12: 366-375. [DOI] [PubMed] [Google Scholar]
- Alexander GE, Crutcher MD (1990) Functional architecture of basal ganglia circuits: neural substrates of parallel processing. Trends Neurosci 13: 266-271. [DOI] [PubMed] [Google Scholar]
- Berardelli A, Rothwell JC, Thompson PD, Hallett M (2001) Pathophysiology of bradykinesia in Parkinson's disease. Brain 124: 2131-2146. [DOI] [PubMed] [Google Scholar]
- Bergman H, Wichmann T, Karmon B, DeLong MR (1994) The primate subthalamic nucleus. II. Neuronal activity in the MPTP model of parkinsonism. J Neurophysiol 72: 507-520. [DOI] [PubMed] [Google Scholar]
- Bonfiglioli C, DeBerti G, Nichelli P, Nicoletti R, Castiello U (1998) Kinematic analysis of the reach to grasp movement in Parkinson's and Huntington's disease subjects. Neuropsychologia 36: 1203-1208. [DOI] [PubMed] [Google Scholar]
- Boraud T, Bezard E, Bioulac B, Gross CE (2002) From single extracellular unit recording in experimental and human Parkinsonism to the development of a functional concept of the role played by the basal ganglia in motor control. Prog Neurobiol 66: 265-283. [DOI] [PubMed] [Google Scholar]
- Boyson SJ, McGonigle P, Molinoff PB (1986) Quantitative autoradiographic localization of the D1 and D2 subtypes of dopamine receptors in rat brain. J Neurosci 6: 3177-3188. [DOI] [PMC free article] [PubMed] [Google Scholar]
- Breier A, Meehan K, Birkett M, David S, Ferchland I, Sutton V, Taylor CC, Palmer R, Dossenbach M, Kiesler G, Brook S, Wright P (2002) A double-blind, placebo-controlled dose-response comparison of intramuscular olanzapine and haloperidol in the treatment of acute agitation in schizophrenia. Arch Gen Psychiatry 59: 441-448. [DOI] [PubMed] [Google Scholar]
- Chapin JK, Woodward DJ (1986) Distribution of somatic sensory and active-movement neuronal discharge properties in the MI-SI cortical border area in the rat. Exp Neurol 91: 502-552. [DOI] [PubMed] [Google Scholar]
- Chen MT, Morales M, Woodward DJ, Hoffer BJ, Janak PH (2001) In vivo extracellular recording of striatal neurons in the awake rat following unilateral 6-hydroxydopamine lesions. Exp Neurol 171: 72-83. [DOI] [PubMed] [Google Scholar]
- Cheney PD, Fetz EE (1980) Functional classes of primate corticomotoneuronal cells and their relation to active force. J Neurophysiol 44: 773-791. [DOI] [PubMed] [Google Scholar]
- Corcos DM, Chen CM, Quinn NP, McAuley J, Rothwell JC (1996) Strength in Parkinson's disease: relationship to rate of force generation and clinical status. Ann Neurol 39: 79-88. [DOI] [PubMed] [Google Scholar]
- Denny-Brown D (1968) Clinical symptomatology of diseases of the basal ganglia. In: Diseases of the basal ganglia (Vinken PJ, Bruyn GW, eds), pp 133-172. Amsterdam: North Holland.
- Dick JP, Cowan JM, Day BL, Berardelli A, Kachi T, Rothwell JC, Marsden CD (1984) The corticomotoneurone connection is normal in Parkinson's disease. Nature 310: 407-409. [DOI] [PubMed] [Google Scholar]
- Dietz V, Hillesheimer W, Freund HJ (1974) Correlation between tremor, voluntary contraction, and firing pattern of motor units in Parkinson's disease. J Neurol Neurosurg Psychiatry 37: 927-937. [DOI] [PMC free article] [PubMed] [Google Scholar]
- Dolbakyan E, Hernandez-Mesa N, Bures J (1977) Skilled forelimb movements and unit activity in motor cortex and caudate nucleus in rats. Neuroscience 2: 73-80. [DOI] [PubMed] [Google Scholar]
- Doudet DJ, Gross C, Arluison M, Bioulac B (1990) Modifications of precentral cortex discharge and EMG activity in monkeys with MPTP-induced lesions of DA nigral neurons. Exp Brain Res 80: 177-188. [DOI] [PubMed] [Google Scholar]
- Evarts EV (1968) Relation of pyramidal tract activity to force exerted during voluntary movement. J Neurophysiol 31: 14-27. [DOI] [PubMed] [Google Scholar]
- Evarts EV, Fromm C, Kroller J, Jennings VA (1983) Motor cortex control of finely graded forces. J Neurophysiol 49: 1199-1215. [DOI] [PubMed] [Google Scholar]
- Filion M, Tremblay L (1991) Abnormal spontaneous activity of globus pallidus neurons in monkeys with MPTP-induced parkinsonism. Brain Res 547: 142-151. [PubMed] [Google Scholar]
- Fleminger S (1992) Control of simultaneous movements distinguishes depressive motor retardation from Parkinson's disease and neuroleptic parkinsonism. Brain 115: 1459-1480. [DOI] [PubMed] [Google Scholar]
- Gioanni Y, Lamarche M (1985) A reappraisal of rat motor cortex organization by intracortical microstimulation. Brain Res 344: 49-61. [DOI] [PubMed] [Google Scholar]
- Glickstein M, Stein J (1991) Paradoxical movement in Parkinson's disease. Trends Neurosci 14: 480-482. [DOI] [PubMed] [Google Scholar]
- Goldberg JA, Boraud T, Maraton S, Haber SN, Vaadia E, Bergman H (2002) Enhanced synchrony among primary motor cortex neurons in the 1-methyl-4-phenyl-1,2,3,6-tetrahydropyridine primate model of Parkinson's disease. J Neurosci 22: 4639-4653. [DOI] [PMC free article] [PubMed] [Google Scholar]
- Gross C, Feger J, Seal J, Haramburu P, Bioulac B (1983) Neuronal activity in area 4 and movement parameters recorded in trained monkeys after unilateral lesion of the substantia nigra. Exp Brain Res [Suppl] 7: 181-193. [Google Scholar]
- Haslinger B, Erhard P, Kampfe N, Boecker H, Rummeny E, Schwaiger M, Conrad B, Ceballos-Baumann AO (2001) Event-related functional magnetic resonance imaging in Parkinson's disease before and after levodopa. Brain 124: 558-570. [DOI] [PubMed] [Google Scholar]
- Hauber W (1996) Impairments of movement initiation and execution induced by a blockade of dopamine D1 or D2 receptors are reversed by a blockade of N-methyl-d-aspartate receptors. Neuroscience 73: 121-130. [DOI] [PubMed] [Google Scholar]
- Hauber W, Schmidt WJ (1990) The NMDA antagonist dizocilpine (MK-801) reverses haloperidol-induced movement initiation deficits. Behav Brain Res 41: 161-166. [DOI] [PubMed] [Google Scholar]
- Heimer G, Bar-Gad I, Goldberg JA, Bergman H (2002) Dopamine replacement therapy reverses abnormal synchronization of pallidal neurons in the 1-methyl-4-phenyl-1,2,3,6-tetrahydropyridine primate model of parkinsonism. J Neurosci 22: 7850-7855. [DOI] [PMC free article] [PubMed] [Google Scholar]
- Hyland B (1998) Neural activity related to reaching and grasping in rostral and caudal regions of rat motor cortex. Behav Brain Res 94: 255-269. [DOI] [PubMed] [Google Scholar]
- Hyland BI, Jordan VMB (1997) Muscle activity during forelimb reaching movements in rats. Behav Brain Res 85: 175-186. [DOI] [PubMed] [Google Scholar]
- Jahanshahi M, Jenkins IH, Brown RG, Marsden CD, Passingham RE, Brooks DJ (1995) Self-initiated versus externally triggered movements. I. An investigation using measurement of regional cerebral blood flow with PET and movement-related potentials in normal and Parkinson's disease subjects. Brain 118: 913-933. [DOI] [PubMed] [Google Scholar]
- Jenkins IH, Fernandez W, Playford ED, Lees AJ, Frackowiak RSJ, Passingham RE, Brooks DJ (1992) Impaired activation of the supplementary motor area in Parkinson's disease is reversed when akinesia is treated with apomorphine. Ann Neurol 32: 749-757. [DOI] [PubMed] [Google Scholar]
- Kalaska JF, Cohen DA, Hyde ML, Prud'homme M (1989) A comparison of movement direction-related versus load direction-related activity in primate motor cortex, using a two-dimensional reaching task. J Neurosci 9: 2080-2102. [DOI] [PMC free article] [PubMed] [Google Scholar]
- Kreiss DS, Mastropietro CW, Rawji SS, Walters JR (1997) The response of subthalamic nucleus neurons to dopamine receptor stimulation in a rodent model of Parkinson's disease. J Neurosci 17: 6807-6819. [DOI] [PMC free article] [PubMed] [Google Scholar]
- Kruger J, Aiple F (1988) Multimicroelectrode investigation of monkey striate cortex: spike train correlations in the infragranular layers. J Neurophysiol 60: 798-828. [DOI] [PubMed] [Google Scholar]
- Leysen JE, Janssen PM, Gommeren W, Wynants J, Pauwels PJ, Janssen PA (1992) In vitro and in vivo receptor binding and effects on monoamine turnover in rat brain regions of the novel antipsychotics risperidone and ocaperidone. Mol Pharmacol 41: 494-508. [PubMed] [Google Scholar]
- Lisman JE (1997) Bursts as a unit of neural information: making unreliable synapses reliable. Trends Neurosci 20: 38-43. [DOI] [PubMed] [Google Scholar]
- Marsden CD (1989) Slowness of movement in Parkinson's disease. Mov Disord 4: S26-S37. [DOI] [PubMed] [Google Scholar]
- Mayfield RD, Randall PK, Spirduso WW, Wilcox RE (1993) Selective D1 and D2 dopamine receptor antagonists produce differential effects on reaction time in the rat. Pharmacol Biochem Behav 46: 759-768. [DOI] [PubMed] [Google Scholar]
- Miller WC, DeLong MR (1987) Altered tonic activity of neurons in the globus pallidus and subthalamic nucleus in the primate MPTP model of Parkinsonism. In: The basal ganglia II (Carpenter MB, Jayaraman A, eds), pp 415-427. New York: Plenum.
- Milner-Brown HS, Fisher MA, Weiner WJ (1979) Electrical properties of motor units in Parkinsonism and a possible relationship with bradykinesia. J Neurol Neurosurg Psychiatry 42: 35-41. [DOI] [PMC free article] [PubMed] [Google Scholar]
- Moroz VM, Bures J (1984) Effects of lateralized reaching and cerebellar stimulation on unit activity of motor cortex and caudate nucleus in rats. Exp Neurol 84: 47-57. [DOI] [PubMed] [Google Scholar]
- Murphy JT, Kwan HC, Wong YC (1985) Cross correlation studies in primate motor cortex: synaptic interaction and shared input. Can J Neurol Sci 12: 11-23. [DOI] [PubMed] [Google Scholar]
- Neafsey EJ, Sievert C (1982) A second forelimb motor area exists in rat frontal cortex. Brain Res 232: 151-156. [DOI] [PubMed] [Google Scholar]
- Neafsey EJ, Bold EL, Haas G, Hurley-Gius KM, Quirk G, Sievert CF, Terreberry RR (1986) The organization of the rat motor cortex: a microstimulation mapping study. Brain Res 396: 77-96. [DOI] [PubMed] [Google Scholar]
- Obeso JA, Rodriguez-Oroz MC, Rodriguez M, Arbizu J, Gimenez-Amaya JM (2002) The basal ganglia and disorders of movement: pathophysiological mechanisms. News Physiol Sci 17: 51-55. [DOI] [PubMed] [Google Scholar]
- Ohman R (1977) Neurometabolic and behavioural effects of haloperidol in relation to drug levels in serum and brain. Naunyn Schmiedebergs Arch Pharmacol 299: 105-114. [DOI] [PubMed] [Google Scholar]
- Pan HS, Walters JR (1988) Unilateral lesion of the nigrostriatal pathway decreases the firing rate and alters the firing pattern of globus pallidus neurons in the rat. Synapse 2: 650-656. [DOI] [PubMed] [Google Scholar]
- Pelled G, Bergman H, Goelman G (2002) Bilateral overactivation of the sensorimotor cortex in the unilateral rodent model of Parkinson's disease—a functional magnetic resonance imaging study. Eur J Neurosci 15: 389-394. [DOI] [PubMed] [Google Scholar]
- Pessiglione M, Guehl D, Rolland AS, Francois C, Hirsch EC, Feger J, Tremblay L (2005) Thalamic neuronal activity in dopamine-depleted primates: evidence for a loss of functional segregation within basal ganglia circuits. J Neurosci 25: 1523-1531. [DOI] [PMC free article] [PubMed] [Google Scholar]
- Petajan JH, Jarcho LW (1975) Motor unit control in Parkinson's disease and the influence of levodopa. Neurology 25: 866-869. [DOI] [PubMed] [Google Scholar]
- Playford ED, Jenkins IH, Passingham RE, Nutt J, Frackowiak RS, Brooks DJ (1992) Impaired mesial frontal and putamen activation in Parkinson's disease: a positron emission tomography study. Ann Neurol 32: 151-161. [DOI] [PubMed] [Google Scholar]
- Poizner H, Feldman AG, Levin MF, Berkinblit MB, Hening WA, Patel A, Adamovich SV (2000) The timing of arm-trunk coordination is deficient and vision-dependent in Parkinson's patients during reaching movements. Exp Brain Res 133: 279-292. [DOI] [PubMed] [Google Scholar]
- Rascol O, Sabatini U, Chollet F, Celsis P, Montastruc JL, Marc-Vergnes JP, Rascol A (1992) Supplementary and primary sensory motor area activity in Parkinson's disease. Regional cerebral blood flow changes during finger movements and effects of apomorphine. Arch Neurol 49: 144-148. [DOI] [PubMed] [Google Scholar]
- Rascol O, Sabatini U, Chollet F, Fabre N, Senard JM, Montastruc JL, Celsis P, Marcvergnes JP, Rascol A (1994) Normal activation of the supplementary motor area in patients with Parkinson's disease undergoing long-term treatment with levodopa. J Neurol Neurosurg Psychiatry 57: 567-571. [DOI] [PMC free article] [PubMed] [Google Scholar]
- Raz A, Vaadia E, Bergman H (2000) Firing patterns and correlations of spontaneous discharge of pallidal neurons in the normal and the tremulous 1-methyl-4-phenyl-1,2,3,6-tetrahydropyridine vervet model of parkinsonism. J Neurosci 20: 8559-8571. [DOI] [PMC free article] [PubMed] [Google Scholar]
- Rekling JC, Funk GD, Bayliss DA, Dong XW, Feldman JL (2000) Synaptic control of motoneuronal excitability. Physiol Rev 80: 767-852. [DOI] [PMC free article] [PubMed] [Google Scholar]
- Richfield EK, Young AB, Penney JB (1989) Comparative distributions of dopamine D-1 and D-2 receptors in the cerebral cortex of rats, cats, and monkeys. J Comp Neurol 286: 409-426. [DOI] [PubMed] [Google Scholar]
- Ruskin DN, Bergstrom DA, Walters JR (2002) Nigrostriatal lesion and dopamine agonists affect firing patterns of rodent entopeduncular nucleus neurons. J Neurophysiol 88: 487-496. [DOI] [PubMed] [Google Scholar]
- Sabatini U, Boulanouar K, Fabre N, Martin F, Carel C, Colonnese C, Bozzao L, Berry I, Montastruc JL, Chollet F, Rascol O (2000) Cortical motor reorganization in akinetic patients with Parkinson's disease: a functional MRI study. Brain 123: 394-403. [DOI] [PubMed] [Google Scholar]
- Sanderson P, Mavoungou R, Albe-Fessard D (1986) Changes in substantia nigra pars reticulata activity following lesions of the substantia nigra pars compacta. Neurosci Lett 67: 25-30. [DOI] [PubMed] [Google Scholar]
- Scatton B, Javoy-Agid F, Rouquier L, Dubois B, Agid Y (1983) Reduction of cortical dopamine, noradrenaline, serotonin and their metabolites in Parkinson's disease. Brain Res 275: 321-328. [DOI] [PubMed] [Google Scholar]
- Sheridan MR, Flowers KA, Hurrell J (1987) Programming and execution of movement in Parkinson's disease. Brain 110: 1247-1271. [DOI] [PubMed] [Google Scholar]
- Singer W, Gray CM (1995) Visual feature integration and the temporal correlation hypothesis. Annu Rev Neurosci 18: 555-586. [DOI] [PubMed] [Google Scholar]
- Smith AM, Hepp-Reymond MC, Wyss UR (1975) Relation of activity in precentral cortical neurons to force and rate of force change during isometric contractions of finger muscles. Exp Brain Res 23: 315-332. [DOI] [PubMed] [Google Scholar]
- Stashkevich IS, Bures J (1981) Correlation analysis of neuronal interaction in the motor cortex of rats during performance of a discrete instrumental reaction. Int J Neurosci 12: 1-6. [DOI] [PubMed] [Google Scholar]
- Stelmach GE, Worringham CJ (1988) The preparation and production of isometric force in Parkinson's disease. Neuropsychologia 26: 93-103. [DOI] [PubMed] [Google Scholar]
- Stelmach GE, Teasdale N, Phillips J, Worringham CJ (1989) Force production characteristics in Parkinson's disease. Exp Brain Res 76: 165-172. [DOI] [PubMed] [Google Scholar]
- Storozhuk VM, Bracha V, Brozek G, Bures J (1984) Unit activity of motor cortex during acoustically signalled reaching in rats. Behav Brain Res 12: 317-326. [DOI] [PubMed] [Google Scholar]
- Turner RS, Grafton ST, McIntosh AR, DeLong MR, Hoffman JM (2003) The functional anatomy of parkinsonian bradykinesia. NeuroImage 19: 163-179. [DOI] [PubMed] [Google Scholar]
- Villa AE, Bajo Lorenzana VM, Vantini G (1996) Nerve growth factor modulates information processing in the auditory thalamus. Brain Res Bull 39: 139-147. [DOI] [PubMed] [Google Scholar]
- Voloshin M, Lukhanina EP, Kolomietz BP, Prokopenko VF, Rodionov VA (1994) Electrophysiological investigation of thalamic neuronal mechanisms of motor disorders in parkinsonism: an influence of D2ergic transmission blockade on excitation and inhibition of relay neurons in motor thalamic nuclei of cat. Neuroscience 62: 771-781. [DOI] [PubMed] [Google Scholar]
- Watts RL, Mandir AS (1992) The role of motor cortex in the pathophysiology of voluntary movement deficits associated with parkinsonism. Neurol Clin 10: 451-469. [PubMed] [Google Scholar]
- White IM, Rebec GV (1993) Responses of rat striatal neurons during performance of a lever-release version of the conditioned avoidance response task. Brain Res 616: 71-82. [DOI] [PubMed] [Google Scholar]
- Wichmann T, DeLong MR (2003) Functional neuroanatomy of the basal ganglia in Parkinson's disease. Adv Neurol 91: 9-18. [PubMed] [Google Scholar]
- Wickens J, Hyland B, Anson G (1994) Cortical cell assemblies: a possible mechanism for motor programs. J Mot Behav 26: 66-82. [DOI] [PubMed] [Google Scholar]
- Wierzbicka MM, Wiegner AW, Logigian EL, Young RR (1991) Abnormal most-rapid isometric contractions in patients with Parkinson's disease. J Neurol Neurosurg Psychiatry 54: 210-216. [DOI] [PMC free article] [PubMed] [Google Scholar]
- Wilson FA, O'Scalaidhe SP, Goldman-Rakic PS (1994) Functional synergism between putative gamma-aminobutyrate-containing neurons and pyramidal neurons in prefrontal cortex. Proc Natl Acad Sci USA 91: 4009-4013. [DOI] [PMC free article] [PubMed] [Google Scholar]
- Wilson SAK (1925) Disorders of motility and of muscle tone. Lancet 2: 1-10, 53-62. [Google Scholar]
- Zhuravin IV, Bures J (1989) Activity of cortical and caudatal neurons accompanying instrumental prolongation of the extension phase of reaching in rats. Int J Neurosci 49: 213-220. [DOI] [PubMed] [Google Scholar]