

Abstract
The mouse κ opioid receptor (KOR) gene is constitutively expressed in P19 embryonic stem cells but is first suppressed and reactivated during retinoic acid (RA)-induced neuronal differentiation. However, no RA response element (RARE) can be found in this gene regulatory region. The suppression and reactivation of the KOR gene in this neuronal differentiation model suggested chromatin remodeling occurred on this gene promoter triggered by RA induction. This study asks whether RA induces alteration in the nucleosomal structure of this gene promoter that has no apparent RARE and, if so, how RA remodels chromatin of this promoter. The results revealed two loose nucleosomes, N1 at -44 (3′ boundary) from the transcription initiation site and N2 spanning the transcription initiation site, that are relevant to active transcription. RA formed a repressive chromatin configuration of this promoter by compacting nucleosome N1, followed by nucleosome N2 condensation. Chromatin immunoprecipitation assay demonstrated RA induced replacement of the c-Myc/Max complex with the Max/Mad1 complex on the E box located within nucleosome N1, coinciding with reduced Sp1 binding to GC boxes located within nucleosome N2 and recruitment of chromatin remodeling factor Brahma-related gene 1 (BRG-1) to this promoter. Consistently, histone deacetylation, Lys9 methylation, and hypophosphorylation of RNA polymerase II C-terminal domain were detected on this promoter after RA treatment. It is concluded that RA induces KOR gene suppression, as early neuronal differentiation marker, by inducing substitution of c-Myc/Max with Max/Mad on the E box and by BRG-1 involved nucleosome recruitment and chromatin condensation, thereby abolishing Sp1 binding.
Keywords: retinoic acid, κ opioid receptor gene, chromatin remodeling, nucleosome, c-Myc/Max/Mad1, gene transcription
Introduction
The mouse embryonal carcinoma cell P19 is a widely used model for cell differentiation. Retinoic acid (RA) is the most potent differentiation inducer of this model, in particular into neurons. Using this model, we have shown the mouse κ opioid receptor (KOR) gene is regulated by RA during P19 differentiation. Specifically, the KOR gene is transiently activated by RA through the second-messenger systems (Li et al., 2002) and suppressed in the process of differentiation (Bi et al., 2001). The RA-triggered suppression of the KOR gene has been demonstrated using a transgenic mouse model. However, no RA response element (RARE) is found in the upstream 3 kb DNA fragment of this gene, which appears to be responsive to RA signals in both animals and P19. The mysterious role of RA in triggering this phase of gene silencing of KOR, which contains no RARE, during P19 neuronal differentiation has been an intriguing problem in understanding opioid receptor gene regulation.
Two promoters are known for KOR, promoter 1 (P1) and P2. P2 is located within intron 1 and is active only in certain neural tissues of adult animals (Bi et al., 2001), which is silenced because of Ikaros transcription factor binding that recruits histone deacetylases to this promoter (Hu et al., 2001). P1 is subjected to RA regulation in P19 (Bi et al., 2001; Li et al., 2002). Two sets of transcription factor binding sites have been identified for P1, including several Sp1 sites located in close proximity to transcription initiation sites (Li et al., 2002) and a c-Myc binding E box that can activate P1 (Park et al., 2002). Because no RARE is present in this promoter, although RA can rapidly silence this gene, it has been hypothesized that RA triggers a genomic response of KOR at the level of chromatin remodeling during the course of P19 differentiation.
Chromatin remodeling is brought about primarily by ATP-dependent chromatin remodeling factors, such as the mating typing switching/sucrose nonfermenting (SWI/SNF) complex, which remove nucleosomes from the gene promoters by a disassembly or a sliding mechanism. For example, nucleosomes are disassembled from the PHO5 promoter during transcriptional activation in the yeast Saccharomyces cerevisiae (Boeger et al., 2003, 2004; Reinke and Horz, 2003). Activation of the interferon-β promoter in HeLa cells has been shown to involve the sliding of a nucleosome away from the TATA box (Lomvardas and Thanos, 2001). Conversely, repression of POT1 and REC104 in yeast appears to result from sliding of nucleosomes from upstream or downstream positions toward the promoters, induced by the chromatin-remodeling factor Isw2p (Fazzio and Tsukiyama, 2003).
In this study, we first examined the chromatin structure of KOR P1 in P19 before and after RA treatment. We then asked whether RA induced chromatin remodeling of this promoter and, if so, what factors were involved. The results were presented to delineate RA-triggered events on this promoter that induced transcription factor exchange and recruited chromatin remodeling factors to this promoter followed by chromatin condensation, thereby suppressing transcription from this promoter.
Materials and Methods
Cell culture and differentiation. P19 cells were cultured in modified Eagle's medium supplemented with 7.5% defined calf serum and 2.5% defined fetal bovine serum and treated with 1.0 × 10⁻⁶ m all-trans RA. For differentiation in aggregates, the procedures were followed as described previously (Chen et al., 1999). A total of 105 cells/ml were seeded on bacteriological Petri dishes in media containing 1.0 × 10⁻⁶ m RA. After 4 d, aggregates were segregated into single cells by DNase I and trypsin/EDTA and replated on gelatinized tissue culture dishes in the absence of RA. Treatment with 5 μg/ml cytosine arabinoside was at the sixth day of culture.
Northern blot. Total mRNA was isolated by using TRIzol (Invitrogen, San Diego, CA) from P19 cells harvested at the indicated times after RA treatment. Forty micrograms of total mRNA were separated on a 5% agarose/formaldehyde gel and transferred to Nytran membrane, followed by probing with the [α-32P]dCTP-labeled probe prepared from the mouse KOR cDNA spanning exons 1-4.
Preparation of nuclei and nuclease digestion. P19 cells treated with vehicle (control) or 10-6 m RA for the indicated days were cross-linked with 1% formaldehyde for 15 min, followed by the addition of 1.47 ml of 1 m glycine/10 ml culture to stop cross-linking. The procedures were performed with some modifications as described previously (Gui and Dean, 2001). The nuclei isolated from ∼108 cells (four plates) were suspended in 1 ml of wash buffer (10 mm Tris-HCl, pH 7.4, 15 mm NaCl, 50 mm KCl, 0.15 mm spermine, 0.5 mm spermidine, and 8.5% sucrose) and digested with micrococcal nuclease (MNase; 30-120 U; Worthington Biochemical, Freehold, NJ) or DNase I (2-30 mg/ml) for 6 min at 37°C. Reactions were stopped by the addition of 100 μl of 5 m NaCl and 100 μl of stop solution (10% SDS, 125 mm EDTA, and 1 mg/ml proteinase K) at 50°C for 3 h, and the temperature was increased to 65°C for at least 4 h to reverse cross-linking. The purified genomic DNA was redigested with 100 U of BglII at 37°C overnight and subjected to Southern blot hybridization. The probes are indicated in each figure: probe A [P1, 340 bp BglII-to-PstI fragment (for MNase digestion)] and probe B [P2, 263 bp SphI-to-PvuII fragment (for DNase I hypersensitivity and restriction enzyme accessibility)]. Probes were labeled with [α-32P]dCTP by the random priming method.
For restriction enzyme accessibility, nuclei from 108 cells were incubated with restriction endonucleases as indicated in the figures (100 U/reaction of each enzyme) at 37°C for 30 min. The isolated genomic DNA was digested with BglII (100 U) overnight.
Ligation-mediated PCR. The procedures were slightly modified from the protocol described previously (Carey and Smale, 2000). First-strand synthesis was performed using 1 μg of DNase I-digested DNA and primer 1 under the following conditions: 5 min at 95°C, 30 min at 60°C, and 10 min at 76°C. For nucleosome mapping, 1 μg of gel-purified mononucleosome DNA (see below for the preparation) was used without first-strand synthesis. Blunt-ended double-stranded DNA fragments were ligated with the annealed linker DNA (L1 and L2) at 17°C overnight, and the ligated DNAs were proceeded with PCR as follows using primer 2 and L1: DNase I (21 cycles) and MNase (23 cycles), 1 min (4 min for the first cycle) at 95°C, 2 min at 60°C, 5 min at 76°C, and an additional 5 min extension at 76°C. Labeling reaction was performed by the addition of labeled primer 3 (3′ end-labeling by using [γ-32P]ATP) to the PCR reaction, which was done with three more cycles as follows: 1 min (4 min for the first cycle) at 95°C, 2 min at 64°C, and 10 min at 76°C. The amplified and labeled DNA fragments were resolved in a 5% polyacrylamide/urea gel followed by exposure to a phosphimager screen. The primers and linker oligonucleotides used were as follows: primer 1, 5′-CTGACAAGATTATTTGGCCATTTTATTTGTATC-3′; primer 2, 5′-GTGCTACCACTTGCTTCCTTGCTTAAAG-3′; primer 3, 5′-GCTTCCTTGCTTAAAGACACTAGTCCTGGG-3′; L1, 5′-GCGGTGACCCGGGAGATCTGAATTC-3′; L2, 5′-GAATTCAGATC-3′.
Purification of mononucleosome and dinucleosome DNA and PCR amplification of nucleosomes N1 and N2. P19 nuclei were treated with 120 U of MNase at 37°C for 30 min. Genomic DNAs were separated on a 1.5% agarose gel. The bands corresponding to mononucleosome (150 bp) and dinucleosome (350 bp) were cut with a clean blade, and DNAs were isolated from the excised gel slice using the QIAquick gel extraction kit (Qiagen, Valencia, CA). The purified DNA was quantified and identified on an agarose gel again. PCR amplification was performed at 28 cycles, 45 s at 94°C, 45 s at 55-58°C, and 1 min at 72°C using the following primer sets: for N1, sense, primer 2 (see above, Ligation-mediated PCR) (primer a), antisense, 5′-GGATCATTCCGTGTGTTTGGAATTTC-3′ (primer b); for N2, sense, 5′-CAGCTTGGGCAGTTGGAGTTAGTGAG-3′ (primer c), antisense, 5′-TGCTCCCCATCTCAGCCTATCCC-3′ (primer d); for N3, sense, 5′-CCTCCAGCCCTGCCTGTACAGGCAAAG-3′ (primer e), antisense, 5′-GACTCCATGGTGAGCGCTGCAGCTGG-3′ (primer f); for exon 4, sense, 5′-ATCTGCATTTGGCTCCTG-3′ (primer g), antisense, 5′-TGAAGAGATCCCACCAG-5′ (primer h).
Western blot and chromatin immunoprecipitation assay. Nuclear proteins were extracted from P19 cells treated with 10-6 m RA and resolved on an SDS-acrylamide gel followed by Western blot using the indicated antibodies as described previously (Park and Wei, 2003). Cells treated with vehicle (control) or with RA were cross-linked with 1% formaldehyde. A total of ∼2.5 × 10⁷ cells were used for chromatin immunoprecipitation (ChIP) assay (Park and Wei, 2003). Sonicated cell extracts, which were normalized as the same amount of proteins, were precipitated with 2 μg of the following antibodies at 4°C overnight, followed by the addition of protein G beads for 1 h. The antibodies against c-Myc (sc-788), Max (sc-197), Mad1 (sc-766), heterochromatin protein-1 (HP1; sc-10217), Brahma (BRM)-related gene 1 (BRG-1) (sc-10768), BRG association factor 155 (BAF155; sc-10756), and BRM (sc-17828) were purchased from Santa Cruz Biotechnology (Santa Cruz, CA). The antibodies against Sp1 (07-124), Sp3 (07-107), acetylated histone H4 (AcH4; 06-866), histone deacetylase 1 (HDAC1; 06-720), HDAC2 (07-222), Lys9 methylated histone H3 (me-K9; 07-422), and phosphorylated RNA polymerase II C-terminal domain (p-PolII) were purchased from Upstate Biotechnology (Lake Placid, NY). Fifteen percent of cell extracts were used as input. Protein G beads were washed extensively, and the captured DNA was eluted twice with 250 μl of elution buffer (1% SDS and 1 m NaHCO3), which were reverse cross-linked at 65°C for 4 h. Precipitated DNA was amplified using primer 1 (see above, Ligation-mediated PCR) for the sense and primer d (as in the N2 analysis above) for the antisense.
Results
Chromatin structure of mouse KOR P1
To examine the chromatin structure of KOR P1 in P19 cells before and after RA treatment, limited MNase digestion coupled with Southern blot analysis was performed to map nucleosomes on the KOR P1. Nuclei isolated from P19 cells grown in RA-supplemented medium for 5 d or in regular medium (control) were treated with increasing amounts of MNase (Fig. 1). The presence of nucleosomes on KOR P1 was detected by the 32P-labeled probe for P1 (probe A). Figure 1 (top) shows the positions of the two KOR promoters, the exons, and probe A used in the following series of experiments. The ethidium bromide-stained chromatin DNA isolated from both control (Fig. 1, left, lanes 1-3) and RA-treated (lanes 5-7) cell nuclei clearly displayed regular nucleosomal ladders, indicating the success of MNase digestion of these samples. Southern blot analysis using the P1 probe (probe A) detected smearing of KOR P1 chromatin in control cells (Fig. 1, right, lanes 1-3) but relatively regular nucleosome arrays in RA-treated cells (lanes 5-7). This result showed the organization of KOR P1 chromatin into a nucleosome array in RA-induced P19 cells.
Figure 1.

Southern blot analysis of MNase-digested chromatin DNA is shown. The top illustrates the map of KOR gene promoters (P1 and P2) including two exons. Probe A used in the Southern blot experiments is depicted with restriction enzyme sites. The thick arrow and bar on the gene represent the major transcription initiation site, and the thin arrow indicates the alternative site of P2. BglII digestion generates a 1005 bp fragment. Nuclei were isolated from P19 cells treated without (-) or with 10-6 m RA for 5 d (+) and treated with 30, 60, and 120 U of MNase for 6 min at 37°C. Genomic DNA was isolated and analyzed by ethidium bromide staining of an agarose gel (bottom left) and Southern blot using [α-32P]-labeled probe A that spans ∼300 bp of P1 (bottom right). A representation of the three independent experiments is shown.
DNase I hypersensitivity of transcription initiation site of KOR P1
Because chromatin structure of the promoter region is closely associated with transcriptional activity, we speculated whether the chromatin configuration of the KOR promoter is consistent with its expression pattern during RA-induced P19 differentiation. Northern blot analysis revealed that KOR mRNA was accumulated up to 2 d (Fig. 2A, lanes 1-3) and drastically disappeared in long-term treatment (lanes 4, 5) as expected (Bi et al., 2001; Li et al., 2002), whereas 28S RNA was relatively constant (Fig. 2B). This agreed with the result shown in Figure 1 that RA induced nucleosome formation of the KOR promoter in P19 cells.
Figure 2.

Mapping of the HS sites to DNase I altered by RA treatment. A, KOR mRNA expression. Total RNA from P19 cells treated with 10-6 m RA (0, 1, 2, 3, and 5 d) was isolated and subjected to Northern blot using the [α-32P]-labeled KOR cDNA probe spanning exons 1-4 (top). 28S RNA was stained as an internal control (bottom). B, DNase I HS analysis. Nuclei isolated from P19 cells and differentiated (Diff.) cells treated as in A were treated with DNase I (2, 12, and 30 mg/ml) for 6 min at 37°C. The top illustrates the site of probe B that spans the P2 region with restriction enzyme sites. Bottom, Isolated genomic DNA was digested with BglII followed by Southern blot using [α-32P]-labeled probe B. DNase I HS sites were detected at ∼0.65 and 0.75 kb from the 3′ end of the fragments. C, LM-PCR analysis. The primers (Pr 1-3) used are illustrated (top). The asterisk on primer 3 represents its [γ-32P] end-labeling, and primer 3 starts at position -164 relative to the transcription initiation site of P1. DNase I-digested DNA (1 μg) was ligated with double-stranded linker DNA and was amplified by PCR using labeled primer 3 and linker L1. The sizes of amplified fragments is marked on the right as 105-210 bp (-84 and +21 in parentheses). D, Illustration of DNase I HS sites and GC boxes. The HS sites are located at positions -84 to +21 from the transcription initiation site of P1. Four GC boxes are shown overlapped in the HS sites. Experiments were performed at least twice independently.
To follow the DNase I hypersensitivity pattern of KOR P1 after RA induction, nuclei were isolated from control and RA-treated P19 cells and treated with increasing amounts of DNase I (2, 12, and 30 mg/ml). Isolated genomic DNAs were digested with BglII, followed by Southern blot analysis using the 32P-labeled probe extending from the 3′ end of the BglII fragment (probe B) (Fig. 2B, top). As shown in Figure 2B (bottom), complete BglII digestion generated the predicted 1 kb fragment of KOR genomic DNA. Two major groups of DNase I-hypersensitive (HS) sites were found, ∼0.75 and 0.65 kb from the 3′ end of the BglII fragment (Fig. 2B, arrowheads), whereas a very low concentration of the enzyme (2 mg/ml of DNase I) failed to do so (Fig. 2B, lanes 1, 4, 7, 10, 13, 16). These HS sites span for ∼100 bp around the major transcription initiation site of KOR P1. In control P19 cells, KOR P1 was readily sensitive to DNase I (Fig. 2B, lanes 2, 3). Although hypersensitivity remained apparent in cells treated with RA for 1 d (Fig. 2B, lanes 6, 7), it was dramatically reduced and barely detected in cells treated with RA for over 2 d (Fig. 2B, lanes 8-15). In fully differentiated cultures into neuronal cells (3 d after replating the aggregated cells with cytosine arabinoside), P1 was completely resistant to DNase I (Fig. 2B, lanes 16-18), supporting the notion that this promoter underwent remodeling in P19 cells during RA-induced differentiation.
To define the precise HS sites, ligation-mediated PCR (LM-PCR) was performed by using specific sets of primers (including 32P-labeled primer 3) and linkers to amplify the DNase I-digested P19 genomic DNAs (Fig. 2C). Figure 2C (top) depicts the primer sites used in this experiment. As the concentration of DNase I increased (12 and 30 mg/ml), the HS ladders intensified respectively (lanes 2, 3), whereas no band was detected in the mock digested sample (lane 1). In this LM-PCR analysis, seven HS sites formed two clusters within the region between the -84 (PCR fragment size, 105) and +21 (PCR fragment size, 210) positions relative to the transcription initiation site (+1), which was calculated by subtraction of the 25 bp linker from the PCR products (Fig. 2D). This was in agreement with the two clusters revealed in Figure 2B. Interestingly, this region contains the four Sp1-binding sites for P1 (Fig. 2D, GC box). Therefore, both the DNase I hypersensitivity assay and LM-PCR demonstrated two consistent clusters of HS sites around the transcription initiation sites of KOR P1, which became resistant to enzyme digestion after RA treatment.
RA-induced chromatin condensation of KOR transcription initiation site on P1
To map the nucleosome location on KOR P1, the restriction enzyme accessibility assay was performed. Nuclei isolated from P19 cells were treated with restriction endonucleases (ApoI, ApaI, PstI, StyI, PvuII, and mock digestion), and purified DNAs were digested with BglII to produce 1 kb fragments, followed by Southern blot analysis using the same probe as that used in the DNase I hypersensitivity assay (probe B). The putative nucleosomes on this promoter were named N1 and N2 (Fig. 3E), and the restricted sites were indicated (Fig. 3E, top). ApoI digested ∼40% genomic DNA from control cells but almost failed to digest the genomic DNA from RA-treated cells (Fig. 3A, compare lanes 2 of right and left panels). Similarly, ApaI was able to digest genomic DNA from control cells but failed to digest genomic DNA from RA-treated cells (Fig. 3A, lane 3). In contrast, a 599 bp fragment of the PstI-generated fragment seemed to be accessible in both control and RA-treated cells (Fig. 3A, lane 4). The 757 bp PstI site and the StyI site were less accessible (Fig. 3A, lanes 4 and 5). Because both ApoI and ApaI sites were within N1, this suggested that N1 was partially open in control cells and compacted in RA-treated cells. The PstI site (757 bp) and the StyI site were in N2, which appeared to be also partially open in control cells and became compacted in RA-treated cells. Another PstI site (599 bp) was located between nucleosomes and therefore was always accessible. PvuII failed to digest the genomic DNA from either control or RA-treated cells (Fig. 3A, lanes 6), indicating that this site, located in P2, was in a tightly packed nucleosome. This was consistent with the fact that P2 of the KOR gene remained silenced in differentiated P19 cells (Bi et al., 2001).
Figure 3.

Mapping of nucleosomes N1 and N2. A, Restriction enzyme accessibility. Nuclei isolated from P19 cells treated with vehicle (left) or 10-6 m RA for 5 d (RA 5 D; right) were digested with the indicated restriction enzymes or with a mock treatment for 30 min. The isolated genomic DNAs were digested with BglII overnight followed by Southern blot using [α-32P]-labeled probe B. Parental fragments of 1 kb were marked as BglII. The arrowheads on the left (ApoI and PstI) and on the right (ApaI and StyI) indicate the digested fragments: ApoI, 921 and 856 bp; PstI, 757 and 599 bp; ApaI, 810 bp; StyI, 709 bp. Experiments were performed three times. B, Time course of ApoI digestion. Experimental procedures are as in A with ApoI. The arrow marks the 1 kb BglII fragment, and the arrowheads indicate ApoI fragments. C, Time course of StyI digestion. Experimental procedures are as in A with StyI. The arrow marks the 1 kb BglII fragment, and the open arrowhead indicates the StyI fragment. D, LM-PCR analysis of purified mononucleosome DNA. P19 cells were treated with vehicle (lane 2) and RA for 5 d (lane 3). Without first-strand synthesis, mononucleosome DNA fragments purified (1 μg) after digestion with MNase were subjected to PCR amplification using [γ-32P]-labeled primer 3 shown in top panel of Figure 2 B. The right side of the figure depicts the amplified fragments and the length of nucleosomal DNA. Two experiments were conducted with identical results. E, Map of N1 and N2 nucleosomes. Restriction enzyme sites are depicted with arrows and abbreviated letters, and the determined locations of mononucleosomes on KOR P1 in control cells (top) and RA-treated cells (bottom) are shown. In control cells, N1 and N2 are loose nucleosomes (or open, light shaded). In RA-treated cells (RA5D), N1 and N2 became compact (solid oval shape). The 3′ margin of N1 is located at the -44 position, and relative positions of the E box and GC boxes are shown in N1 and N2.
To determine the kinetics of nucleosome reconfiguration in the time course of RA treatment, ApoI (for N1) (Fig. 3B) and StyI (for N2) (Fig. 3C) were used in digestion of the genomic DNA. Both the ApoI and StyI sites gradually became inaccessible after day 1 of RA treatment, but the StyI site seemed to lag slightly compared with the ApoI site, suggesting that RA first triggered N1 compaction in the early phase, followed by N2 condensation. This point was further supported by a detailed kinetic study using a PCR-based strategy to carefully purify mononucleosomes (Fig. 4).
Figure 4.
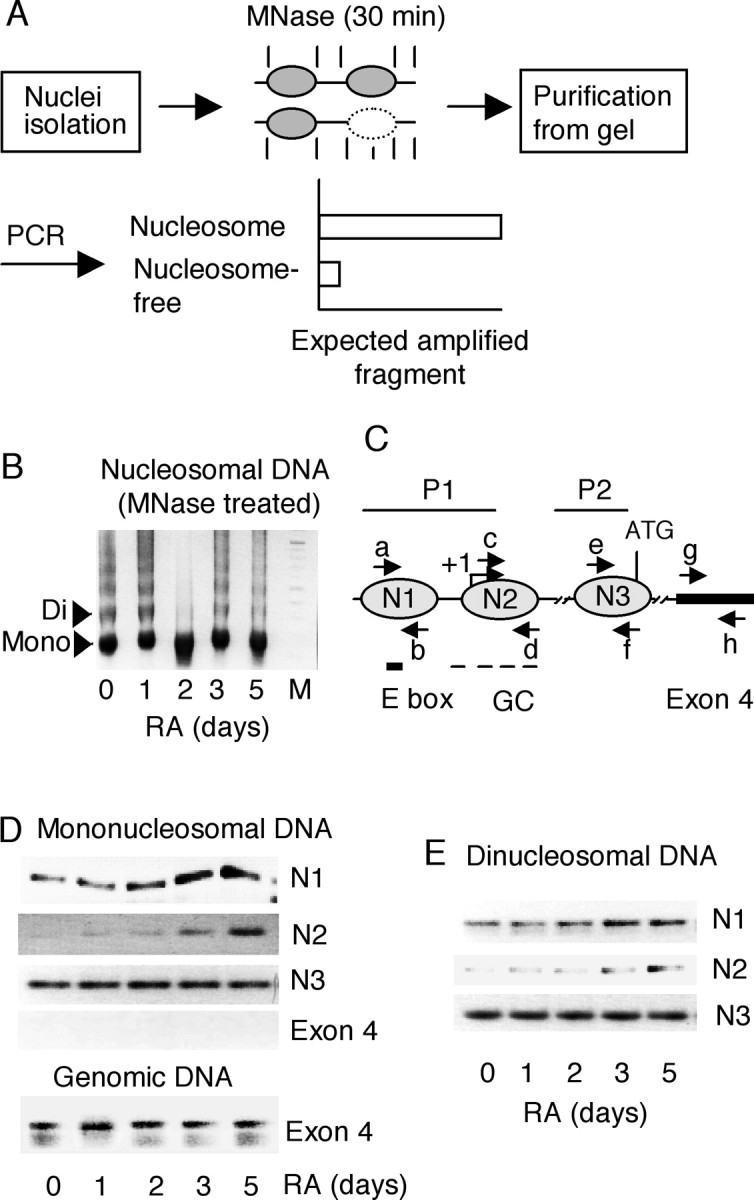
PCR-based analyses of N1 and N2 nucleosomes. A, Experimental flow chart. P19 nuclei were digested with 120 U of MNase for 30 min, which extensively digests the linker and nucleosome-free regions. Mononucleosomal and dinucleosomal DNAs were purified from an agarose gel. PCR amplification using the purified DNAs as templates is expected to produce the amplified fragments if the region forms a nucleosome structure. A lesser amount of amplified products is expected if the region is nucleosome free. B, Image of digested nucleosomes separated on an agarose gel before purification. Mono, Mononucleosome; Di, dinucleosome. C, Primers specific to N1, N2, and exon 4 regions are depicted. Each primer set was designed according to the predicted nucleosome positions. D, N1, N2, and exon 4 were PCR amplified from mononucleosomal DNA using the primers a and b (N1), c and d (N2), e and f (N3), and g and h (exon 4). Genomic DNAs isolated from sonicated cells were used for exon 4 amplification (primers g and h). E, PCR amplification from dinucleosomal DNA using the same primers. Two independent experiments were performed.
To define the exact border of N1, LM-PCR was conducted (Fig. 3D). Control or RA-treated P19 nuclei were digested with 120 U of MNase for 30 min, and genomic DNA was isolated and separated on an agarose gel. Mononucleosomal DNAs of ∼150 bp in size were isolated from the agarose gel and subjected to LM-PCR analysis using the same 32P-labeled primer as that was used in DNase I hypersensitivity (Fig. 2C). PCR produced a single band of 145 bp from the sample of RA-treated cells (Fig. 3D, lane 3), whereas a weak band in the same size was detected in the sample from control cells (lane 2). Subtraction of the 25 bp linker used in the PCR from the 145 bp PCR product gave a 120 bp fragment derived from nucleosome N1 (Fig. 3D, parentheses). This result mapped the 3′ border of N1 at the -44 position relative to the transcription initiation site (Fig. 3E, bottom).
Assembly of nucleosomes on KOR P1 in RA-treated P19 cells
The results presented above showed changes in chromatin structure on KOR P1 as a result of RA treatment. We then further examined the time course of RA-triggered alterations in the nucleosomal structure of this promoter. We designed a PCR-based assay to assess the relative amounts of mononucleosomal or dinucleosomal DNAs derived from a specific genomic DNA region as depicted in Figure 4A. This method allowed rapid assessment of the relative amounts of specific nucleosomes formed on a particular genomic DNA segment. Cell nuclei were isolated, partially digested with MNase, and separated on an agarose gel. Mononucleosomal and dinucleosomal fragments were isolated from an agarose gel (Fig. 4B) and amplified by PCR using primer pairs specific to a particular nucleosome (Fig. 4C). Because we were most interested in the region around the transcription initiation site, we then focused on N1, N2, and the nucleosome on P2 (named N3) for a control in this experiment. Figure 4D showed the result using mononucleosome DNA as a template. The intensity of nucleosome N1 was weakly detected in stem cells and increased significantly at day 2 after RA treatment (Fig. 4D, lane N1), indicating that tight packing of N1 began approximately day 2 of RA treatment. Nucleosome N2 was weakly detected in stem cells but was detected at a gradually increasing intensity later (day 3) (Fig. 4D, lane N2), indicating that N2 formed after the formation of N1. For a positive control, the nucleosome spanning the PvuII site in P2 (N3) was detected in stem cells and remained unchanged throughout RA treatment (Fig. 4D, lane N3). As a negative control, amplification of exon 4 produced no band because this region was expected to be in an open configuration and was nucleosome free (Fig. 4D, top, Exon 4), whereas the same region was amplified with genomic DNA (bottom, Exon 4). Similar results were obtained by using dinucleosomal DNAs as shown in Figure 4E. These results showed that tight packing of N1 occurred before N2 assembly in RA-treated P19 cells, consistent with restriction enzyme accessibility (Fig. 3).
RA-triggered exchange of c-Myc/Max/Mad on E box and reduced Sp1 binding
The region spanning N1 contains an E box, whereas the region spanning N2 contains four GC boxes (Fig. 4C). These DNA elements have been identified as the binding sites of transcription factors c-Myc and Sp1, respectively (Park et al., 2002; Li et al., 2002). Because the E box is a binding element of activating dimer c-Myc/Max and also of suppressive dimer Max/Mad1, it was tempting to speculate that RA-triggered assembly of N1 might be related to the exchange of transcription factors binding to the E box, whereas compaction of N2 might reduce its accessibility to Sp1 binding on the GC boxes, thereby suppressing transcription initiation. To examine whether the expression of these transcription factors was affected by RA treatment, and whether transcription factor exchange occurred on this promoter during RA treatment, we first performed Western blot analyses to detect the expression levels of these transcription factors as shown in Figure 5A. The level of c-Myc was suppressed by RA at day 3, coinciding with the elevation of Mad1. Their common heterodimer partner Max remained essentially unaffected. The expression of Sp family members such as Sp1 and Sp3, as well as actin control, also remained unchanged during the period of time examined.
Figure 5.

Nuclear expressions of transcription factors and their binding patterns on KOR P1 during P19 cell differentiation. A, Western blots. Nuclear extracts were isolated from P19 cells treated with 10-6 m RA for the indicated days. Western blot using the antibodies against c-Myc, Mad1, Max, Sp1, and Sp3 was performed. Anti-actin was also used as an endogenous control. B, Map of the c-Myc- and Sp1-binding sites and primer positions (a and d) that span N1 and N2 for ChIP assays. C, ChIP assays. P19 cells treated with RA were cross-linked with 1% formaldehyde and subjected to ChIP assays using the indicated transcription factor antibodies. Experiments were performed at least twice independently.
To examine the binding patterns of these transcription factors on KOR P1, we then performed ChIP assays. The positions of N1 and N2, as well as primers used to amplify DNA fragments after ChIP, are depicted in Figure 5B. The ChIP data are shown in Figure 5C. c-Myc initially bound to the E box on N1 (day 0) and left the DNA after RA treatment for 2 d, whereas increasing amounts of Mad1 were recruited to replace the c-Myc binding during RA treatment. As expected, Max always bound to N1. These results supported the notion that RA triggered the replacement of the c-Myc/Max complex with the Mad1/Max complex on N1 of KOR P1, coinciding with the condensation of nucleosome N1 on this promoter after RA treatment. Interestingly, although Sp1 and Sp3 levels were not significantly changed according to the Western blot result (Fig. 5A), Sp1 binding to the GC box of KOR P1 was dramatically reduced in the later phase of RA treatment, whereas Sp3 did not bind at any period (Fig. 5C). Presumably, this was because of the compaction of nucleosome N2, which restricted the GC boxes for Sp1 binding.
To further assess chromatin modification of this promoter, the ChIP assay was performed to examine several signature chromatin modifications in gene regulation. As shown in Figure 6A, RA triggered hypoacetylation (lane AcH4) and consistent HDAC1 recruitment, but not HDAC2 recruitment, which followed closely the Mad1-binding pattern (Fig. 5C). To confirm whether the HDAC2 result was truly negative on this promoter, its activity was verified on a known gene promoter, c-myc, which was known to recruit HDAC2 as shown in Figure 6A (bottom). RA also induced repressive Lys9 methylation of histone H3 (Fig. 6A, lane me-K9) and recruitment of HP1 (lane HP1) on this promoter, resulting in transcriptional suppression featured by a decrease in the phosphorylation of the RNA polymerase II C-terminal domain (lane p-PolII). According to these analyses, it seemed that histone deacetylation on this promoter occurred relatively early, whereas Lys9 methylation of H3 and subsequent formation of heterochromatin seemed to be the late events during chromatin remodeling of KOR P1. Formation of condensed chromatin on KOR P1 prompted us to examine the SWI/SNF family of chromatin remodeling complexes. Interestingly, the ATP-dependent chromatin remodeling factor BRG-1, but not BRM, was recruited to KOR P1 after RA treatment (Fig. 6B) without change in its expression level as shown on the Western blot (bottom, lane WB). BAF155 was also similarly recruited to this promoter during RA treatment (Fig. 6B).
Figure 6.

ChIP assays to determine binding patterns of chromatin modification and remodeling factors on KOR P1. A, ChIP assays were conducted using antibodies against the proteins (labeled on the left) involved in histone modification regulating promoter activity. The DNA precipitated by anti-HDAC2 was amplified with the primers specific to the NF-κB-binding site of the c-myc promoter as a positive control. B, ChIP assays were conducted using antibodies against the proteins (labeled on the left) that are involved in chromatin remodeling. BRG-1 was detected by Western blot (WB) using anti-BRG-1 (bottom). Experiments were performed at least twice independently.
Discussion
The mouse KOR gene P1 is regulated by RA in the P19 cell differentiation process. This study, for the first time, determines changes in the chromatin structure of the KOR gene promoter during the course of RA treatment and delineates the molecular events coinciding with the assembly of nucleosomes on this promoter. Although based on the DNA sequence, KOR promoter P1 resembles a typical “housekeeping gene” promoter; its regulation by RA in the P19 differentiation model was intriguing because no RARE was found in the regulatory region of this gene. This study presents evidence for RA suppression of KOR gene transcription by triggering nucleosome condensation on the promoter, which coincided with the exchange of transcription factor binding and the recruitment of chromatin remodeling complexes onto this promoter.
MNase digestion-coupled LM-PCR analysis defined the 3′ border of N1 to position -44 relative to the transcription initiation site (Fig. 3). According to PstI accessibility, the 5′ border of N2 should start immediately upstream of the transcription initiation site. Therefore, assembly of N2 would completely hinder transcription initiation from this promoter. We applied this technique because it could locate the exact borders of nucleosomes and simultaneously reveal whether nucleosome sliding occurred along a particular genomic DNA (Lomvardas and Thanos, 2001). If the nucleosomes slid along the DNA helix to a new position, PCR would produce different sizes of fragments. However, in the case of KOR P1, LM-PCR results revealed that the positions of the nucleosome remained unchanged in the time course of RA treatment (data not shown). This result suggested an alternative model: nucleosome disassembly and assembly (Boeger et al., 2003, 2004; Reinke and Horz, 2003). This model proposed that new nucleosomes assembled on the otherwise nucleosome-free region, rendering the formation of a repressive chromatin structure. This indeed was the case for KOR P1 where RA triggered the appearance, rather than changes in the position, of the nucleosomal structure on KOR P1. DNase I digestion revealed that the region of N1 and N2 was hypersensitive to DNase I in control cells, suggesting a nucleosome-free or loose chromatin structure of this region in stem cells. Reduced DNase I hypersensitivity in this region after RA treatment indicated chromatin assembly on KOR P1 triggered by RA. This was consistent with the results of restriction enzyme accessibility assays (Fig. 3) and the assessment of purified mononucleosomes and dinucleosomes (Fig. 4). These experiments showed that the nucleosome N1 region (ApoI and ApaI) and nucleosome N2 region (PstI and StyI) were open in stem cells but later became an inaccessible, compact structure that was in agreement with the KOR mRNA expression levels assessed on the Northern blot. This was consistent with our previous observations (Bi et al., 2001; Li et al., 2002). The elevation of mRNA at day 2 was attributable to KOR transcript accumulation as a result of a transient surge of activated Sp1 caused by a nongenomic, early effect of RA as reported in our previous study (Li et al. 2002).
The time course study by restriction enzyme accessibility and mononucleosome-coupled PCR revealed that N1 assembly proceeded N2 condensation, suggesting a sequence of RA-triggered events starting from N1 compaction and leading to organization of nucleosome N2. This prevented Sp1 binding to this promoter, thereby silencing the transcription from this promoter in RA-treated P19 cells. In contrast to RA-triggered nucleosome formation on KOR P1, P2 of this gene was constantly assembled into a nucleosomal array in P19 cells, consistent with the fact that P2 was always silenced in these cells (Bi et al., 2001).
We then examined factors involved in the initial reorganization of N1 and the subsequent N2 assembly, because this region completely overlapped with the E box, the GC boxes, and the transcription initiation site of KOR P1. This would explain the constitutively active feature of this promoter in P19 stem cells. The E box, a binding site for c-Myc/Max, is located inside N1 (Park et al., 2002). Transcriptional regulation by the member of the c-Myc/Max/Mad network has been reviewed extensively (Pelengaris et al., 2002; Galderisi et al., 2003; Patel et al., 2004). The central component, Max, was very stable, and little regulation of its expression was reported (Sommer et al., 1998; Queva et al., 1998). Consistently, Max was constitutively and highly expressed in P19 cells during RA treatment (Fig. 5). In addition to the observation of c-Myc/Max, a heterodimer of Max and Mad1 binds to the E-box to suppress transcription (Eisenman, 2001; Luscher, 2001; Pelengaris et al., 2002). ChIP experiments revealed that RA induced the substitution of the activating c-Myc/Max heterodimer with the repressive Max/Mad1 dimer. Recruitment of these proteins to P1 agreed with the reciprocal expression of c-Myc and Mad1 in P19 cells treated with RA (Fig. 5). Similar observations on the expression levels of these proteins were also made by other groups in other cell lines treated with RA (Queva et al., 1998; Ugai et al., 2001; Hultquist et al., 2004). On the other hand, although RA did not affect the expression level of Sp1 or Sp3 in P19 cells, recruitment of Sp1 to P1 was dramatically reduced by RA treatment. We proposed a model in which the binding of c-Myc/Max and Sp1 could contribute to the initial constitutive expression of this gene, whereas dissociation of c-Myc from, and recruitment of Mad1 to, the promoter would lead to N1 compaction. Chromatin remodeling complexes were then recruited to assemble N2, which led to the exclusion of Sp1 from GC boxes on this promoter (supplemental Fig. 1, available at www.jneurosci.org as supplemental material). In addition, comparing the kinetics of c-Myc and Sp1 binding on P1, dissociation of c-Myc from the DNA preceded Sp1. This result further supported the notion of a sequential alteration of chromatin structure, initiating from the compaction of N1 and followed by assembly of N2. Our results proposed that the assembly of these nucleosomes on this promoter triggered the replacement of the transcription activator c-Myc/Max with the transcription repressor Max/Mad1 on the E box located within N1, resulting in reduced Sp1 binding to GC boxes located in N2.
As demonstrated widely, numerous transcription factors, such as nuclear receptors, nuclear factor κB (NF-κB), CAAT/enhancer binding protein, MyoD, heat shock factor 1, and c-Myc, are known to recruit SWI/SNF to target promoters and, in some cases, to activate gene expression (Peterson and Workman, 2000; Hassan et al., 2001; Narlikar et al., 2002; Edelstein et al., 2003). Interestingly, BAF155, which constitutively occupied the KOR P1, recruited BRG-1 but not BRM. Presumably, these chromatin remodelers were targeted to this promoter to alter nucleosomal structure. Although most chromatin remodeling activated transcription, Isw2p was recruited to promoters of mitotic genes by the transcriptional repressor UME6 and led to the formation of a repressive chromatin structure (Goldmark et al., 2000; Fazzio and Tsukiyama, 2003). Ets-2 and human papillomavirus E7 were also reported to form a repressor complex with components of SWI/SNF such as BRG-1 to silence gene transcription (Lee et al., 2002; Baker et al., 2003). As such, BRG-1 was proposed to form a repressive complex with Mad-1 (instead of c-Myc) or other factors, such as HDACs and corepressors, to assemble an inaccessible chromatin structure. BRG-1-triggered repression of c-fos promoter was found to synergize with recruitment of HDAC components such as SMRT and HDAC1 (Lee et al., 2002). It has also been proposed that the Max/Mad1 complex could remodel chromatin of their target genes by recruiting chromatin remodeling proteins (Luscher, 2001). In the case of KOR P1, because c-Myc left the nucleosome N1, Max/Mad1 was recruited to the same N1 site, inducing events typical of gene repression such as histone hypoacetylation (by HDAC1 recruitment), methylation at Lys9, and heterochromatin formation on this region (Jenuwein and Allis, 2001; Iizuka and Smith, 2003). In addition, BRG-1 was simultaneously recruited. It is likely that by using the energy generated from BRG-1, nucleosome N2 was assembled on P1, forming a chromatin structure inaccessible to Sp1 and general transcription factors, thereby shutting down gene transcription from this promoter. It will be interesting to test how the Max/Mad1 complex recruits BRG-1 and trigger chromatin assembly.
Footnotes
This work was supported by National Institutes of Health Grants DA11190, DA11806, DK54733, DK60521, and K02-DA13926 to L.-N.W. and DA00564, DA01583, DA11806, and K05-DA70554 to H.H.L.
Correspondence should be addressed to Dr. Li-Na Wei, Department of Pharmacology, University of Minnesota Medical School, 6-120 Jackson Hall, 321 Church Street Southeast, Minneapolis, MN 55455. E-mail: weixx009@umn.edu.
Copyright © 2005 Society for Neuroscience 0270-6474/05/253350-08$15.00/0
S.W.P. and M.D.M.H. contributed equally to this work.
References
- Baker KM, Wei GA, Schaffner E, Ostrowski MC (2003) Ets-2 and components of mammalian SWI/SNF form a repressor complex that negatively regulates the BRCA1 promoter. J Biol Chem 278: 17876-17884. [DOI] [PubMed] [Google Scholar]
- Bi J, Hu X, Loh HH, Wei LN (2001) Regulation of mouse κ opioid receptor gene expression by retinoids. J Neurosci 21: 1590-1599. [DOI] [PMC free article] [PubMed] [Google Scholar]
- Boeger H, Griesenbeck J, Strattan JS, Kornberg RD (2003) Nucleosomes unfold completely at a transcriptionally active promoter. Mol Cell 11: 1587-1598. [DOI] [PubMed] [Google Scholar]
- Boeger H, Griesenbeck J, Strattan JS, Kornberg RD (2004) Removal of promoter nucleosomes by disassembly rather than sliding in vivo Mol Cell 14: 667-673. [DOI] [PubMed] [Google Scholar]
- Carey M, Smale ST (2000) Procedure for in vivo-footprinting. In: Transcriptional regulation in eukaryotes (Cuddihy J, ed), pp 355-358. Cold Spring Harbor, NY: Cold Spring Harbor Laboratory.
- Chen HC, Wei LN, Loh HH (1999) Expression of μ-, κ- and δ-opioid receptors in P19 mouse embryonal carcinoma cells. Neuroscience 92: 1143-1155. [DOI] [PubMed] [Google Scholar]
- Edelstein LC, Lagos L, Simmons M, Tirumalai H, Gelinas C (2003) NF-κB-dependent assembly of an enhanceosome-like complex on the promoter region of apoptosis inhibitor Bfl-1/A1. Mol Cell Biol 23: 2749-2761. [DOI] [PMC free article] [PubMed] [Google Scholar]
- Eisenman RN (2001) Deconstructing Myc. Genes Dev 15: 2023-2030. [DOI] [PubMed] [Google Scholar]
- Fazzio TG, Tsukiyama T (2003) Chromatin remodeling in vivo: evidence for a nucleosome sliding mechanism. Mol Cell 12: 1333-1340. [DOI] [PubMed] [Google Scholar]
- Galderisi U, Jori FP, Giordano A (2003) Cell cycle regulation and neural differentiation. Oncogene 22: 5208-5219. [DOI] [PubMed] [Google Scholar]
- Goldmark JP, Fazzio TG, Estep PW, Church GM, Tsukiyama T (2000) The Isw2 chromatin remodeling complex represses early meiotic genes upon recruitment by Ume6p. Cell 103: 423-433. [DOI] [PubMed] [Google Scholar]
- Gui CY, Dean A (2001) Acetylation of a specific promoter nucleosome accompanies activation of the ϵ-globin gene by β-globin locus control region HS2. Mol Cell Biol 21: 1155-1163. [DOI] [PMC free article] [PubMed] [Google Scholar]
- Hassan AH, Neely KE, Workman JL (2001) Histone acetyltransferase complexes stabilize swi/snf binding to promoter nucleosomes. Cell 104: 817-827. [DOI] [PubMed] [Google Scholar]
- Hu X, Bi J, Loh HH, Wei LN (2001) An intronic Ikaros-binding element mediates retinoic acid suppression of the kappa opioid receptor gene, accompanied by histone deacetylation on the promoters. J Biol Chem 276: 4597-4603. [DOI] [PubMed] [Google Scholar]
- Hultquist A, Cetinkaya C, Wu S, Castell A, Erlandsson A, Larsson LG (2004) Mad1 inhibits cell growth and proliferation but does not promote differentiation or overall survival in human u-937 monoblasts. Mol Cancer Res 2: 464-476. [PubMed] [Google Scholar]
- Iizuka M, Smith MM (2003) Functional consequences of histone modifications. Curr Opin Genet Dev 13: 154-160. [DOI] [PubMed] [Google Scholar]
- Jenuwein T, Allis CD (2001) Translating the histone code. Science 293: 1074-1080. [DOI] [PubMed] [Google Scholar]
- Lee D, Lim C, Seo T, Kwon H, Min H, Choe J (2002) The viral oncogene human papillomavirus E7 deregulates transcriptional silencing by Brmrelated gene 1 via molecular interactions. J Biol Chem 277: 48842-48848. [DOI] [PubMed] [Google Scholar]
- Li J, Park SW, Loh HH, Wei LN (2002) Induction of the mouse κ-opioid receptor gene by retinoic acid in P19 cells. J Biol Chem 277: 39967-39972. [DOI] [PubMed] [Google Scholar]
- Lomvardas S, Thanos D (2001) Nucleosome sliding via TBP DNA binding in vivo Cell 106: 685-696. [DOI] [PubMed] [Google Scholar]
- Luscher B (2001) Function and regulation of the transcription factors of the Myc/Max/Mad network. Gene 277: 1-14. [DOI] [PubMed] [Google Scholar]
- Narlikar GJ, Fan HY, Kingston RE (2002) Cooperation between complexes that regulate chromatin structure and transcription. Cell 108: 475-487. [DOI] [PubMed] [Google Scholar]
- Park SW, Wei LN (2003) Regulation of c-myc gene by nitric oxide via inactivating NF-κB complex in P19 mouse embryonal carcinoma cells. J Biol Chem 278: 29776-29782. [DOI] [PubMed] [Google Scholar]
- Park SW, Li J, Loh HH, Wei LN (2002) A novel signaling pathway of nitric oxide on transcriptional regulation of mouse κ opioid receptor gene. J Neurosci 22: 7941-7947. [DOI] [PMC free article] [PubMed] [Google Scholar]
- Patel JH, Loboda AP, Showe MK, Showe LC, McMahon SB (2004) Analysis of genomic targets reveals complex functions of MYC. Nat Rev Cancer 4: 562-568. [DOI] [PubMed] [Google Scholar]
- Pelengaris S, Khan M, Evan G (2002) c-MYC: more than just a matter of life and death. Nat Rev Cancer 2: 764-776. [DOI] [PubMed] [Google Scholar]
- Peterson CL, Workman JL (2000) Promoter targeting and chromatin remodeling by the SWI/SNF complex. Curr Opin Genet Dev 10: 187-192. [DOI] [PubMed] [Google Scholar]
- Queva C, Hurlin PJ, Foley KP, Eisenman RN (1998) Sequential expression of the MAD family of transcriptional repressors during differentiation and development. Oncogene 16: 967-977. [DOI] [PubMed] [Google Scholar]
- Reinke H, Horz W (2003) Histones are first hyperacetylated and then lose contact with the activated PHO5 promoter. Mol Cell 11: 1599-1607. [DOI] [PubMed] [Google Scholar]
- Sommer A, Bousset K, Kremmer E, Austen M, Luscher B (1998) Identification and characterization of specific DNA-binding complexes containing members of the Myc/Max/Mad network of transcriptional regulators. J Biol Chem 273: 6632-6642. [DOI] [PubMed] [Google Scholar]
- Ugai H, Li HO, Komatsu M, Tsutsui H, Song J, Shiga T, Fearon E, Murata T, Yokoyama KK (2001) Interaction of Myc-associated zinc finger protein with DCC, the product of a tumor-suppressor gene, during the neural differentiation of P19 EC cells. Biochem Biophys Res Commun 286: 1087-1097. [DOI] [PubMed] [Google Scholar]