

Abstract
Repeated stimulus presentation (priming) is generally associated with a reduction in neuronal firing, macroscopically mirrored by a decrease in oscillatory electrophysiological markers as well as reduced hemodynamic responses. However, these repetition effects seem to be dependent on stimulus familiarity. We investigate the spatiotemporal correlates of repetition priming in cortical word-recognition networks and their modulation by stimulus familiarity (i.e., words vs pseudowords). Event-related functional magnetic resonance imaging results show reduced activation for repeated words in occipitotemporal cortical regions. Electroencephalogram recordings reveal a significant reduction of induced gamma-band responses (GBRs) between 200 and 350 ms after stimulus onset, accompanied by a decrease in phase synchrony between electrode positions. Pseudoword repetition, in contrast, leads to an activation increase in the same areas, to increased GBRs, and to an increased phase coupling. This spatiotemporal repetition by stimulus type interaction suggests that qualitatively distinct mechanisms are recruited during repetition priming of familiar and unfamiliar stimuli. Repetition of familiar stimuli leads to a “sharpening” of extrastriate object representations, whereas the repetition of unfamiliar stimuli results in the “formation” of a novel cortical network by means of synchronized oscillatory activity. In addition to isolating these mechanisms, the present study provides the first evidence for a possible link between induced electrophysiological and hemodynamic measures of brain activity.
Keywords: repetition priming, repetition suppression, repetition enhancement, words, fMRI, EEG, gamma-band responses
Introduction
Repeated processing of identical stimuli (behaviorally mirrored in repetition priming effects) is associated with a decrease in the strength of stimulus-related neuronal responses, a phenomenon known as repetition suppression (Schacter and Buckner, 1998). Wiggs and Martin (1998), elaborating on the ideas of Desimone (1996), suggested that repetition suppression is a by-product of a “sharpening” process of cortical object representations. In this view, neurons that code features not essential for processing a repeated stimulus drop out of the cell assembly coding this object, thus yielding a more efficient neuronal stimulus representation.
Recent functional neuroimaging research in humans has demonstrated that repetition suppression occurs in response to familiar, but not unfamiliar, stimuli. Repetition of unfamiliar faces and symbols causes an activation increase in brain areas such as the right fusiform gyrus (R. Henson et al., 2000; Thiel et al., 2002). Because this stimulus familiarity-by-repetition interaction is difficult to reconcile with classical theories of repetition priming, R. Henson et al. (2000) suggested that repetition-related increases might reflect the formation of new memory traces for previously unfamiliar items.
At present, the assumption that repeated processing of unfamiliar stimuli results in the formation of new networks is at the status of a hypothesis, albeit a highly likely one. In the present study, we combine event-related functional magnetic resonance imaging (fMRI) with electrophysiological measures to explore in more detail the effects of repetition priming on cortical networks representing a stimulus. In general, such cortical representations are considered to be activated by synchronized neuronal activity within cell assemblies distributed across various cortical areas that process different stimulus features (von der Malsburg and Schneider, 1986; Singer and Gray, 1995). In the human electroencephalogram (EEG), induced gamma-band responses (GBRs) are discussed as signatures of such cell assemblies (Tallon-Baudry and Bertrand, 1999; Keil et al., 2001a).
Recently, it was demonstrated that the repetition of familiar and unfamiliar pictures of objects leads to an analogous pattern of results, as postulated in the above-specified sharpening and formation hypotheses derived from fMRI research. Repeated presentation of the same familiar object resulted in a decrease in GBRs (Gruber et al., 2002, 2004). In contrast, the re-presentation of primed unfamiliar objects was associated with an augmentation of gamma power (Gruber and Müller, 2005).
To facilitate the link between electrophysiological markers of cortical object representations and hemodynamic measures of brain activity, we report an fMRI and an EEG experiment of repetition priming of familiar orthographic stimuli (words) and unfamiliar orthographic stimuli (pseudowords). Stimuli were repeated after 5-10 trials (20-40 s). We expected to replicate the familiarity-by-repetition interaction reported previously in fMRI studies and predicted seeing an analogous pattern in induced GBRs if repetition-related blood oxygenation level-dependent (BOLD) increases are indeed associated with the formation of new memory traces. Because the analysis of spectral power alone might be insufficient to determine the role of synchronized activity within widespread neuronal networks (Miltner et al., 1999; Rodriguez et al., 1999), we also investigate phase locking among electrode sites in time windows showing effects in the frequency domain.
Materials and Methods
Stimuli and behavioral procedure: fMRI study. Participants read 136 words and 136 pseudowords, which were projected centrally onto a translucent screen that participants viewed via a mirror. Fifty-eight stimuli of each type were repeated after 5-10 trials (i.e., 20-40 s; average, 30 s). Words were nouns describing nonliving objects and entities, half abstract and half concrete. Word length was four to seven letters (mean, 5.46) and one or two syllables (mean, 1.74). Average frequency of occurrence was 87.9 in 1,000,000 [database of CELEX (the Dutch Center for Lexical Information); http://www.kun.nl/celex/]. Pronounceable and orthographically regular pseudowords were constructed by replacing one, two, or three letters in each word (but not the first or last letter). For example, “Brille” (glasses) became “Brasle,” and “Zeit” (time) became “Zaut.” As a result of this procedure, words and pseudowords were matched for length in a pairwise manner. Stimuli were presented according to the German orthography for nouns (i.e., with an uppercase initial letter). Trials started with a fixation cross (400 ms), followed by the stimulus presentation for 400 ms. For each trial, four images were acquired with a repetition time of 1 s. Trial onsets were shifted relative to the acquisition of the first image of each 4 s trial by 0, 250, 500, or 750 ms, to virtually increase the sampling rate of the BOLD response (Josephs et al., 1997). Because of this onset jitter, the intertrial interval varied between 2850 and 4750 ms.
The lexical decision task required participants to indicate with the right hand using a response box whether the perceived letter string was a German word. Lexical decision times were registered from stimulus onset and later aggregated by subject and condition and analyzed in a two-factorial repeated-measures ANOVA with the factors stimulus type (words vs pseudowords) and repetition (first vs second presentation). Visual feedback was only given for incorrect answers and time-outs. These trials, as well as outliers deviating by >2.5 SD from the individual's mean for the respective experimental condition, were excluded from the analysis. Stimuli from the different experimental conditions were pseudorandomly ordered, with the constraint that transition frequencies between the different stimulus types were equated. Interspersed among the stimulus sequence were 58 null trials, which allowed the BOLD response of the previous trial to return to baseline and made stimulus appearance less predictable (Friston et al., 1999).
fMRI data acquisition and data analysis. Functional MR images of 14 right-handed native speakers of German (22-30 years of age; mean, 24.6; 6 females) were acquired from 12 axial slices (thickness, 5 mm; slice skip, 2 mm) using a BOLD-sensitive gradient-echo echo-planar imaging sequence at 3 tesla. T1-weighted anatomical images were taken for coregistration with high-resolution three-dimensional (3D) anatomical brain scans. Data analyses were conducted using the LIPSIA software package (Lohmann et al., 2001). Preprocessing of the functional data involved slice time correction, motion correction, baseline correction, and spatial smoothing (full-width at half-maximum, 5.6 mm). Functional images were coregistered with high-resolution whole-brain 3D MR scans (thereby interpolating to voxel size 3 × 3 × 3 mm) and normalized to Talairach and Tournoux (1998) space. Condition-specific effects were analyzed at each voxel with the general linear model, treating subjects as random effects. Direct contrasts between event types were calculated on the parameter estimates for each subject and then subjected to a one-sample t test. Significant activation clusters were identified by applying an uncorrected voxel threshold of p < 0.0005 and a cluster size criterion of p < 0.05 (corrected for multiple comparisons) (Worsley et al., 1996; Kiebel et al., 1999). Trial-averaged hemodynamic responses were derived by reading out raw time series (22 s length) from the preprocessed functional data sets for the peak voxel of an activation and the 26 adjacent voxels, aggregating by subject and condition, and, finally, averaging across subjects. These timelines were corrected by subtracting out the hemodynamic response evoked by the null trials (Brass and von Cramon, 2002).
Stimuli and behavioral procedure: EEG study. Stimulus material, intertrial intervals, presentation sequence (stimulus randomization), and behavioral response registration were identical to the fMRI study, but the participants gave their responses with the left and right index finger (response-to-hand mapping was balanced across participants). The internal structure of the trials was slightly changed so that it was parallel to a trial structure used previously in EEG studies of object-repetition priming (Gruber et al., 2004). Preceding every item, a fixation cross appeared on the screen for 600 ms with random jitter (±100 ms). Each item was presented for 700 ms via a computer monitor at a distance of 1.15 m from the subject's eyes.
EEG data acquisition. A continuous EEG (sampling rate, 500 Hz; amplifier sensitivity, 100 μV; hardware bandpass, 0.01-200 Hz) was recorded from 14 independent participants (20-30 years of age; mean, 24.2; 6 females) using 27 AgAgCl electrodes against a nose reference. Electrodes were placed on the scalp according to the extended 10-20 system, while the electrode placed on the sternum served as ground. Eye movements were monitored via vertical and horizontal electrooculogram. Electrode impedances were kept at <5 kΩ. The EEG datasets were subjected to an automatic artifact rejection (rejection criterion, 33.75 μV), followed by an additional manual scanning for artifacts. Trials with ocular or amplifier-saturation artifacts and trials either incorrectly answered or answered out of time were excluded from the data analysis.
Data analysis: induced and evoked spectral changes. Spectral changes in oscillatory activity were analyzed by means of Morlet wavelet analysis, which has been proposed by Bertrand and Pantev (1994) and described in detail previously (Tallon-Baudry et al., 1997; Tallon-Baudry and Bertrand, 1999). In brief, the method provides a time-varying magnitude of the signal in each frequency band, leading to a time-by-frequency (TF) representation of the data. Importantly, TF energy is averaged across single-trial frequency transformations, allowing one to analyze non-phase-locked components.
To identify the latency and frequency range of the induced gamma-power peak, mean baseline-corrected spectral power (baseline, 400-100 ms before stimulus onset) across all electrode sites was represented in a TF plot averaged across all experimental conditions in the 20-90 Hz range. For additional statistical analysis, a time window of maximal gamma power (200-350 ms after stimulus onset) and 27 electrode sites corresponding to the extended 10-20 system (A1, A2, FP1, FP2, F7, F3, Fz, F4, F8, FT7, FC3, FC4, FT8, T7, C3, Cz, C4, T8, CP5, CP6, P7, P3, Pz, P4, P8, O1, and O2) were analyzed by means of a repeated-measures ANOVA with the factors stimulus type (words vs pseudowords) by repetition (first vs second presentation) by recording site.
As a result of interindividual differences in the gamma-peak frequency, for each subject, a wavelet designed for the frequency of his/her maximal power in the gamma range, averaged across electrode sites and conditions, was chosen (mean gamma-peak frequency, 40.43 Hz; SE, 2.54 Hz). To depict the topographical distributions of induced GBRs, spherical splines (Perrin et al., 1988) were used. Furthermore, an average across all electrode sites was tested against baseline by means of one-group t tests for each experimental condition. To exclude the possibility that effects in the gamma band are merely harmonics of alpha activity (Jürgens et al., 1995), the above ANOVA model was applied to the induced alpha range (9-12 Hz) in the same time window as identified for the gamma peak.
To verify that our findings were based on induced and not evoked gamma activity, the above ANOVA model was applied to the spectra of the averaged and unfiltered evoked response as well. Because visual inspection of TF plots for the evoked gamma response revealed no clear peak in the frequency domain, the identical frequencies and time windows as identified for the induced response were used for statistical analysis. Based on previous studies, which reported an evoked gamma peak at ∼40 Hz in a time window from 70 to 180 ms, this TF window was analyzed as well (Herrmann et al., 1999).
Data analysis: phase locking. Phase locking between recording sites was analyzed, elaborating on a procedure suggested by Lachaux et al. (1999) that provides a method of measuring synchronous oscillatory activity between recording sites independent of the amplitude of the signal. To find significant phase-locking values between two electrodes, a statistical randomization technique was used (Rodriguez et al., 1999) [for a detailed description of this approach, see Tallon-Baudry et al. (2001)]. For statistical analysis, the same time window as that used for the GBR power peak was chosen. Furthermore, nonoverlapping time windows before (0-150 ms) and after (400-550 ms) the gamma peak were analyzed to document the time course of phase-locking values.
Data analysis: event-related potential. A 25 Hz low-pass filter was applied to the data before all event-related potential (ERP) analyses. ERPs were calculated by condition-specific averaging of EEG epochs ranging from 400 ms before to 1000 ms after stimulus onset. Based on previous findings regarding repetition priming (Rugg et al., 1995; Gruber and Müller, 2005) and visual inspection of the grand mean evoked potential (see Fig. 6), two early ERP components (P1, 95-125 ms; N1, 145-175 ms) and two late components (L1, 250-380 ms; L2, 450-650 ms) were defined. Mean amplitudes, averaged across the respective time windows at the electrode sites described above, were analyzed using stimulus type (words vs pseudowords) by repetition (first vs second presentation) by recording site as factors in repeated-measures ANOVAs.
Figure 6.

A, Grand mean ERP, averaged across posterior 10-20 electrode sites (T8, CP5, CP6, P7, P3, PZ, P4, P8, O1, and O2). B, Induced and evoked spectral power changes in the gamma band, averaged across all electrode sites. C, Averaged phase-locking (PL) values across all electrode pairs. First word presentations are indicated by bold gray lines, second word presentations are indicated by thin gray lines, first pseudoword presentations are indicated by bold black lines, and second pseudoword presentations are indicated by thin black lines. Dashed lines indicate averaged evoked activity in the spectral power panel and the distribution of randomized data in the PL panel.
Tests for topographical differences between conditions for all relevant electrophysiological parameters were performed by means of nonparametric combinations of permutations tests (D-statistic), which were described in detail previously (Galán et al., 1997; Müller and Keil, 2004). Where appropriate, p values were adjusted by Huynh-Feldt correction in all ANOVA models. Post hoc comparisons were calculated by means of paired t tests corrected for multiple comparisons using Bonferroni's method. Means ± SE are presented. To compare the time course of the ERP, induced and evoked spectral changes, and values of phase synchrony, the different measures were juxtaposed in Figure 6.
Results
fMRI study
Lexical decision times registered during the fMRI session revealed robust main effects of stimulus type [words, 674.2 ms (SE, 18.1); pseudowords, 715.8 ms (SE, 17.9); difference (diff), 81.6 ms; F(1,13) = 110.82; p < 0.0001] and repetition [first presentation, 749.6 (SE, 18.1); second presentation, 680.4 (SE, 18.9); diff, 69.2 ms; F(1,13) = 651.48; p < 0.0001]. A reliable interaction between stimulus type and repetition (F(1,13) = 5.8; p < 0.05) resulted because priming was greater for words (77.9 ms; F(1,13) = 262.52; p < 0.0001) than for pseudowords (60.4 ms; F(1,13) = 200.61; p < 0.0001) (compare Table 1).
Table 1.
Mean and SE (in parentheses) of response times and the percentage of correct responses for first and second presentations of words and pseuodwords in both experiments
|
|
fMRI study |
EEG study |
||||
|---|---|---|---|---|---|---|
|
|
Words |
Pseudowords |
Words |
Pseudowords |
||
| Response times (ms) | ||||||
| First presentation | 713.2 (22.4) | 786 (25.5) | 653.9 (42.6) | 685.6 (42.7) | ||
| Second presentation | 635.3 (25) | 725.6 (23.2) | 586.7 (41.3) | 664.2 (39.4) | ||
| Percentage of correct responses | ||||||
| First presentation | 94.1% (0.01) | 98% (0.004) | 90.8% (0.016) | 97.3% (0.006) | ||
| Second presentation |
99.4% (0.004) |
98.8% (0.006) |
99.3% (0.003) |
97.9% (0.007) |
||
Analysis of response accuracy showed generally fewer correct responses for words than for pseudowords [words, 96.7% (SE, 0.007); pseudowords, 98.4% (SE, 0.004); diff, 1.7%; F(1,13) = 10.43; p < 0.01] and more correct responses for repeated stimuli [first, 96.1% (SE, 0.006); second, 99.1% (SE, 0.004); diff, 3%; F(1,13) = 32.08; p < 0.0001]. A reliable stimulus type by repetition interaction (F(1,13) = 9.13; p < 0.01) shows an increase in the number of correct responses for words (5.3%; F(1,13) = 26.44; p < 0.00025) but no differences for pseudowords (F < 1) (compare Table 1).
The brain activation data were analyzed in a two-factorial design with the factors stimulus type (words vs pseudowords) and repetition (first vs second presentation). The analysis of the main effect of stimulus type revealed increased activation for pseudowords relative to words in the left basal occipitotemporal cortex (occipitotemporal sulcus), the left intraparietal sulcus, and the left inferior precentral gyrus and sulcus (Fig. 1; Table S1, available at www.jneurosci.org as supplemental material). No brain area showed greater activity for words than for pseudowords. This result, however, is qualified by an interaction of stimulus type and repetition, as described below.
Figure 1.
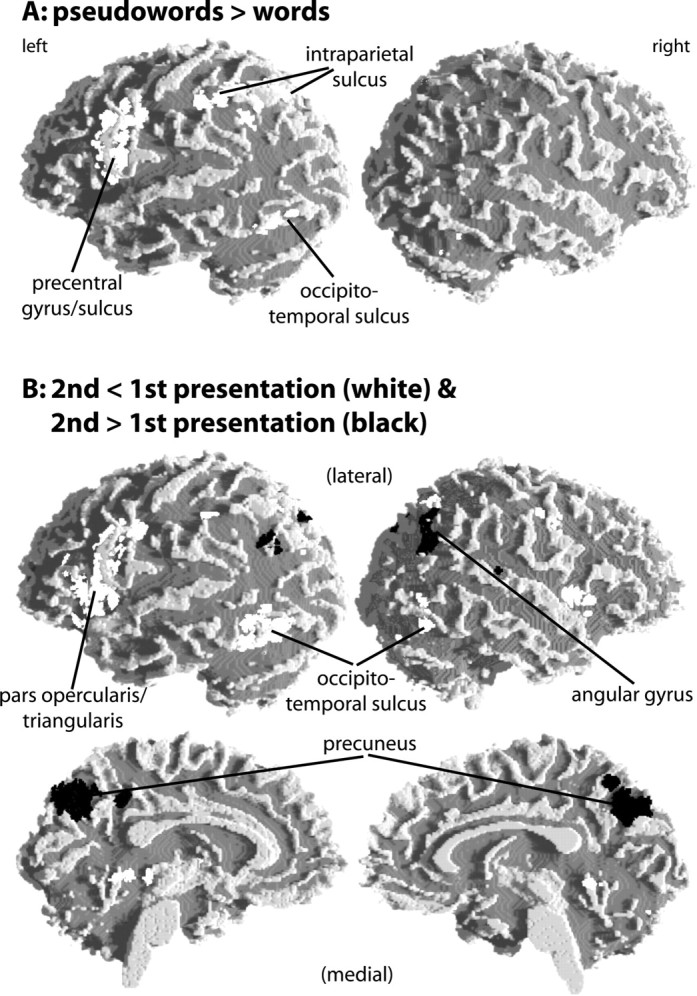
A, B, Brain regions displaying a main effect of stimulus type (A) and repetition (B). fMRI activations (i.e., random-effects group analyses) were rendered onto the surface of a white matter segmentation of a template brain. Statistical maps were thresholded at p < 0.0005. Peak coordinates and z values are given in Tables S1 and S2 (available at www.jneurosci.org as supplemental material). A color version of Figure 1 is also available at www.jneurosci.org as supplemental material.
A main effect of repetition was observed in several brain regions (Fig. 1; Table S2, available at www.jneurosci.org as supplemental material). Repetition-related activation decrease (repetition suppression) was seen in the left intraparietal sulcus, bilaterally in the basal occipitotemporal cortex (transverse collateral sulcus), and broadly in the left fronto-opercular region, encompassing the posterior inferior frontal gyrus, the ventral precentral gyrus and sulcus, and the anterior insula. In the right hemisphere, less extended activation was seen in the anterior insula and ventral precentral gyrus. A repetition-related activation increase was observed in the precunei bilaterally, as well as in the right angular gyrus.
The unexpected observation that no brain area responded more strongly to words than to pseudowords [i.e., in contrast to previous results by Fiebach et al. (2002), Bellgowan et al. (2003), and Kuo et al. (2003)] was qualified by a robust interaction of stimulus type and repetition in several occipital and temporal brain areas (Fig. 2). These include the left cuneus, the right lingual gyrus, the lateral surface of the middle occipital gyri bilaterally, the left midfusiform gyrus, and the right collateral sulcus between fusiform and parahippocampal gyri (Fig. 2; Table S3, available at www.jneurosci.org as supplemental material). As Figure 3 shows, there were word-pseudoword differences in hemodynamic responses in the left basal temporal cortex [collateral sulcus/fusiform gyrus; Talairach coordinates of peak voxel, -25, -74, 5 (x, y, z); Tmax = 5.56; corrected cluster-size p value (pc) = 0.014] and in the left posterior middle/inferior temporal lobe [(-55, -53, 0); Tmax = 6.15; pc = 0.011] when the first presentation was analyzed separately. In addition, words also elicited greater activation in the medial occipital cortex (data not shown in Fig. 3) and in the right basal ganglia [putamen and globus pallidus (25, -11, -3); Tmax = 5.15; pc = 0.048]. None of the areas exhibiting an interaction effect showed greater activity for pseudowords compared with words. At the second stimulus presentation, no brain region shows word-specific activation. In contrast, occipitotemporal, left parietal, and frontal areas show the reverse effect of greater activation for pseudowords than for words.
Figure 2.

Brain regions displaying an interaction of stimulus type and repetition. A, fMRI activations (i.e., random-effects group analyses) rendered onto the surface of a white matter-segmented template brain. B, Coronal slice at y = -87, showing activation clusters in the left cuneus, right lingual gyrus, and middle occipital (middle occ.) gyrus. Trial-averaged raw hemodynamic responses averaged across subjects for words (left panels) and pseudowords (right panels) are also shown. C, Coronal section at y = -67 and trial-averaged hemodynamic responses for activation clusters in the left midfusiform gyrus and right collateral sulcus. Solid lines represent first word and pseudoword presentations, and dashed lines represent second stimulus presentation. Statistical maps were thresholded at p < 0.0005. Peak coordinates and z values are given in Table S3 (available at www.jneurosci.org as supplemental material). A color version of Figure 2 is available at www.jneurosci.org as supplemental material.
Figure 3.

Effect of stimulus type (words more than pseudowords) at first presentation. Coronal sections are shown at y = -69 (left) and y = -54 (right). The axial section is shown at z = -5. Statistical maps were thresholded at p < 0.0005. Activated brain regions are indicated by white clusters.
The described stimulus type by repetition interaction suggests that brain activation associated with word and pseudoword processing is differentially affected by stimulus repetition. To describe these mechanisms more precisely, we extracted the raw hemodynamic responses from those brain areas showing a reliable interaction effect and calculated trial-averaged timelines separately for the four experimental conditions for each of these brain areas (Fig. 2). Whereas all areas show repetition suppression for words, two distinct patterns of pseudoword repetition effects emerge. In the middle occipital gyri bilaterally and in the left midfusiform gyrus, hemodynamic responses to pseudowords were not affected by repetition. In the cuneus, right lingual gyrus, and right collateral sulcus, in contrast, a repetition-related activation increase was seen for pseudowords.
EEG study
Lexical decision times registered during the EEG session revealed robust main effects of stimulus type [words, 620.3 ms (SE, 29.8); pseudowords, 674.9 ms (SE, 28.6); diff, 54.6 ms; F(1,13) = 17.49; p = 0.001] and repetition [first presentation, 669.7 ms (SE, 29.8); second presentation, 625.5 (SE, 29.0); diff, 44.2 ms; F(1,13) = 24.89; p < 0.00025]. A reliable stimulus type by repetition interaction (F(1,13) = 25.0; p < 0.00025) shows that priming was greater for words (67.2 ms; F(1,13) = 28.9; p < 0.00025) than for pseudowords (21.4 ms; F(1,13) = 10.6; p < 0.01) (compare Table 1).
Analysis of response accuracy showed fewer correct responses for words than for pseudowords [words, 95% (SE, 0.012); pseudowords, 97.6% (SE, 0.005); diff, 2.6%; F(1,13) = 12.41; p < 0.005] and more correct responses for repeated stimuli [first, 94% (SE, 0.011); second, 98.6% (SE, 0.004); diff, 4.6%; F(1,13) = 30.47; p < 0.0001]. A reliable stimulus type by repetition interaction (F(1,13) = 14.78; p < 0.0025) shows an increase in the number of correct responses for words (8.5%; F(1,13) = 26.17; p < 0.00025) but no differences for pseudowords (F < 1) (compare Table 1).
Induced and evoked spectral changes
Figure 4A depicts the baseline-corrected TF plot for the average across all electrode sites, all experimental conditions, and 14 subjects for the gamma-frequency range. Baseline-corrected spectral power induced by word and pseudoword presentations showed a clear peak in a time window from 200 to 350 ms after stimulus onset in a frequency range between 25 and 80 Hz (Fig. 4A). The analysis of the alpha range revealed no significant effects (Fig. 4C,D), suggesting that the GBR effect is independent of the effects in the alpha range. Furthermore, we found no significant effects in the evoked alpha and evoked gamma range.
Figure 4.

A, Time-by-frequency plot, averaged across all electrode sites and all experimental conditions for the induced gamma range. B, Induced gamma responses based on the individual maximal power in the gamma range in the time window between 200 and 350 ms after stimulus onset, averaged across all electrode sites. Asterisks indicate statistical significance (p < 0.05). C, D, Analogous results for the induced alpha range.
Figure 4B represents induced GBRs during the peak time window for each condition separately, averaged across all electrode sites. Note that wavelets designed for individual peak frequencies in the gamma range were used (see Materials and Methods). Averaged gamma power revealed a significant increase relative to baseline for the two word presentations (first, t(13) = 4.8, p < 0.001; second, t(13) = 2.1, p = 0.05) and for first and second pseudoword presentations (first, t(13) = 2.8, p = 0.01; second, t(13) = 4.4, p < 0.001). A two-factorial repeated-measures ANOVA resulted in a significant stimulus type by repetition interaction (F(1,13) = 32.8; p < 0.0001). Furthermore, we found a significant stimulus type by repetition by recording site interaction (F(26,338) = 1.9; p = 0.05), mainly reflecting a maximum of spectral power at left parieto-occipital electrode sites (Pz, P3, and O1) in the experimental conditions showing a gamma peak. Post hoc t tests of averages across 27 electrode sites revealed a significant power decrease from the first to the second presentation of word stimuli (t(13) = 4.4; p < 0.001) but a significant increase in spectral power from first to second presentation of the pseudowords (t(13) = -2.5; p < 0.05). Importantly, initial word presentations revealed higher gamma activity compared with initial pseudowords (t(13) = 2.4; p < 0.05). No main effects of stimulus type or repetition were seen in the GBRs.
Topographical distributions of induced gamma power for individual peak wavelets in a time window from 200 to 350 ms for first and second word and pseudoword presentations are depicted in Figure 5. Induced GBRs show a widespread scalp distribution with a maximum at electrode sites P3, O1, and Pz. D-statistics revealed no significant topographical differences between conditions.
Figure 5.

Grand mean spherical spline power maps based on the individual maximal power in the gamma range in the time window between 200 and 350 ms after stimulus onset. Lines indicate significant phase-locking values between recording sites (p < 0.01).
Phase locking
Figure 6C depicts phase synchrony averaged across all pairs of recording sites for all experimental conditions, averaged across participants. The time window of maximal increase of phase locking is coincident with the spectral power peak (Fig. 6B). Thus, in Figure 5, the results of phase-synchrony analysis are only depicted during the gamma-peak time window (200-350 ms). Significant phase-locking values were superimposed on the spectral power topographies. A line between two electrode sites is only drawn if the phase-locking value is beyond the distribution of randomized data (p < 0.01). For first word and second pseudoword presentations, the most dense formations of significant phase-locking values were found predominantly among posterior recording sites that showed maximal spectral power, but also between temporal and frontal electrodes. Less phase synchrony was observed for second word and first pseudoword presentations. Thus, not only is the time window of maximal increase of phase locking coincident with the spectral power peak but also the scalp distribution and direction of the observed effects mirror our findings regarding spectral power. For all conditions, the time windows 0-150 and 400-550 ms revealed only a minor number of significant phase-locking values.
Event-related brain potentials
Figure 6A depicts the ERPs at posterior electrode sites for first and second presentations of words and pseudowords, respectively. We found no significant differences for the P1 and N1 components. A late component of the ERP between 250 and 380 ms, henceforth referred to as L1, revealed a significant main effect of repetition, reflecting more positive-going potentials for second as opposed to first stimulus presentations (F(1,13) = 22.9; p < 0.001). A significant stimulus type by recording site interaction (F(26,338) = 2.2; p < 0.05) and a significant repetition by recording site interaction (F(26,338) = 7.0; p < 0.0001) mainly reflect a maximum in amplitudes at electrode sites FP1, T7, and P7 in all conditions
A second late component, L2 (450-650 ms) showed higher positive-going amplitudes for words compared with pseudowords (main effect of stimulus type, F(1,13) = 12.5; p < 0.01). Furthermore, we found that the positive-going main effect of repetition found in the L1 window persisted in this time window (F(1,13) = 40.7; p < 0.0001). A significant stimulus type by recording site interaction (F(26,338) = 4.1; p < 0.01) and a significant repetition by recording site interaction (F(26,338) = 9.7; p < 0.0001) in the L2 window mainly reflect a maximum in amplitudes at electrode sites P3, Pz, and P4 in all conditions. An interaction of stimulus type and repetition was not found in any of the time windows. D-statistics revealed no significant topographical differences between conditions.
Discussion
We explored neurophysiological correlates of word and pseudoword repetition using EEG and fMRI. Repetition resulted in faster lexical decisions with greater facilitation for words than for pseudowords. The neurophysiological data show a more complex pattern of repetition effects. First, repetition suppression independent of stimulus type was seen in occipitotemporal visual word-recognition areas (Fiebach et al., 2002) and left inferoposterior frontal regions crucial for phonological processing (Bookheimer, 2002), replicating previous priming studies with written words (Wagner et al., 2000; Dehaene et al., 2001). In the EEG, repetition effects independent of stimulus type are seen only in ERPs.
Second, occipitotemporal brain regions showed a repetition by stimulus type interaction. Third, this interaction is also apparent in induced GBRs and phase locking among scalp electrodes but not in the ERPs. We consider the finding of analogous repetition by stimulus type interactions in fMRI and in some of the electrophysiological measures to be the most important finding of this study, and focus the discussion on this result.
Repetition by stimulus type interaction
Our exploration of repetition by stimulus type interactions was guided by three hypotheses: (1) brain activation in occipitotemporal cortices and induced GBRs reflect activity within cortical networks related to visual-perceptual object representations (Tallon-Baudry and Bertrand, 1999; Grill-Spector, 2003). (2) Repetition of familiar objects leads to the “sharpening” of such networks (Wiggs and Martin, 1998), causing suppression of neuronal activity. At this visual-perceptual level of processing, letter strings are treated in much the same way as pictorial objects (Fiebach et al., 2002). Thus, repetition suppression was expected for words. (3) Repetition of unfamiliar pseudowords leads to encoding-related processes and thus to neuronal priming effects distinct from those seen for familiar stimuli (R. Henson et al., 2000).
In support of the first hypothesis, words induced greater activations than pseudowords in occipitotemporal cortices after the first presentation (Fiebach et al., 2002). Furthermore, a greater increase in synchronous GBRs was seen for initially presented words compared with pseudowords, supporting the hypothesized analogy of word perception to the activation of cortical object representations by gestalt-like stimuli (Keil et al. 1999; Rodriguez et al., 1999; Gruber et al., 2002). The parallel GBR and fMRI word-pseudoword effects suggest the basal and inferolateral occipitotemporal cortex as generators of word-specific synchronous oscillations. Because these areas are involved in object recognition, the fMRI data support theories relating GBRs to cortical object representations. Induced activity reflects the integration of information within cortical networks, thereby indexing transient stimulus-induced integration of distributed occipitotemporal brain regions (Varela et al., 2001).
Consistent with our second and third hypotheses, we observed a repetition by stimulus type interaction in occipitotemporal cortical regions with word-specific repetition suppression, replicating repetition-by-familiarity interactions reported for faces and symbols (R. Henson et al., 2000). As shown previously for familiar picture stimuli (Gruber and Müller, 2002; Gruber et al., 2004), induced gamma power also decreased selectively after word repetition. These GBR and fMRI results strongly support the hypothesized neuronal sharpening mechanism for familiar stimuli. Importantly, fMRI and GBR activity for repeated words was above baseline level, indicating that activity within cortical object networks, although sharpened, is not suppressed completely. These results provide tentative evidence that the fMRI repetition by stimulus type interaction might reflect neural events taking place between ∼200 and 350 ms after stimulus onset.
Henson and Rugg (2003) suggested as an alternative to neuronal sharpening that hemodynamic repetition suppression might result from a reduced duration of neuronal activity rather than from excluding irrelevant parts of repeatedly activated cell assemblies. If this is true, one should expect duration reduction of oscillatory gamma activity for repeated words but not pseudowords. Within the limitations given by the temporal resolution of our wavelet approach (∼30 ms), we do not find such a result.
Pseudoword repetition was accompanied by activation increases in some of the areas showing repetition by stimulus type interactions. Analogous effects were observed in induced GBRs and phase locking among electrode sites. fMRI (R. Henson et al., 2000) and previous gamma-band findings during perceptual memory formation (Miltner et al., 1999; Keil et al., 2001b) suggest that these repetition-related increases might reflect encoding-related processes (i.e., the formation of new cell assemblies representing previously unfamiliar stimuli). This argument gains support from a previous repetition priming study using familiar and unfamiliar pictorial material, which showed a similar pattern of results (Gruber and Müller, 2005). Note, however, that this interpretation of repetition-related activation increase for repeated unfamiliar stimuli is presently at the status of a hypothesis. It receives support from the present data but needs to be investigated further. Increased phase locking between distant electrode sites for repeated pseudowords might reflect a stronger functional integration of the newly formed representation into task-relevant cortical networks.
Although pseudowords are not meaningful, visual-orthographic and phonological processing can occur just as it does for words. The formation of new memory traces based on orthographic information is certainly sufficient to trigger additional recognition processes after second presentation, as assumed for repeated unfamiliar faces and symbols (R. Henson et al., 2000). In contrast, if our results were attributable to perceptual integration alone, word and pseudoword repetition effects should have the same direction. This was not the case in fMRI, GBR, or phase-locking data (but in ERPs).
Not all brain areas showing a repetition by stimulus type interaction show increased activation for repeated pseudowords. Pseudoword repetition enhancement is seen in the medial occipital and right basal temporal cortex, but not in the left fusiform gyrus. This latter area was proposed to extract abstract visual word form information (Dehaene et al., 2001), a process that should operate on words and pseudowords alike. In contrast, the word specificity of the left fusiform repetition effect indicates some dependency on the preexistence of word representations, either form-based representations at the level of a hypothesized orthographic input lexicon or even semantic representations (Koutstaal et al., 2001).
Differential pseudoword repetition effects in left and right basal temporal cortex might reflect general hemispheric specializations. Right extrastriate regions might preferentially process specific form information, whereas the left hemisphere might be specialized for more abstract object representations (Marsolek, 1995). Such abstract form-based processing might be facilitated for repeated words because of residual activation in existing word representations, whereas newly formed representations of pseudowords may not yet have reached a comparable level of abstraction. Indeed, neuropsychological models of word recognition suggest a left hemisphere advantage for directly and quickly accessing the orthographic input lexicon (Ellis et al., 1988; Ellis, 2004).
Dissociations between fMRI, EEG, and behavior
Our data show a dissociation between ERPs and GBRs. Consistent with previous ERP studies (Bentin and Peled, 1990), repeated stimuli evoked a late positivity; however, different stimulus types, repetition lags, or behavioral tasks might cause slight differences in latencies and scalp topographies of ERP repetition effects (Henson et al., 2004). It is plausible to assume that the late positivity is generated in brain areas showing repetition main effects in the fMRI experiment. GBRs showed no such main effect. Our results thus provide additional evidence that ERPs and induced GBRs reflect functionally complementary aspects of neuronal stimulus processing (Tallon-Baudry and Bertrand, 1999).
None of the neurophysiological measures directly mirror the specific pattern of the behavioral repetition by stimulus type interaction (see also R. Henson et al., 2000). This is most likely because increases and decreases in none of these measures directly translate into response time or accuracy changes. However, it is crucial that GBRs and hemodynamic responses, but not ERPs, showed the interaction effect of interest here. Understanding the complex relationship between these neurophysiological indicators and behavior is an important goal for future research.
Repetition-related activation increases
General repetition-related activation increases occurred in the right angular gyrus and the precunei. Precuneus involvement was reported in numerous different contexts, most consistently related to episodic memory (Rugg and Henson, 2002). Precuneus activity was reported for successful memory retrieval (Shallice et al., 1994; Henson et al., 1999; R. N. Henson et al., 2000), and ERP old/new effects are seen at parietal scalp electrodes (Rugg, 1995; Rugg et al., 1998). Herath et al. (2001) related precuneus activity to recognition based on memory representations, whereas recognition based on currently perceived visual patterns activated the right angular gyrus. Because participants noticed the stimulus repetitions, we assume that our priming paradigm involved overt recognition. These repetition-related activation increases might thus reflect conscious recognition memory during repetition priming.
Conclusion
The present study extends previous reports of neuronal repetition priming effects to the domain of cortical language networks. It provides support for the validity of the neuronal sharpening hypothesis in occipitotemporal cortices for familiar visual stimuli. Furthermore, the present data strengthen the hypothesized link between repetition of unfamiliar stimuli and the formation of new memory traces in occipitotemporal cell assemblies. In particular, the latter result is crucially based on combining fMRI and electrophysiological measures. This multimethod approach provides a powerful tool for functionally dissociating multiple activation sites in neuroimaging studies and providing insights into possible time windows for activation effects observed in fMRI. Conversely, fMRI results narrow down the possible cortical sources of GBRs and thereby potentially allow the validation of functional theories of induced oscillatory brain activity. This approach appears promising for future research. However, it depends on the development of more sophisticated methods to analyze the sources of spectral data, possibly based on hemodynamic information.
Footnotes
C.J.F. is supported by a postdoctoral fellowship from the German Academic Exchange Service. We thank Rik Henson, Matt Davis, Shlomo Bentin, and Angela Friederici for invaluable comments on previous versions of this manuscript. The experiments reported in this study were conducted at the Max Planck Institute for Human Cognitive and Brain Sciences.
Correspondence should be addressed to Christian J. Fiebach, University of California, Berkeley, 132 Barker Hall, MC #3190, Berkeley, CA, 94720-3190. E-mail: christian@fiebach.org.
Copyright © 2005 Society for Neuroscience 0270-6474/05/253414-09$15.00/0
References
- Bellgowan PS, Saad ZS, Bandettini PA (2003) Understanding neural system dynamics through task modulation and measurement of functional MRI amplitude, latency, and width. Proc Natl Acad Sci USA 100: 1415-1419. [DOI] [PMC free article] [PubMed] [Google Scholar]
- Bentin S, Peled BS (1990) The contribution of stimulus encoding strategies and decision-related factors to the repetition effect for words: electrophysiological evidence. Mem Cognit 18: 359-366. [DOI] [PubMed] [Google Scholar]
- Bertrand O, Pantev C (1994) Stimulus frequency dependence of the transient oscillatory auditory evoked response (40 Hz) studied by electric and magnetic recordings in human. In: Oscillatory event-related brain dynamics (Pantev C, Elbert T, Lütkenhöner B, eds), pp 231-242. New York: Plenum.
- Bookheimer S (2002) Functional MRI of language: new approaches to understanding the cortical organization of semantic processing. Annu Rev Neurosci 25: 151-188. [DOI] [PubMed] [Google Scholar]
- Brass M, von Cramon DY (2002) The role of the frontal cortex in task preparation. Cereb Cortex 12: 908-914. [DOI] [PubMed] [Google Scholar]
- Dehaene S, Naccache L, Cohen L, Bihan DL, Mangin JF, Poline JB, Riviere D (2001) Cerebral mechanisms of word masking and unconscious repetition priming. Nat Neurosci 4: 752-758. [DOI] [PubMed] [Google Scholar]
- Desimone R (1996) Neural mechanisms for visual memory and their role in attention. Proc Natl Acad Sci USA 93: 13494-13499. [DOI] [PMC free article] [PubMed] [Google Scholar]
- Ellis AW (2004) Length, formats, neighbours, hemispheres, and the processing of words presented laterally or at fixation. Brain Lang 88: 355-366. [DOI] [PubMed] [Google Scholar]
- Ellis AW, Young AW, Anderson C (1988) Models of visual word recognition in the left and right hemispheres. Brain Lang 35: 254-273. [DOI] [PubMed] [Google Scholar]
- Fiebach CJ, Müller K, Friederici AD, von Cramon DY (2002) fMRI evidence for dual routes to the mental lexicon in visual word recognition. J Cogn Neurosci 14: 11-23. [DOI] [PubMed] [Google Scholar]
- Friston KJ, Zarahn E, Josephs O, Henson RN, Dale AM (1999) Stochastic designs in event-related fMRI. NeuroImage 10: 607-619. [DOI] [PubMed] [Google Scholar]
- Galán L, Biscay R, Rodríguez JL, Pérez-Abalo MC, Rodríguez R (1997) Testing topographic differences between event related brain potentials by using non-parametric combinations of permutation tests. Electroencephalogr Clin Neurophysiol 102: 240-247. [DOI] [PubMed] [Google Scholar]
- Grill-Spector K (2003) The neural basis of object perception. Curr Opin Neurobiol 13: 159-166. [DOI] [PubMed] [Google Scholar]
- Gruber T, Müller MM (2002) Effects of picture repetition on induced gamma band responses, evoked potentials, and phase synchrony in the human EEG. Brain Res Cogn Brain Res 13: 377-392. [DOI] [PubMed] [Google Scholar]
- Gruber T, Müller MM (2005) Oscillatory brain activity dissociates between associative stimulus content in a repetition priming task in the human EEG. Cereb Cortex 15: 109-116. [DOI] [PubMed] [Google Scholar]
- Gruber T, Keil A, Müller MM (2002) Modulation of induced gamma band responses in a perceptual learning task in human EEG. J Cogn Neurosci 14: 732-744. [DOI] [PubMed] [Google Scholar]
- Gruber T, Malinowski P, Müller MM (2004) Modulation of oscillatory brain activity and evoked potentials in a repetition priming task in the human EEG. Eur J Neurosci 19: 1073-1082. [DOI] [PubMed] [Google Scholar]
- Henson R, Shallice T, Dolan R (2000) Neuroimaging evidence for dissociable forms of repetition priming. Science 287: 1269-1272. [DOI] [PubMed] [Google Scholar]
- Henson RN, Rugg MD (2003) Neural response suppression, haemodynamic repetition effects, and behavioural priming. Neuropsychologia 41: 263-270. [DOI] [PubMed] [Google Scholar]
- Henson RN, Rugg MD, Shallice T, Josephs O, Dolan RJ (1999) Recollection and familiarity in recognition memory: an event-related fMRI study. J Neurosci 19: 3962-3972. [DOI] [PMC free article] [PubMed] [Google Scholar]
- Henson RN, Rugg MD, Shallice T, Dolan RJ (2000) Confidence in recognition memory for words: dissociating right prefrontal roles in episodic retrieval. J Cogn Neurosci 12: 913-923. [DOI] [PubMed] [Google Scholar]
- Henson RNA, Rylands A, Ross E, Vuilleumeir P, Rugg MD (2004) The effect of repetition lag on electrophysiological and haemodynamic correlates of visual object priming. NeuroImage 21: 1674-1689. [DOI] [PubMed] [Google Scholar]
- Herath P, Kinomura S, Roland PE (2001) Visual recognition: evidence for two distinctive mechanisms from a PET study. Hum Brain Mapp 12: 110-119. [DOI] [PMC free article] [PubMed] [Google Scholar]
- Herrmann S, Mecklinger A, Pfeifer E (1999) Gamma responses and ERPs in a visual classification task. Clin Neurophysiol 110: 636-642. [DOI] [PubMed] [Google Scholar]
- Josephs O, Turner R, Friston KJ (1997) Event-related fMRI. Hum Brain Mapp 5: 243-248. [DOI] [PubMed] [Google Scholar]
- Jürgens E, Rösler F, Hennighaus E, Heil M (1995) Stimulus induced gamma oscillations: harmonics of alpha activity? NeuroReport 6: 813-816. [DOI] [PubMed] [Google Scholar]
- Keil A, Müller MM, Ray WJ, Gruber T, Elbert T (1999) Human gamma band activity and perception of a gestalt. J Neurosci 19: 7152-7161. [DOI] [PMC free article] [PubMed] [Google Scholar]
- Keil A, Gruber T, Müller MM (2001a) Functional correlates of macroscopic high-frequency brain activity in the human visual system. Neurosci Biobehav Rev 25: 527-534. [DOI] [PubMed] [Google Scholar]
- Keil A, Müller MM, Gruber T, Wienbruch C, Elbert T (2001b) Human large-scale oscillatory brain activity during an operant shaping procedure. Brain Res Cogn Brain Res 12: 397-407. [DOI] [PubMed] [Google Scholar]
- Kiebel SJ, Poline JB, Friston KJ, Holmes AP, Worsley KJ (1999) Robust smoothness estimation in statistical parametric maps using standardized residuals from the general linear model. NeuroImage 10: 756-766. [DOI] [PubMed] [Google Scholar]
- Koutstaal W, Wagner AD, Rotte M, Maril A, Buckner RL, Schacter DL (2001) Perceptual specificity in visual object priming: functional magnetic resonance imaging evidence for a laterality difference in fusiform cortex. Neuropsychologia 39: 184-199. [DOI] [PubMed] [Google Scholar]
- Kuo WJ, Yeh TC, Lee CY, Wu YT, Chou CC, Ho LT, Hung DL, Tzeng OJ, Hsieh JC (2003) Frequency effects of Chinese character processing in the brain: an event-related fMRI study. NeuroImage 18: 720-730. [DOI] [PubMed] [Google Scholar]
- Lachaux JP, Rodriguez E, Martinerie J, Varela FJ (1999) Measuring phase synchrony in brain signals. Hum Brain Mapp 8: 194-208. [DOI] [PMC free article] [PubMed] [Google Scholar]
- Lohmann G, Muller K, Bosch V, Mentzel H, Hessler S, Chen L, Zysset S, von Cramon DY (2001) LIPSIA—a new software system for the evaluation of functional magnetic resonance images of the human brain. Comput Med Imaging Graph 25: 449-457. [DOI] [PubMed] [Google Scholar]
- von der Malsburg C, Schneider W (1986) A neural cocktail-party processor. Biol Cybern 54: 29-40. [DOI] [PubMed] [Google Scholar]
- Marsolek CJ (1995) Abstract visual-form representations in the left cerebral hemisphere. J Exp Psychol Hum Percept Perform 21: 375-386. [DOI] [PubMed] [Google Scholar]
- Miltner WHR, Braun C, Arnold M, Witte H, Taub E (1999) Coherence of gamma-band activity as a basis for associative learning. Nature 397: 434-436. [DOI] [PubMed] [Google Scholar]
- Müller MM, Keil A (2004) Neuronal synchronization and selective color processing in the human brain. J Cogn Neurosci 16: 1-20. [DOI] [PubMed] [Google Scholar]
- Perrin F, Pernier J, Bertrand O, Echallier JF (1988) Spherical splines for scalp potential and current source density mapping. Electroencephalogr Clin Neurophysiol 72: 184-187. [DOI] [PubMed] [Google Scholar]
- Rodriguez E, George N, Lachaux JP, Martinerie J, Renault B, Varela FJ (1999) Perception's shadow: long-distance synchronization of human brain activity. Nature 397: 430-433. [DOI] [PubMed] [Google Scholar]
- Rugg MD (1995) Event-related potential studies of human memory. In: The cognitive neurosciences (Gazzaniga MS, ed), pp 789-801. Cambridge, MA: MIT.
- Rugg MD, Henson RNA (2002) Episodic memory retrieval: an (event-related) functional neuroimaging perspective. In: The cognitive neuroscience of memory: encoding and retrieval (Parker A, Wilding E, Bussey T, eds), pp 3-37. Hove, UK: Psychology.
- Rugg MD, Soardi M, Doyle MC (1995) Modulation of event-related potentials by the repetition of drawings of novel objects. Brain Res Cogn Brain Res 3: 17-24. [DOI] [PubMed] [Google Scholar]
- Rugg MD, Mark RE, Walla P, Schloerscheidt AM, Birch CS, Allan K (1998) Dissociation of the neural correlates of implicit and explicit memory. Nature 392: 595-598. [DOI] [PubMed] [Google Scholar]
- Schacter DL, Buckner RL (1998) Priming and the brain. Neuron 20: 185-195. [DOI] [PubMed] [Google Scholar]
- Shallice T, Fletcher P, Frith CD, Grasby P, Frackowiak RS, Dolan RJ (1994) Brain regions associated with acquisition and retrieval of verbal episodic memory. Nature 368: 633-635. [DOI] [PubMed] [Google Scholar]
- Singer W, Gray CM (1995) Visual feature integration and the temporal correlation hypothesis. Annu Rev Neurosci 18: 555-586. [DOI] [PubMed] [Google Scholar]
- Talairach J, Tournoux P (1998) Co-planar stereotaxic atlas of the human brain. New York: Thieme.
- Tallon-Baudry C, Bertrand O (1999) Oscillatory gamma activity in humans and its role in object representation. Trends Cogn Sci 3: 151-162. [DOI] [PubMed] [Google Scholar]
- Tallon-Baudry C, Bertrand O, Delpuech C, Pernier J (1997) Oscillatory γ-band (30-70 Hz) activity induced by a visual search task in human. J Neurosci 17: 722-734. [DOI] [PMC free article] [PubMed] [Google Scholar]
- Tallon-Baudry C, Bertrand O, Fischer C (2001) Oscillatory synchrony between human extrastriate areas during visual short-term memory maintenance. J Neurosci 21: RC177(1-5). [DOI] [PMC free article] [PubMed] [Google Scholar]
- Thiel CM, Henson RN, Dolan RJ (2002) Scopolamine but not lorazepam modulates face repetition priming: a psychopharmacological fMRI study. Neuropsychopharmacology 27: 282-292. [DOI] [PubMed] [Google Scholar]
- Varela F, Lachaux JP, Rodriguez E, Martinerie J (2001) The brain web: phase synchronization and large-scale integration. Nat Rev Neurosci 2: 229-239. [DOI] [PubMed] [Google Scholar]
- Wagner AD, Koutstaal W, Maril A, Schacter DL, Buckner RL (2000) Task-specific repetition priming in left inferior prefrontal cortex. Cereb Cortex 10: 1176-1184. [DOI] [PubMed] [Google Scholar]
- Wiggs CL, Martin A (1998) Properties and mechanisms of perceptual priming. Curr Opin Neurobiol 8: 227-233. [DOI] [PubMed] [Google Scholar]
- Worsley KJ, Marrett S, Neelin P, Vadal AC, Friston KJ, Evans AC (1996) A unified statistical approach for determining significant signals in images of cerebral activation. Hum Brain Mapp 4: 58-73. [DOI] [PubMed] [Google Scholar]