

Abstract
In the present study, timing of conditioned eyeblink responses (CRs) was investigated in cerebellar patients and age-matched controls using a standard delay paradigm. Findings were compared with previously published data of CR incidences in the same patient population (Gerwig et al., 2003; Timmann et al., 2005). Sixteen patients with pure cortical cerebellar degeneration (spinocerebellar ataxia type 6 and idiopathic cerebellar ataxia), 14 patients with lesions within the territory of the superior cerebellar artery, and 13 patients with infarctions within the territory of the posterior inferior cerebellar artery were included. The affected cerebellar lobules and possible involvement of cerebellar nuclei were determined by three-dimensional magnetic resonance imaging (MRI) in patients with focal lesions (n = 27). Based on a voxel-by-voxel analysis, MRI lesion data were related to eyeblink conditioning data. CR incidence was significantly reduced, and CRs occurred significantly earlier in patients with cortical cerebellar degeneration and lesions of the superior cerebellum compared with controls. Incidence and timing of CRs was not impaired in patients with lesions restricted to the posterior and inferior cerebellum. Voxel-based MRI analysis revealed that cortical areas within the anterior lobe (Larsell lobule HV) were most significantly related to timing deficits, whereas reduced CR incidences were related to more caudal parts (lobule HVI) of the superior cerebellar cortex. The present data suggest that different parts of the superior cerebellar cortex may be involved in the formation of the stimulus association and appropriate timing of conditioned eyeblink responses in humans. Extracerebellar premotoneuronal disinhibition, however, is another possible explanation for changes in CR timing.
Keywords: blink reflex, eyeblink conditioning, associative learning, timing, cerebellum, human
Introduction
Eyeblink conditioning is one important model to study neural substrates involved in motor learning and memory. Numerous animal studies, most of them in the rabbit, provide evidence that cerebellar structures are important for conditioning of the external eyelid blink and the nictitating membrane response (for review, see Bloedel and Bracha, 1995; Thompson et al., 1997; Yeo and Hesslow, 1998). There is equal evidence that the human cerebellum plays a role in eyeblink conditioning (Daum et al., 1993; Topka et al., 1993; Woodruff-Pak et al., 1996; Ramnani et al., 2000; Gerwig et al., 2003).
Extensive research has been performed to elucidate the different contributions of deep cerebellar nuclei and cerebellar cortex in the acquisition, retention, and expression of conditioned eyeblink responses (for review, see Woodruff-Pak and Steinmetz, 2000; Linden, 2003). One aspect centers on temporal processing capabilities of the cerebellar cortex in eyeblink conditioning (for review, see Mauk et al., 2000). In a classic paper, Perrett et al. (1993) investigated the timing of conditioned responses (CRs) after cortical cerebellar lesions using a temporal discrimination paradigm in rabbits. After cortical cerebellar lesions, including the anterior lobe, onset of conditioned responses occurred at a fixed short time interval, indicating a disruption of learned timing. Shortened CR latencies have also been reported by Thompson and coworkers after extended cortical lesions (McCormick and Thompson, 1984; Christian et al., 2004).
In addition, disturbed CR timing of various degrees has been demonstrated after reversible pharmacological disconnection of the cerebellar cortex output to the interposed nucleus (Garcia and Mauk, 1998; Bao et al., 2002; Aksenov et al., 2004) and in mice mutants with deficient long-term depression (LTD) at the parallel fiber Purkinje cell synapse (Koekkoek et al., 2003).
In contrast, Yeo et al. (1984, 1985b) found an increased variability but no shortening of CR latencies in remaining conditioned responses after cortical lesions of lobule HVI. Likewise, after pharmacological block of input pathways to cortical lobule HVI, onset and peak time latencies were not found to be shortened (Attwell et al., 2002).
Early behavioral studies (Boneau, 1958; Ebel and Prokasy, 1963) have shown that appropriate timing is equally important for the acquisition of conditioned eyeblink responses in healthy human subjects. After repeated presentation of conditioned [CS (e.g., tone)] and unconditioned [US (e.g., air puff)] stimuli, subjects learn to close the eye before onset of the US so that the eye is closed when the air puff is delivered. Evidence that the human cerebellum may be involved in conditioned eyeblink timing comes from dual-task studies (Ivry and Keele, 1989). A selective interference was found between timed-interval tapping and delay eyeblink conditioning in healthy subjects (Papka et al., 1995; Woodruff-Pak and Jaeger, 1998). Only two studies tried to assess timing parameters of conditioned eyeblink responses in patients with cerebellar disorders. In contrast to animal studies cited above, both reported a tendency of conditioned responses to be delayed (Topka et al., 1993; Woodruff-Pak et al., 1996).
The aim of the present study was to analyze timing parameters of conditioned eyeblink responses in a larger group of patients with focal cerebellar lesions. In addition, patients with pure cerebellar cortical degeneration were investigated. Timing of conditioned responses was expected to be altered in patients with cortical degenerative disorders, as well as in patients with focal lesions, including superior parts of the cerebellar cortex. In the group of patients with focal cerebellar lesions, voxel-based magnetic resonance imaging (MRI) analysis (Bates et al., 2003) was used to compare cerebellar areas related to CR timing and, based on previously published data on CR incidences in the same patients (Gerwig et al., 2003), related to stimulus association.
Materials and Methods
Subjects. In the present study, a total of 43 patients with cerebellar disorders (28 male, 15 female; mean age, 55.1 ± 11.6 years; range, 24-75 years) and 45 age- and sex-matched healthy controls (22 male, 23 female; mean age, 53.1 ± 13.0 years; range, 24-76 years) were included.
Sixteen patients presented with degenerative cerebellar disorders: spinocerebellar ataxia type 6 (SCA6) in 12 cases and idiopathic cerebellar ataxia (IDCA) in four cases (nine male, seven female; mean age, 55.3 ± 10.6 years; range, 35-74 years). SCA6 and IDCA are thought to constitute forms of “pure cerebellar ataxia” (Manto and Pandolfo, 2002). The cerebellar cortex appears to be primarily affected. Additional involvements from the peripheral sensory nerves and the corticospinal tract may be present but are commonly of a mild degree. In the degenerative group, mean duration of the disease was 9.0 ± 6.5 years.
Twenty-seven patients presented with focal cerebellar lesions (19 male, 8 female; mean age, 54.9 ± 12.2 years; range, 24-75 years). Thirteen patients presented with infarcts restricted to the territory of the posterior inferior cerebellar artery (PICA); in 12 of them, lesions were unilateral. Eleven PICA patients were male, and two were female (mean age, 54.4 ± 9.4 years; range, 36-67 years). Fourteen patients with lesions including the territory of the superior cerebellar artery (SCA) were investigated; in 10 of them, lesions were unilateral. Eight SCA patients were male, and six were female (mean age, 55.5 ± 14.9 years; range, 24-75 years). Eight patients presented with infarcts restricted to the SCA territory, and three had infarcts within the SCA and PICA territory. Time since infarct varied between 0.5 and 38 months. Three patients of the SCA group suffered from cerebellar angioma, surgical lesion after astrocytoma, and cerebellar agenesis.
The neurological examination according to the ataxia rating scale of Trouillas et al. (1997) revealed mild signs of cerebellar ataxia (total ataxia score, <10 of 100) in two degenerative patients, moderate signs of cerebellar ataxia (total ataxia score, 10-20) in one patient, and moderate to severe signs (total ataxia score, >20 of 100) in 13 degenerative patients. Seventeen of the patients with focal cerebellar lesions showed mild signs of ataxia, eight patients moderate signs, and two patients showed severe signs of cerebellar ataxia.
None of the patients with focal lesions showed brainstem or extracerebellar neurological signs based on neurological examination. In the degenerative group, mild hyperreflexia was present in 11 or 16 patients and reduced pallesthesia in 9 of 16 patients. None of the control subjects presented with a history of neurological diseases or revealed neurological signs. None of the cerebellar patients and control subjects received any centrally acting medication or revealed clinical signs of disordered visual or reduced hearing capacities.
Table 1 summarizes the clinical data of the patients. Informed consent was obtained from all subjects, and the study was approved by the local ethics committee of the University of Duisburg-Essen.
Table 1.
Characteristics of cerebellar subjects
|
|
|
MRI findings |
|
|
|
|
||
|---|---|---|---|---|---|---|---|---|
| Disorder |
|
Affected hemispheral lobules |
Affected nuclei |
Age |
Sex |
Duration |
Ataxia |
|
| PICA group | ||||||||
| cer-01 | PICA I | Crus II, VIIB, VIIIA | N.A. | 38 | F | 1 m | 0 | |
| cer-02 | PICA r | Crus II, VIIB, VIIIA/B, IX | N.A. | 56 | M | 2 m | 3 | |
| cer-03 | PICA I | VIIIA/B, IX | N.A. | 57 | M | 2 m | 9 | |
| cer-04 | PICA r | Crus II, VIIB, VIIIA/B | N.A. | 64 | M | 0.5 m | 3 | |
| cer-05 | PICA r | VIIIA/B, IX | N.A. | 63 | M | 3 m | 0 | |
| cer-06 | PICA r | VIIB, VIIIA/B | Dentate° | 51 | M | 3 m | 7 | |
| cer-07 | PICA I | Crus II, VIIB, VIIIA/B | Dentate° | 62 | M | 2.3 y | 1 | |
| cer-08 | PICA I | Crus I, Crus II, VIIIA/B | Dentate° | 49 | M | 1 m | 5 | |
| cer-09 | PICA I | Crus I, Crus II, VIIB, VIIIA/B | Dentate° | 57 | M | 9 m | 11 | |
| cer-10 | PICA I | Crus I/II, VIIB, VIIIA/B, IX | Dentate° | 36 | M | 0.25 m | 2 | |
| cer-11 | PICA b | I, VIIB, VIIIA; r, VIIB, VIIIA | N.A. | 57 | M | 0.5 m | 0 | |
| cer-12 | PICA I | * | 50 | F | 0.5 m | 7 | ||
| cer-13 | PICA I | * | 67 | M | 1.5 m | 14 | ||
| SCA group | ||||||||
| cer-14 | SCA I | V, VI, Crus I | N.A. | 50 | F | 1.5 m | 4 | |
| cer-15 | SCA I | V, VI | N.A. | 53 | F | 3 y | 3 | |
| cer-16 | SCA I | V, VI | N.A. | 65 | M | 2 m | 3 | |
| cer-17 | SCA I | III | N.A. | 75 | F | 0.5 m | 31 | |
| cer-18 | SCA/PICA I | IV, V, Crus I/II, VIIB, VIIIA/B | Dentate | 73 | F | 2 y | 13 | |
| cer-19 | SCA I | III, IV, V, VI | Interposed | 45 | M | 0.25 m | 10 | |
| cer-20 | SCA I | IV, V, VI, Crus I | Interposed | 67 | M | 1 m | 8 | |
| cer-21 | SCA r | III, IV, V, VI, Crus I | Interposed, dentate | 56 | M | 5 m | 12 | |
| cer-22 | SCA/PICA r | IV, V, Crus I/II, VIIB, VIIIA/B | Interposed, dentate | 38 | M | 2.5 y | 1 | |
| cer-23 | SCA b | I, Crus I; r, V, VI, Crus I | Interposed, dentate r | 39 | M | 1 m | 46 | |
| cer-24 | Angioma b | I, V, VI, Crus I; r, V, VI | Interposed, dentate b | 24 | M | 3 y | 11 | |
| cer-25 | Astrocytoma b | I, VI, Crus I/II, VIIA/B; r, IV, V, VI, Crusl/II, XI | Interposed, dentate b | 68 | F | 42 y | 14 | |
| cer-26 | Cer. Agenesis | ** | 59 | F | 59 y | 20 | ||
| cer-27 | SCA r | * | 65 | M | 2.7 y | 3 | ||
|
|
|
Degree of cerebellar atrophy |
|
|
|
|
|
|
| Degenerative group | ||||||||
| cer-28 | SCA6 | Mild | 48 | M | 10 y | 19 | ||
| cer-29 | SCA6 | Moderate | 58 | F | 2 y | 23 | ||
| cer-30 | SCA6 | Moderate | 51 | F | 9 y | 39 | ||
| cer-31 | SCA6 | Moderate | 61 | M | 6 y | 26 | ||
| cer-32 | SCA6 | Moderate | 55 | F | 4 y | 37 | ||
| cer-33 | SCA6 | Moderate | 74 | F | 13 y | 62 | ||
| cer-34 | SCA6 | Moderate to severe | 72 | M | 7 y | 71 | ||
| cer-35 | SCA6 | Mild to moderate | 65 | F | 6 y | 35 | ||
| cer-36 | SCA6 | Severe | 60 | M | > 20 y | 56 | ||
| cer-37 | SCA6 | Mild to moderate | 45 | M | 3 y | 5 | ||
| cer-38 | SCA6 | Mild | 67 | F | 5 y | 25 | ||
| cer-39 | SCA6 | Mild | 48 | M | 5 y | 3 | ||
| cer-40 | IDCA | Moderate to severe | 47 | M | 20 y | 51 | ||
| cer-41 | IDCA | Moderate to severe | 35 | F | 6 y | 21 | ||
| cer-42 | IDCA | Moderate | 52 | M | 6 y | 23 | ||
| cer-43 |
IDCA |
Mild |
|
48 |
M |
23 y |
30 |
|
Affected cerebellar lobules are named according to Schmahmann et al. (2000). Ataxia, Total ataxia score based on Cooperative Ataxia Rating Scale (Trouillas et al., 1997) (maximum total score, 100); Duration, duration of disease/time since lesion; m, months; y, years; dentate°, posterolateral parts of dentate nucleus; M, male; F, female; r, right; l, left; b, bilateral; N.A., not applicable.
*, No 3D MRI data were available; **, complete absence of the cerebellum.
MR imaging. Methodological details of brain imaging procedures in the patients with focal cerebellar lesions have been reported previously (Gerwig et al., 2003) and are repeated in brief. Individual three-dimensional (3D) MRI data sets were acquired by a FLASH (fast low-angle shot) sequence on a Siemens (Munich, Germany) Sonata 1.5 tesla MR scanner. Cerebellar lesions were manually traced and saved as regions of interest (ROIs) using MRIcro software (Rorden and Brett, 2000). Data sets were spatially normalized to standard stereotaxic brain space (MNI 152 space) using SPM99 software (Wellcome Department of Cognitive Neurology, London, UK) according to the Montreal Neurologic Institute (MNI) protocol and presented within a Talairach grid (Evans et al., 1994). MNI coordinates of individual cerebellar lesions were determined in horizontal, sagittal, and vertical directions. The 3D MRI atlas of the human cerebellum of Schmahmann et al. (2000) was used to identify affected lobules, and the 3D MRI atlas of cerebellar nuclei introduced by Dimitrova et al. (2002) was used to identify affected cerebellar nuclei. Throughout Results and Discussion, the term affected cerebellar nuclei is used to indicate damage to the interposed nucleus. Eight SCA patients presented with involvement of the interposed nucleus; in six, the interposed nucleus was not affected. In all of the PICA patients, the interposed nuclei were spared. Extent of individual lesions is summarized in Table 1.
Voxel-based lesion-symptom mapping (VLSM version 1.3) software based on Matlab (MathWorks, Natick, MA) functions was used to analyze MRI lesion and blink reflex behavioral data (Bates et al., 2003). VLSM analysis was performed using the ROIs described above. VLSM is a technique for statistical analysis of the relationship between tissue damage and behavior on a voxel-by-voxel basis, which does not demand patients to be grouped by either lesion site or behavioral cutoff. A t test is conducted at each voxel comparing the behavioral scores of the intact and lesioned patients on the parameter of interest. The generated VLSM map displays the t scores calculated by the t test in which, by convention, high positive t scores indicate that lesions to these voxels have a highly significant effect on behavior (that is, lesioned patients were worse than the intact patients), and high negative t scores show regions in which the presence of a lesion has relatively little impact on the behavioral data. Right-sighted cerebellar lesions were flipped to the left. t values between 0 and 3.5 and 0 and -3.5 were calculated for CR incidence and CR onset latencies before the US in patients with unilateral lesions. CR incidences were normalized to the unaffected side (affected/unaffected side). Data sets were superimposed on MR images of the cerebellum of a healthy subject, which was normalized to MNI space.
In all but three of the patients with focal cerebellar lesions, 3D MRI data sets were available. Additional axial and sagittal 2D T2-weighted cranial MR images were acquired and inspected for possible brainstem involvement or other extracerebellar lesions.
In patients with cerebellar degeneration, diagnostic MR images were available in all cases. Extent of cortical atrophy was defined as mild, moderate, and severe.
Eyeblink conditioning. Eyeblink conditioning and recording techniques have been described in an accompanying study (Gerwig et al., 2003) and are repeated briefly. An air puff (duration, 100 ms; intensity, 400 kPa at source, 110 kPa at nozzle) served as the US and was directed through a nozzle near the outer canthus of the eye at a distance of ∼10 mm. The CS consisted of a 1 kHz tone [70 dB sound pressure level (SPL)] presented ipsilaterally and coterminating with the air puff. To mask environmental noise, all subjects wore headsets. In addition, the CS was superimposed on a continuous noise of 60 dB SPL applied bilaterally.
In all cerebellar patients and control subjects, a short CS-US interval of 440 ms was used (short CS-US interval condition). Tone duration was 540 ms. In all patients with focal cerebellar lesions and in 27 control subjects, the right and the left sides were investigated on 2 separate days. In addition, a 150 ms longer CS-US interval (590 ms) was tested in eight of the degenerative cerebellar patients (Table 1, cer-36 to cer-43) and eight of the control subjects (long CS-US interval condition). In the latter, tone duration was 690 ms. The long CS-US interval condition was tested 1 week after the short CS-US interval condition.
Five CS-alone trials and five US-alone trials were presented at the beginning of the experiment in an unpaired and random sequence. This was followed by 100 paired CS-US trials. At the end of the experiment, 10 CS-alone trials were presented as extinction trials. Throughout the experiment, the interstimulus interval varied randomly between 20 and 35 s.
Surface EMG recordings were taken from orbicularis oculi muscles bilaterally with electrodes fixed to the lower eyelid and to the nasion. Signals were fed to EMG amplifiers (sampling rate, 1000 Hz; bandpass filter frequency between 100 Hz and 2 kHz), full-wave rectified, and further filtered off-line (100 Hz).
In patients with unilateral cerebellar lesions, the affected side was tested first. In patients with cerebellar degeneration, only one side was investigated. In case of a side difference in degree of ataxia, the more affected side was tested, otherwise the right side.
Using a commercial software (Axograph V4 for Macintosh, Axon Instruments, Union City, CA) EMG recordings in paired and extinction trials were analyzed on a trial-by-trial basis. EMG activity lasting at least 50 ms or merging into superimposed unconditioned response (UR) of at least twice the amplitude of mean EMG baseline activity and clear rising slope was defined as CR. The time window for detection of CR was from 150 ms after CS onset to the onset of the US.
In our previous studies on CR acquisition in the same patient population, responses occurring within the 150 ms interval after CS onset were considered as reflexive responses to the tone (i.e., alpha responses) and not conditioned responses (Gerwig et al., 2003; Timmann et al., 2005). The criterion of 150 ms was chosen based on previous work by Woodruff-Pak et al. (1996). Conditioned responses as short as 60-80 ms have been reported in previous animal cerebellar lesion studies (Perrett et al., 1993) and hence may be excluded from analysis. Alpha responses using the 150 ms criterion, however, were not significantly increased in the cerebellar subgroups compared with controls (see Results). The 150 ms criterion was therefore maintained in the present study.
Trials with spontaneous blinks occurring before CS onset were excluded from the analysis (Bracha et al., 2000). The number of conditioned responses in paired trials was expressed as the percentage of trials containing responses with respect to each block of 10 trials (percentage CR incidence) and the total number of trials (total percentage CR incidence). In extinction trials, the absolute number of conditioned responses was calculated.
Onset and peak time latencies of conditioned eyeblink responses within the CS-US interval were visually identified. Onset was expressed as time of CR onset before onset of the air puff (US) and time-to-peak as time of maximum amplitude observed before onset of the air puff. The time of the air puff was set as 0 ms. CR onset was marked at the earliest point at which EMG activity began to rise from the pre-CS EMG baseline level. In the case of multiple peaks, the latency of the peak with the largest amplitude was defined. Data analysis was performed by the same experienced technician (Beate Brol), who was blinded for the subjects' diagnosis. She was also not aware of the purpose of the study at the time CR onsets were determined.
Because conditioned responses were followed and partially superimposed by unconditioned eyeblink responses, it was not possible to determine the end of the EMG burst in paired trials, i.e., duration and total burst area of conditioned responses. Instead, EMG integral was measured in a fixed interval of 75 ms from onset of the conditioned response avoiding interference with the unconditioned response in most cases. In patients with unilateral cerebellar lesions and control subjects, amplitude parameters of the side tested first (i.e., affected in patients) were normalized to the mean values of the second tested side (i.e., unaffected in patients) set as 100%. This made it possible to compare amplitude values between subjects and groups.
The frequency of spontaneous blinks was estimated by counting responses within the 310 ms time interval before CS onset in each trial, and the average rate of spontaneous blinks was calculated across the experiment as blinks per minute. No significant group differences were found comparing spontaneous blinks in SCA and PICA patients with control subjects (short CS-US interval, first tested side, SCA, 18.2 ± 9.6 blinks/min; PICA, 18.7 ± 9.2 blinks/min; controls, 19.2 ± 15 blinks/min; all p values >0.5). In the degenerative patients, spontaneous blinks tended to be less (short CS-US interval, degenerative patients, 10.7 ± 9.0 blinks/min; p = 0.039).
Results
Short CS-US interval
Incidence of conditioned eyeblink responses
Results of CR incidences in the patients with focal lesions and eight of the 16 patients with degenerative disorders have been reported previously (Gerwig et al., 2003; Timmann et al., 2005).
In the group of all cerebellar patients (n = 43), CR incidences were significantly reduced compared with the group of all control subjects (n = 45) (Fig. 1A). Both control subjects and patients showed an increase of CR incidences across the 10 blocks of 10 CS-US trials each (i.e., learning). The amount of learning, however, was significantly less in the cerebellar patients compared with controls. ANOVA with repeated measures showed significant group (control subjects vs cerebellar patients; p < 0.001), block (10 blocks of 10 CS-US trials; p < 0.001), and block by group interaction (p < 0.001) effects.
Figure 1.

Mean ± SE percentage CR incidences for each of the 10 blocks and across all blocks (Total) in the group of all control subjects (white squares) and all cerebellar patients (black circles) (A) and in SCA (affected side; black circles), PICA (affected side; white circles), and degenerative patients (gray circles) (B).
Reduction of learning was most prominent in the SCA (n = 14) and degenerative (n = 16) patients and less in the PICA patients (n = 13) (Fig. 1B). A detailed comparison of CR incidences in the SCA and PICA patients has been reported by Gerwig et al. (2003). In brief, it was found that lesions including the common territory of the SCA (that is, Crus I and above), but not lesions affecting the common territory of the PICA (that is, Crus II and below) significantly reduce eyeblink conditioning in humans.
Comparing the three subgroups of cerebellar patients with the control group showed significant block (p values <0.001) and group (p values <0.05) effects. Group by block interaction effects were significant comparing controls and SCA and degenerative patients (p values <0.05) but not comparing controls and PICA patients (p = 0.36). Post hoc analysis separately in each patient subgroup showed significant effects of learning (i.e., block effects) in PICA patients (p = 0.051). Although inspection of Figure 1B suggest a small amount of learning across the 10 blocks in SCA and degenerative patients, ANOVA revealed no significant block effects (SCA, p = 0.27; degenerative patients, p = 0.67).
Timing of conditioned eyeblink responses
Conditioned responses occurred on average earlier in cerebellar patients compared with controls (Fig. 2A,B). Both CR onset and peak time were significantly reduced comparing all patients (n = 43) and controls (n = 45) (p values <0.05; two-tailed unpaired t test). Mean group differences, however, were small (Δ CR onset, 19.0 ms; Δ CR peak time, 20.2 ms).
Figure 2.

Timing parameters of conditioned eyeblink responses. Group mean ± SD values of the affected (controls; first tested) side shown for CR onset (A, C), and time-to-peak (B, D) latencies expressed in time (milliseconds) before US (air puff) onset set as 0 ms. Mean values are shown considering all subjects in each group (A, B) and the subjects who presented with at least 10 CRs (C, D).
Eyeblink conditioning was significantly reduced in the cerebellar patients. To improve reliability of findings, analysis was repeated in the cerebellar patients (n = 23) and control subjects (n = 41) who showed at least 10 conditioned responses (Fig. 2C,D). A similar reduction of CR onset and peak time was observed in the subgroup of cerebellar patients (at least 10 CRs; Δ CR onset, 16.9 ms; Δ CR peak time, 16.7 ms; p values <0.05).
Additional analysis showed that conditioned responses occurred earlier in patients with lesions including the superior cerebellum, that is, SCA patients (CR onset, p = 0.031; CR peak time, p = 0.022) and patients with degenerative cerebellar disorders (CR onset, p = 0.031; CR peak time, p = 0.06) (Fig. 2A,B) but not in patients with lesions restricted to the posterior and inferior cerebellum (PICA patients; p values >0.5). Findings were most prominent in the SCA patients (n = 5) with pure cortical cerebellar lesions.
Similar differences were observed comparing SCA patients and control subjects (CR onset, p = 0.034; CR peak time, p = 0.059) but not PICA patients and control subjects (p values >0.5) who showed at least 10 CRs (Fig. 2C,D). Comparing degenerative patients and controls did not reach significance, likely attributable to the small number of degenerative patients with at least 10 CRs (n = 4). A summary of group means and statistical analysis is given in Table 2, top.
Table 2.
Summary of group mean averages ± SD (top) and variability (mean ± SD) (bottom) of CR onset and peak time latencies in the control group compared with all cerebellar patients and cerebellar subgroups
|
|
CR onset, all CRs |
CR peak time, all CRs |
CR onset, at least 10 CRs |
CR peak time, at least 10 CRs |
|---|---|---|---|---|
| Group mean averages | ||||
| Controls | −132.0 ± 37.8 | −90.6 ± 39.0 | −126.6 ± 32.24 | −84.8 ± 33.7 |
| (n = 45/41*) | ||||
| All patients | −151.1 ± 39.5 | −110.8 ± 41.9 | −143.5 ± 26.1 | −101.5 ± 26.2 |
| (n = 43/23) | p = 0.023 | p = 0.022 | p = 0.036 | p = 0.045 |
| Degenerative | −157.8 ± 45.6 | −113.9 ± 49.5 | −150.6 ± 29.3 | −110.1 ± 26.9 |
| (n = 16/4) | p = 0.031 | p = 0.061 | p = 0.16 | p = 0.15 |
| SCA | −157.8 ± 38.4 | −118.5 ± 37.2 | −151.7 ± 25.0 | −107.7 ± 22.7 |
| (n = 14/9) | p = 0.031 | p = 0.022 | p = 0.034 | p = 0.059 |
| SCA cortical | −178.0 ± 20.1 | −136.2 ± 31.6 | −165.5 ± 10.6 | −118.7 ± 24.1 |
| (n = 5/3) | p = 0.011 | p = 0.015 | p = 0.046 | p = 0.097 |
| SCA nuclear | −148.3 ± 45.0 | −110.7 ± 40.1 | −147.1 ± 30.7 | −104.2 ± 23.9 |
| (n = 8/5) | p = 0.28 | p = 0.18 | p = 0.18 | p = 0.22 |
| PICA | −135.7 ± 29.7 | −98.5 ± 36.5 | −133.4 ± 24.9 | −92.5 ± 28.6 |
| (n = 13/10) | p = 0.75 | p = 0.51 | p = 0.54 | p = 0.51 |
| Group mean SDs | ||||
| Control subjects | 62.3 ± 18.8 | 61.6 ± 21.8 | 62.1 ± 18.9 | 60.6 ± 22.0 |
| (n = 45/41*) | ||||
| All patients | 69.1 ± 26.9 | 66.6 ± 25.2 | 70.1 ± 12.6 | 69.7 ± 14.5 |
| (n = 43/23) | p = 0.16 | p = 0.32 | p = 0.049 | p = 0.053 |
| Degenerative | 62.0 ± 36.9 | 60.5 ± 32.3 | 66.5 ± 6.2 | 68.5 ± 12.2 |
| (n = 16/4) | p = 0.97 | p = 0.87 | p = 0.64 | p = 0.48 |
| SCA | 71.5 ± 13.8 | 69.7 ± 15.9 | 74.5 ± 13.8 | 74.5 ± 11.9 |
| (n = 14/9) | p = 0.095 | p = 0.20 | p = 0.070 | p = 0.076 |
| SCA cortical | 67.3 ± 12.3 | 70.0 ± 14.1 | 62.3 ± 13.6 | 67.1 ± 8.7 |
| (n = 5/3) | p = 0.56 | p = 0.40 | p = 0.99 | p = 0.61 |
| SCA nuclear | 74.0 ± 15.8 | 69.2 ± 18.9 | 82.3 ± 10.0 | 79.4 ± 13.2 |
| (n = 8/5) | p = 0.10 | p = 0.36 | p = 0.025 | p = 0.071 |
| PICA | 74.6 ± 22.8 | 71.0 ± 23.8 | 67.5 ± 13.2 | 65.8 ± 17.3 |
| (n = 13/10) |
p = 0.052 |
p = 0.18 |
p = 0.40 |
p = 0.49 |
Two-tailed unpaired t test were performed for group comparisons. n, Number of all subjects in each group/number of subjects who revealed at least 10 CRs.
To exclude that the small group differences were caused by findings in few patients only, individual data were examined in more detail. Figure 3 shows mean and SDs of CR onset and peak time in all individual PICA (A, D), SCA (B, E), and degenerative (C, F) patients compared with all individual control subjects. Data of individual subjects in each group are shown in ascending order. Despite considerable intrasubject and intersubject variability, individual mean CR onset and peak time latencies were clearly separated in the degenerative and SCA patients from the controls but overlapped in controls and PICA patients.
Figure 3.

Timing parameters of conditioned eyeblink responses. Individual mean ± SD values shown for CR onset (A-C) and peak time (D-F) latencies expressed in time (milliseconds) before US (air puff) onset set as 0 ms. Findings in control subjects (white squares) are compared with the PICA (A, D), SCA (B, E), and degenerative (C, F) patients (black squares). Data of individual subjects in each group are shown in ascending order. Patient code according to Table 1. n is number of conditioned responses in each individual patient.
Inspection of individual SDs in Figure 3 indicates that the variability of CR onset and peak time latencies tended to be larger in cerebellar patients compared with controls. Group differences were significant or reached significance comparing all cerebellar patients and SCA patients, who showed at least 10 CRs, and controls (SD CR onset, p values = 0.049 and 0.07; SD CR peak time, p values = 0.053 and 0.076) and PICA patients and controls (SD CR onset, p = 0.052). A summary of group mean SDs and statistical analysis is given in Table 2, bottom.
Group data are further illustrated by showing examples of individual cerebellar patients. In both an SCA patient (Fig. 4C; Table 1, cer-25) and an SCA6 patient (Fig. 4D, cer-34), CRs occurred significantly earlier compared with a control subject (Fig. 4A). In contrast, the onset and peak time of conditioned responses on the affected side in a PICA patient were similar to the control (Fig. 4B, cer-05).
Figure 4.

Conditioned eyeblink responses in a representative control subject (A), PICA (cer-05; B), SCA (cer-25; C), and SCA6 (cer-34; D) patient. Dotted vertical lines indicate onset of the CS (tone) and the US (air puff). Time scale is presented in milliseconds before US onset set as 0 ms. Mean values of rectified and filtered (45 Hz) EMG recordings of CRs inpaired trials are shown. Note that this figure and Figure 5 represent mean values of conditioned responses in contrast to statistical analysis based on single trials. Data were filtered at 45 Hz in this figure and in Figures 5 and 10 but at 100 Hz in data analysis. AU, Arbitrary units.
Finally, CR onset and peak time latencies were compared on the affected and unaffected sides in patients with unilateral focal lesions. EMG recordings of two characteristic SCA patients (Table 1, cer-20, cer-18) show significantly shorter CR onset on the affected compared with the unaffected side (Fig. 5C,D). In contrast, no side differences are present in a PICA patient (Fig. 5B, cer-09) and an age-matched control subject (Fig. 5A). Group data of CR onset and time-to-peak latencies on the affected compared with the unaffected side in patients with unilateral lesions (n = 22) and the first versus second tested side in control subjects (n = 27) show similar results (Fig. 6A,B). In all SCA patients (n = 10), CRs occurred earlier on the affected side [-166.6 ± 29.2 ms, mean ± SD; latencies expressed in time before US (air puff) onset set as 0 ms] than on the unaffected side (-141.3 ± 30.7 ms). The side effect was close to significance (p = 0.08; ANOVA). Peak time latencies in all SCA patients were significantly shorter on the affected side (-128.4 ± 35.0 ms) compared with the unaffected side (-93.2 ± 30.0 ms; p = 0.035).
Figure 5.

Individual examples of conditioned eyeblink responses in a control subject (A), a PICA patient (cer-09; B), an SCA patient with involvement of cerebellar nuclei (cer-20; C), and with a pure cortical lesion (cer-18; D). Rectified and filtered (45 Hz) EMG recordings are shown of the affected (top) and unaffected (bottom) sides in patients and the first and second tested sides in the control. Dotted vertical lines indicate onset of the CS (tone) and the US (air puff, 0 ms). Mean values of conditioned eyeblink responses in paired trials are shown. Amplitudes are normalized to the unaffected side (controls, second tested side) set as 100%.
Figure 6.

Mean onset (A) and time-to-peak (B) of conditioned eyeblink responses in SCA and PICA patients with unilateral lesions and in control subjects. Mean ± SD values are shown on the affected side in patients and first tested side in controls (black columns) compared with the unaffected and second tested side (white columns). 0 ms, US (air puff) onset.
Comparing CR onset and peak time latencies in SCA patients, who showed at least 10 CRs on both the affected and unaffected sides, revealed earlier conditioned responses on the affected (onset, -151.85 ± 19.34 ms; peak time, -110.78 ± 21.87 ms) compared with the unaffected (onset, -140.80 ± 27.6 ms; peak time, -89.15 ± 24.76 ms) side. Side differences, however, were not significant (onset, p = 0.27; peak time, p = 0.097), possibly because of the smaller number of patients (n = 7). Similarly, comparison of timing parameters of the affected and unaffected sides in SCA patients with pure cortical lesions (n = 5) and SCA patients with involvement of cerebellar nuclei (n = 5) did not reveal significant differences (p values = 0.28 and 0.34 for CR onset and 0.42 and 0.08 for peak time latency).
In PICA patients (n = 12), CR onset was not significantly different comparing the affected (-130.7 ± 24.7 ms) and the unaffected (-142.3 ± 44.6 ms; p = 0.417) sides. This was also true for peak time latencies in PICA patients on the affected side (-92.1 ± 29.3 ms) compared with the unaffected side (-98.3 ± 45.8 ms; p = 0.684). In control subjects, no significant side effects were found for CR onset latencies comparing the first (-135.4 ± 31.5 ms) and second (-130.0 ± 34.8 ms; p = 0.51) tested side and for peak time latencies between the first (-93.5 ± 34.5 ms) and second (-84.5 ± 37.9 ms; p = 0.30) tested side. Likewise, comparisons of the affected (or first) and unaffected (or second) side revealed no significant differences in the PICA patients (n = 9) and control subjects (n = 23) with at least 10 CRs on both sides (all p values <0.09).
VLSM
Voxel-based lesion-symptom mapping was performed to reveal areas within the cerebellum that are related to changes in CR incidence and CR onset latencies in patients with focal unilateral lesions (n = 22) in the short CS-US interval condition.
Relating cerebellar lesion sites (that is, ROIs; see Materials and Methods) with CR incidences normalized to the unaffected side revealed highest positive t values (that is, lowest CR incidences) primarily within hemispheral lobule VI (Larsell HVI) extending to posterior parts of adjacent lobule V [Figure 7A, dark yellow; x-coordinates, left from anterior to posterior commissure (AC-PC) line, from -16 to -46 mm; y-coordinates, behind AC line, from -50 to -70 mm; z-coordinates, below AC-PC line, from -24 to -32 mm]. Regarding the relationship of lesion sites and CR onset latencies, highest positive t values (that is, shortest CR onsets) were found within hemispheral lobule V (Larsell HV) extending to adjacent lobules HIV and anterior parts of HVI (Fig. 7B, yellow; x-coordinates from -16 to -40 mm; y-coordinates from -30 to -62 mm; z-coordinates from -20 to -32 mm). Similar findings were observed considering only those patients with unilateral lesions (n = 16) who showed at least 10 CRs.
Figure 7.

VLSM in all patients with unilateral cerebellar lesions. VLSMs related to normalized incidence (A) and onset latencies (B) of conditioned eyeblink responses superimposed on axial slices of the cerebellum of a healthy subject normalized to MNI space. Right-sided lesions are flipped to the left. Slices are 4 mm apart, with the most caudal slice (z = -52 mm) in the left top corner.
Long CS-US interval
Incidence of conditioned eyeblink responses
Eight control subjects and eight patients with degenerative cerebellar disorders were tested using a short and a long CS-US interval 1 week apart. The short CS-US interval was always tested first.
On the first day of testing (short CS-US interval), control subjects, but not cerebellar patients, showed a significant increase of mean CR incidences across the 10 blocks of ten CS-US trials (Fig. 8A). In controls, mean CR incidence was similar comparing the last block on the first and the first block of the second day (long CS-US interval) of testing, that is, controls showed effects of retention. There was, however, no additional increase of conditioned responses across the 10 blocks in the long CS-US condition (Fig. 8B). Cerebellar patients showed a small increase of total CR incidences between the 2 d of testing. CR incidences remained significantly reduced compared with the controls and showed no significant increase across blocks.
Figure 8.

Mean ± SE percentage CR incidences for each of the 10 blocks and across all blocks (Total) in the short (A) and long (B) CS-US interval conditions in the subgroups of eight control subjects (white squares) and eight degenerative cerebellar patients (black circles).
ANOVA with CR incidence as dependent variable showed significant block (10 blocks of 10 CS-US trials; p = 0.016), condition (short vs long CS-US interval; p = 0.036), and group (controls vs patients; p = 0.005) effects. The condition by block by group interaction effect reached significance (p = 0.077). Condition by group (p = 0.63), block by group (p = 0.18), and condition by block (p = 0.12) interaction effects were not significant.
Please note that one patient (Table 1, cer-42) only (vs six control subjects) presented with at least 10 CRs in the short CS-US interval condition, and three patients (cer-38, cer-41, and cer-42) and six control subjects in the long CS-US interval condition.
Timing of conditioned eyeblink responses
Comparison of the short and long CS-US interval condition revealed that conditioned responses were timed in both the control and cerebellar groups. In the control subjects and cerebellar patients, CR onset and peak time occurred later after CS onset in the long (590 ms) compared with the short (440 ms) CS-US interval condition (Fig. 9). In both groups, however, the average increase of CR onset and peak time latencies was significantly <150 ms. Mean average increase of onset latencies was 62.4 ± 91.2 ms (mean ± SD) in all cerebellar patients and 56.6 ± 36.66 ms in controls; mean average increase of peak time latencies was 58.10 ± 84.28 ms in patients and 67.45 ± 35.0 ms in controls.
Figure 9.

Timing parameters of conditioned eyeblink responses in the short (black columns) and long (white columns) CS-US interval condition in the subgroups of eight control subjects and eight cerebellar patients. Group mean ± SD values shown for CR onset (A) and time-to-peak latencies (B) expressed in time (milliseconds) before US (air puff) onset set as 0 ms. Mean values are shown considering all subjects in each group and the subjects who presented with at least 10 CRs.
Overall, timing disorders were significantly less prominent in this subgroup of eight cerebellar patients and control subjects compared with the findings in the total of 43 patients and 45 controls reported above. In fact, comparing CR onset and peak time latencies in the eight cerebellar patients and eight control subjects revealed no significant group differences, considering neither the short nor the long CS-US interval (p values >0.5; unpaired two-tailed t test) (Fig. 9A,B).
However, findings in the patients and control subjects presenting with at least 10 CRs showed clear group differences. In the short CS-US condition, CR onset in the one patient (cer-42) with at least 10 CRs was -187 ± 73.4 ms and CR peak time was -130 ± 76.3 ms compared with a mean CR onset of -110.97 ± 39.2 ms and mean CR peak time of -66.22 ± 35.71 ms in the six control subjects [latencies expressed in time before US (air puff) onset set as 0 ms]. In the long CS-US interval condition, the three patients with at least 10 conditioned responses (cer-38, cer-41, and cer-42) showed a mean onset latency of -256.21 ± 80.97 ms and mean peak time of 213.51 ± 72.6 ms, whereas onset (-208.45 ± 39.25 ms; n = 6) and peak time [-183.06 ± 69.26 ms; n = 5 (peak time could not be defined in one control because of multiple peaks)] occurred later in the six controls. Group differences, however, did not become significant, most likely because of the small number of subjects and considerable variability (p values = 0.133-0.255; unpaired two-tailed t test) (Fig. 9A,B).
Group findings are illustrated by individual data in cer-42 compared with a control subject (Fig. 10). In both the short and long CS-US interval condition, conditioned responses occurred significantly earlier in the cerebellar patient.
Figure 10.
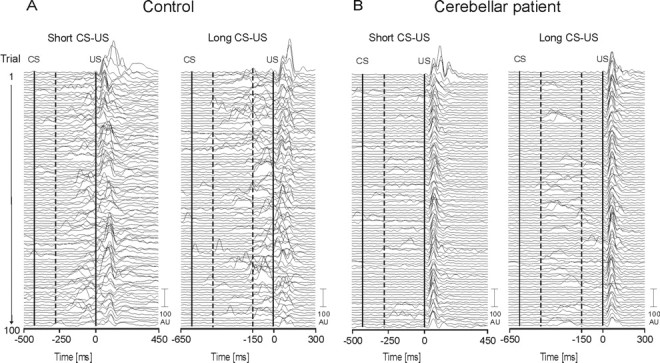
Eyeblink conditioning in a 45-year-old male control subject (A) and a 52-year-old male IDCA patient (B) (Table 1, cer-42) in the short (left) and long (right) CS-US interval conditions. Rectified and filtered (45 Hz) EMG data of the orbicularis oculi muscles of 100 paired CS-US trials (first trial on the top, last trial on the bottom) are shown. The first vertical line indicates the beginning of the tone (CS) and the second vertical line the beginning of the air puff (US) in each condition. Responses occurring within the first 150 ms after CS onset (indicated by the first hatched line) were not considered CRs but alpha responses. Second hatched line indicates time of US onset in the short CS-US interval condition. Control subject: short CS-US, mean onset, -120.4 ± 55.4; mean peak time, -70.85 ± 53.2; long CS-US, mean onset, -199.1 ± 10.5.9; mean peak time, -139.5 ± 108.1. Cerebellar patient: short CS-US, mean onset, -187 ± 73.4 ms; mean peak time, -130.0 ± 76.3 ms; long CS-US, mean onset, 316.7 ± 103.4 ms; mean peak time, -265.7 ± 108.3 ms.
The variability (i.e., individual SDs) of CR onset and peak time latencies in the group of the eight cerebellar patients and patients with at least 10 CRs was not significantly different compared with the controls for both the short and the long CS-US interval (p values >0.3).
Alpha responses
Incidence and onset of alpha responses (that is, responses occurring within 150 ms after CS onset) were calculated in paired trials. In the short CS-US condition compared with the first tested side in controls (4.33 ± 3.4), mean incidences of alpha blinks did not significantly differ from the affected side in SCA patients (3.64 ± 2.9; p = 0.5; two-tailed unpaired t test) and in PICA patients (5.46 ± 4.15; p = 0.332). In both the short and long CS-US conditions, alpha responses tended to be less in degenerative patients (short CS-US, 2.44 ± 1.9, p = 0.043; long CS-US, 1.38 ± 1.3, p = 0.032) compared with controls (long CS-US, 3.75 ± 2.4).
In the short CS-US condition, mean onset of alpha responses was not significantly different comparing the first tested side in controls (-380.2 ± 23 ms before air puff onset set at 0 ms) with the affected side in SCA patients (-370.9 ± 25.3 ms; p = 0.21; two-tailed unpaired t test), in PICA patients (-381.7 ± 22.3 ms; p = 0.83), and in degenerative patients (-378.3 ± 24.9 ms; p = 0.24). Mean onset of alpha responses in the long CS-US interval condition was not significantly different between groups (degenerative patients, -354.5 ± 41.7; controls, -364.6 ± 28.7; p = 0.6).
Amplitudes of conditioned eyeblink responses in the short CS-US interval
CR amplitudes were analyzed in the patients with focal unilateral lesions only, because normalization to the unaffected side set as 100% was possible. Patients with focal lesions participated in the short CS-US interval condition only.
Inspection of individual EMG data show changes of CR amplitudes in the SCA patient with a pure cortical lesion but not in the SCA patient with nuclear involvement. In cer-18, but not in cer-20, CR amplitudes on the affected side were significantly enlarged (Fig. 5C,D). In the PICA patient (cer-09) and in the control subject, CR amplitudes were not different on the affected and first tested sides compared with the unaffected and second tested sides (Fig. 5A,B).
In all unilateral SCA patients, the mean area of the normalized 75 ms EMG interval was enlarged compared with controls (mean ± SE, 271.3 ± 81.5% of the unaffected side in SCA patients; 133.4 ± 29.5% of the second tested side in controls). Group effects were close to significance (p = 0.053; two-tailed unpaired t test) (Fig. 11A). In SCA patients with pure cortical lesions, the area of the 75 ms EMG interval was significantly enlarged (mean ± SE, 319.6 ± 133.4%) compared with controls (p = 0.042). In SCA patients with additional involvement of cerebellar nuclei (mean ± SE, 266.9 ± 122.7%), no significant difference was found compared with controls (p = 0.142). The normalized 75 ms EMG integral in unilateral PICA patients (mean ± SE, 134.2 ± 18.5%) was not significantly different compared with control subjects (p = 0.985). The mean SD of the 75 ms EMG integral was significantly increased in all unilateral SCA patients (mean ± SD, 142.4 ± 124.2%; p = 0.045) compared with control subjects (73.2 ± 74.7%) (Fig. 11B). In the subgroup of SCA patients with pure cortical lesions (149.3 ± 129.7%; p = 0.073) and in SCA patients with additional involvement of cerebellar nuclei (162.0 ± 137.8%; p = 0.056), effects were close to significance. No group differences were found comparing PICA patients with controls (83.4 ± 66.3%; p = 0.686). Similar findings were observed considering patients and control subjects who showed at least 10 CRs.
Figure 11.

Amplitude parameters of conditioned eyeblink responses in patients with unilateral focal lesions (PICA and SCA) compared with controls in the short CS-US interval condition. Mean ± SE amplitudes (area of the 75 ms EMG-interval) (A) and SD (B) are normalized to the unaffected (patients) and second tested (controls) side set as 100%.
Extinction
Acquisition of conditioned responses was significantly reduced in SCA and degenerative cerebellar patients who showed disordered CR timing. One may argue that the remaining responses are random but not learned responses. In extinction trials, however, CRs were present in SCA and degenerative cerebellar patients. Mean CR incidence was significantly reduced compared with controls (mean number of CRs in extinction trials, SCA group, 1.78 ± 0.66; degenerative group, 1.43 ± 0.78; controls, 2.82 ± 1.7; p values <0.01; unpaired two-tailed t test). There was no significant difference comparing PICA patients (n = 2.67 ± 1.5) and controls (p = 0.8).
The change of response timing to a later moment in paired trials in the long compared with the short CS-US interval conditions in degenerative patients (see above) may be taken as additional evidence of learned responses. However, because the CS-US interval was prolonged, this could have been a random effect. To control random effects, timing of responses in extinction trials in both the short and long CS-US conditions was determined in the same time interval of 150 ms after onset of the CS to onset of the US in the long CS-US condition. Time of US onset in the long CS-US condition was set as 0 ms. If responses occurred at random, mean onset and peak time would be expected to be the same in both conditions. Cerebellar patients showed earlier extinction responses in the short compared with the long condition [short CS-US interval, onset (expressed as time before US onset in the long interstimulus interval, mean ± SD), -319.0 ± 78.8 ms; peak time, -282.9 ± 88.49 ms; long CS-US interval, onset, -212.3 ± 92.9 ms; peak time, -137.4 ± 84.6 ms]. The shift of mean onset and peak time suggests that responses in paired trials are likely conditioned responses. It has to be noted that time shift did not reach statistical significance (onset, p = 0.2; peak time, p = 0.1; unpaired two-tailed t test). Statistical power, however, was small. A small number of cerebellar patients (n = 8) had been tested using both the short and long CS-US interval. Three of the eight cerebellar patients only showed extinction responses. Incidences were reduced in the cerebellar patients (short CS-US interval, n = 1.7 ± 1.1; long CS-US interval, n = 2.0 ± 1.0) compared with the matched controls [short CS-US interval (n = 8), n = 3.1 ± 1.2; long CS-US interval (n = 6), n = 3.7 ± 2.7]. Group differences did not reach significance (p = 0.11 and 0.33; two-tailed unpaired t test).
Discussion
The main finding of the present study was that conditioned eyeblink responses occurred significantly earlier in patients with cerebellar lesions in the SCA territory and with cerebellar cortical degeneration but not in patients with PICA infarctions. In the SCA group, timing deficits were most pronounced in patients with lesions restricted to cortical areas. Results suggest that cortical areas of the superior cerebellum may be involved in timing of conditioned eyeblink responses in humans.
Data are consistent with animal findings of disrupted conditioned response timing after cortical cerebellar lesions (McCormick and Thompson, 1984; Perrett et al., 1993; Garcia and Mauk, 1998; Koekkoek et al., 2003). Impaired timing of conditioned responses has also been shown in infant rats (Freeman et al., 2003). The precision of CR timing was found to be related to age and dependent on developmental changes within the cerebellar cortex. These studies suggest that appropriate timing, i.e., the adapted delay of conditioned responses, depends on the cerebellar cortex.
The mechanisms of adaptive timing have been related to modification of different cerebellar synapses. The simultaneous activation of the US-related climbing fibers and the CS-related mossy fiber-parallel fiber input may result in LTD of excitatory parallel fiber-Purkinje cell synapses, which are active just before the expected US. This climbing fiber input induced decreased Purkinje cell activity and reduced inhibition of interposed neurons may be followed by the expression of a timed eyeblink conditioned response. In short, normally, the Purkinje cell would inhibit the deep nuclei from generating a response until just before the US onset (for review, see Buonomano and Mauk, 1994; Medina et al., 2001; Linden, 2003).
Mauk and coworkers have shown short fixed CR onset latencies after cerebellar lesions with CRs occurring as short as 60-80 ms after CS onset (Perrett et al., 1993; Garcia and Mauk, 1998). They found that large cortical lesions that involved the anterior lobe caused short-latency responses. A similar reduction of CR onset latencies is reported by Koekkoek et al. (2003) in transgenic mice in which parallel fiber LTD is impaired. Onset and time-to-peak of conditioned responses in SCA and degenerative patients of the present study, however, were less shifted forward. CRs occurred on average 20 ms earlier compared with controls, that is, 290 ms after CS onset in the short CS-US interval condition.
Differences in findings may be explained by different reasons. First, in the present study, cortical lesions in particular of the anterior lobe might not have been extended enough. The anterior lobe was affected to various extents in both the SCA and degenerative patients. Conversely, in most of the SCA and in all degenerative patients, lesions extended beyond the anterior lobe, i.e., included lobule HVI. Moreover, there was additional damage of cerebellar nuclei in part of the SCA patients. HVI lesions possibly leave timing unchanged (Yeo et al., 1985a,b), and nuclear lesions may result in delayed CRs (Welsh and Harvey, 1989). Second, both lesions of HVI and of the cerebellar nuclei result in reduced CR incidence (Yeo and Hesslow, 1998; Christian and Thompson, 2003). The present findings are based on the remaining CRs in a group of cerebellar patients with significantly reduced CR incidences. Mauk and coworkers (Perrett et al., 1993; Garcia and Mauk, 1998), however, found that CR incidence remained unchanged after cortical lesions of the anterior lobe. Third, Mauk and colleagues analyzed CR timing in unpaired trials. In the present study, CRs in paired trials were analyzed. Because cerebellar patients exhibit few CRs, statistical analysis of timing parameters in few interspersed CS-alone trials does not appear reliable. For the same reason, timing of CRs has been analyzed in paired trials in other human studies (Woodruff-Pak and Papka, 1996; Green et al., 1999). Finally, there may be differences between species regarding temporal processing of conditioned responses.
It has been questioned that the short-latency responses reported by Mauk and colleagues are cerebellar driven. Yeo and his group have argued that, because cerebellar cortical lesions are followed by raised nuclear excitability, these responses may be produced by extracerebellar mechanisms expressing CS-driven activity through disinhibited premotor and motor neurons (for review, see Attwell et al., 2002). In their cortical lesion studies, which centered on lobule HVI, complete losses of CRs were observed. In cases in which there were low levels of residual conditioned responses, CR timing was more variable rather than consistently short latency. Similarly, GABAergic blockade in the cerebellar nuclei (which should disconnect input from both HVI and the anterior lobe) was followed by abolished CRs, but no reduction in CR latencies was observed as the drug took effect or wore off.
In accordance with Yeo's findings in incomplete lesions of HVI, CR timing parameters showed considerable variability that tended to be larger in the cerebellar patients compared with the controls. Changes in timing parameters were small and significant only based on findings in a large number of subjects in the short CS-US interval condition. CR timing was not significantly different in a smaller subgroup of patients and controls in a longer CS-US interval condition. The present findings in the short CS-US interval condition need to be confirmed in a larger group of cerebellar patients in the long CS-US interval condition.
One may argue that the slightly quicker responses seen are not cerebellum mediated but are an indication of how human patients attempt to cope with impaired cerebellar learning mechanisms. Although this possibility cannot be ruled out, small changes of CR onset latencies are consistent with other recent animal data. After sequential pharmacological inactivation of cortical output to deep nuclei, CR onset latency was on average shifted forward by 50 ms (Bao et al., 2002). Aksenov et al. (2004) also showed slightly shortened CR onset latencies in paired trials after application of small doses of a GABA receptor antagonist (picrotoxin) to the interposed nucleus (reduction of group mean CR onset latency from 227.5 ± 8.3 to 200.1 ± 11 ms, mean ± SE). Higher doses abolished CRs as a possible consequence of maximal disinhibition of nuclear neurons related to a normally tonic inhibitory activity of the cerebellar cortex.
Corresponding to animal findings of Perrett et al. (1993), VLSM analysis (Bates et al., 2003) revealed that CR onset was significantly earlier in patients with cortical lesions including parts of the ipsilateral anterior lobe, in particular lobule HV. Similarly, CR onset latency was shortened in SCA patients compared with controls but not in PICA patients. In a previous study, we had shown that CR incidences were reduced in SCA patients (affecting lobule Crus I and above) but not PICA patients (affecting Crus II and below) (Gerwig et al., 2003). Cortical areas of the superior cerebellum involved in temporal processing of conditioned eyeblink responses in humans, however, appear to be separated from those that are most important for the CS-US association. VLSM analysis revealed that CR incidence was significantly reduced in patients with focal lesions including superior parts of the posterior lobe, in particular lobule HVI. This is consistent with animal data of Yeo's group who found primarily abolished or markedly reduced CRs after HVI lesions (Yeo et al., 1985b; Hardiman and Yeo, 1992; Gruart and Yeo, 1995). Cortical areas of the anterior lobe may be involved in conditioned response timing and superior parts of the posterior lobe in CS-US association in humans. The present findings, however, do not exclude a role of the cerebellar nuclei in CS-US association.
The present findings agree with a previous human study in abstinent chronic alcoholics (McGlinchey-Berroth et al., 2002). In chronic alcoholics, lesions of the anterior cerebellar lobe are to be expected (Timmann and Diener, 2000). Using a temporal discrimination learning paradigm McGlinchey-Berroth et al. (2002) reported significantly earlier peak time latencies of CRs in alcoholic patients. No group effects were reported for CR onset. Similar to the present study, timing parameters were assessed in paired trials.
In contrast to the present findings, Woodruff-Pak et al. (1996) reported significantly slower CRs in cerebellar patients. Findings, however, were based on latencies of the first eyeblink after CS onset in paired trials, with this response being either the CR or the UR. Responses in cerebellar patients occurred on average later than US onset and therefore most likely represented URs rather than CRs.
Topka et al. (1993) also reported a tendency of CR onset latencies to be delayed in patients with degenerative cerebellar disorders. Findings, however, were based on the few CRs in unpaired trials. Effects were not statistically significant. In addition, 7 of the 12 cerebellar patients suffered from olivopontocerebellar atrophy, with lesions extending beyond the cerebellum. Because CS-alone trials were not presented, delayed CR onset latencies hidden by the UR in paired trials cannot be excluded in the present study.
In the present analysis, normalized CR amplitudes were enlarged in patients with SCA lesions compared with PICA patients and controls in paired trials. Increased amplitudes were most pronounced in SCA patients with pure cortical lesions. In animal studies, conversely, CR amplitudes were reported decreased after cortical lesions including the anterior lobe or lobule HVI (Hardiman and Yeo, 1992; Perrett et al., 1993). The present data need to be confirmed in a larger sample of patients with cortical lesions of superior parts of the cerebellar hemisphere. However, enhanced amplitudes of unconditioned eyeblink responses were found after lesions of lobule HVI in rabbits (Yeo et al., 1985b) and also in SCA patients with pure cortical lesions (Gerwig et al., 2004). Interestingly, timing parameters of unconditioned eyeblink responses in SCA patients were not altered. Findings suggest a role of the cerebellum specifically in timing of learned but not of unlearned eyeblink responses.
Conclusions
The present findings suggest that cortical areas of the superior cerebellum may be involved in timing of the conditioned eyeblink response in humans. Findings further suggest that cortical areas of the anterior cerebellar lobe are of particular importance in appropriate CR timing. Superior parts of the posterior lobe, particularly lobule HVI, appear to be involved in CS-US association. Thus, different cortical regions of the superior human cerebellum may be involved in response timing and stimulus association in eyeblink conditioning. Changes in CR timing, however, may equally be explained by extracerebellar premotoneuronal disinhibition. Furthermore, changes of CR timing were small and need to be confirmed in a larger group of cerebellar patients using different CS-US time intervals.
Footnotes
This study was supported by Deutsche Forschungsgemeinschaft Grant TI 239/7-1. We are grateful to the two expert reviewers for their helpful comments. We thank Beate Brol for help in eyeblink data analysis and preparation of the figures.
Correspondence should be addressed to Dr. Dagmar Timmann, Department of Neurology, University of Duisburg-Essen, Hufelandstrasse 55, D-45147 Essen, Germany. E-mail: dagmar.timmann@uni-essen.de.
Copyright © 2005 Society for Neuroscience 0270-6474/05/253919-13$15.00/0
References
- Aksenov D, Serdyukova N, Irwin K, Bracha V (2004) GABA neurotransmission in the cerebellar interposed nuclei: involvement in classically conditioned eyeblinks and neuronal activity. J Neurophysiol 91: 719-727. [DOI] [PubMed] [Google Scholar]
- Attwell PJ, Ivarsson M, Millar L, Yeo CH (2002) Cerebellar mechanisms in eyeblink conditioning. Ann NY Acad Sci 978: 79-92. [DOI] [PubMed] [Google Scholar]
- Bao S, Chen L, Kim JJ, Thompson RF (2002) Cerebellar cortical inhibition and classical eyeblink conditioning. Proc Natl Acad Sci USA 99: 1592-1597. [DOI] [PMC free article] [PubMed] [Google Scholar]
- Bates E, Wilson SM, Saygin AP, Dick F, Sereno MI, Knight RT, Dronkers NF (2003) Voxel-based lesions-symptom mapping. Nat Neurosci 6: 448-450. [DOI] [PubMed] [Google Scholar]
- Bloedel JR, Bracha V (1995) On the cerebellum, cutaneomuscular reflexes, movement control and the elusive engrams of memory. Behav Brain Res 68: 1-44. [DOI] [PubMed] [Google Scholar]
- Boneau CA (1958) The interstimulus interval and the latency of the conditioned eyelid response. J Exp Psychol 56: 464-471. [DOI] [PubMed] [Google Scholar]
- Bracha V, Zhao L, Irwin KB, Bloedel JR (2000) The human cerebellum and associative learning: dissociation between the acquisition, retention and extinction of conditioned eyeblinks. Brain Res 860: 87-94. [DOI] [PubMed] [Google Scholar]
- Buonomano DV, Mauk MD (1994) Neural network model of the cerebellum: temporal discrimination and the timing of motor responses. Neural Comput 6: 38-55. [Google Scholar]
- Christian KM, Thompson RF (2003) Neural substrates of eyeblink conditioning: acquisition and retention. Learn Mem 10: 427-455. [DOI] [PubMed] [Google Scholar]
- Christian KM, Poulos AM, Lavond DG, Thompson RF (2004) Comment on “Cerebellar LTD and learning-dependent timing of conditioned eyelid responses.” Science 304: 211. [DOI] [PubMed] [Google Scholar]
- Daum I, Schugens MM, Ackermann H, Lutzenberger W, Dichgans J, Bir-baumer N (1993) Classical conditioning after cerebellar lesions in humans. Behav Neurosci 107: 748-756. [DOI] [PubMed] [Google Scholar]
- Dimitrova A, Weber J, Redies C, Kindsvater K, Maschke M, Kolb FP, Forsting M, Diener HC, Timmann D (2002) MRI atlas of the human cerebellar nuclei. NeuroImage 17: 240-255. [DOI] [PubMed] [Google Scholar]
- Ebel HC, Prokasy WF (1963) Classical eyelid conditioning as a function of sustained and shifted interstimulus intervals. J Exp Psychol 65: 52-58. [DOI] [PubMed] [Google Scholar]
- Evans AC, Kamber M, Collins DL, MacDonald D (1994) An MRI-based probabilistic atlas of neuroanatomy. In: Magnetic resonance scanning and epilepsy (Shorvon S, Fish D, Andermann F, Bydder GM, Stefan H, eds), pp 263-274. New York: Plenum.
- Freeman Jr JH, Nicholson DA, Muckler AS, Rabinak CA, DiPietro NT (2003) Ontogeny of eyeblink conditioned response timing in rats. Behav Neurosci 117: 283-291. [DOI] [PubMed] [Google Scholar]
- Garcia KS, Mauk MD (1998) Pharmacological analysis of cerebellar contributions to the timing and expression of conditioned eyelid responses. Neuropharmacology 37: 471-480. [DOI] [PubMed] [Google Scholar]
- Gerwig M, Dimitrova A, Kolb FP, Maschke M, Brol B, Kunnel A, Boring D, Thilmann AF, Forsting M, Diener HC, Timmann D (2003) Comparison of eyeblink conditioning in patients with superior and posterior inferior cerebellar lesions. Brain 126: 71-94. [DOI] [PubMed] [Google Scholar]
- Gerwig M, Dimitrova A, Maschke M, Kolb FP, Forsting M, Timmann D (2004) Amplitude changes of unconditioned eyeblink responses in patients with cerebellar lesions. Exp Brain Res 155: 341-351. [DOI] [PubMed] [Google Scholar]
- Green JT, Ivry RB, Woodruff-Pak DS (1999) Timing in eyeblink classical conditioning and timed-interval tapping. Psychol Sci 10: 19-23. [Google Scholar]
- Gruart A, Yeo CH (1995) Cerebellar cortex and eyeblink conditioning: bilateral regulation of conditioned responses. Exp Brain Res 104: 431-448. [DOI] [PubMed] [Google Scholar]
- Hardiman MJ, Yeo CH (1992) The effect of kainic acid lesions of the cerebellar cortex on the conditioned nictitating membrane response in the rabbit. Eur J Neurosci 4: 966-980. [DOI] [PubMed] [Google Scholar]
- Ivry RB, Keele SW (1989) Timing functions of the cerebellum. J Cogn Neurosci 1: 136-152. [DOI] [PubMed] [Google Scholar]
- Koekkoek SK, Hulscher HC, Dortland BR, Hensbroek RA, Elgersma Y, Ruigrok TJ, De Zeeuw CI (2003) Cerebellar LTD and learning dependent timing of conditioned eyelid responses. Science 301: 1736-1739. [DOI] [PubMed] [Google Scholar]
- Linden DJ (2003) From molecules to memory in the cerebellum. Science 301: 1682-1685. [DOI] [PubMed] [Google Scholar]
- Manto MU, Pandolfo M (2002) The cerebellum and its disorders. Cambridge, UK: Cambridge UP.
- Mauk MD, Medina JF, Nores WL, Ohyama T (2000) Cerebellar function: coordination, learning or timing? Curr Biol 10: R522-R555. [DOI] [PubMed] [Google Scholar]
- McCormick DA, Thompson RF (1984) Cerebellum: essential involvement in the classically conditioned eyelid response. Science 223: 296-299. [DOI] [PubMed] [Google Scholar]
- McGlinchey-Berroth R, Fortier CB, Cermak LS, Disterhoft JF (2002) Temporal discrimination learning in abstinent chronic alcoholics. Alcohol Clin Exp Res 26: 804-811. [PubMed] [Google Scholar]
- Medina JF, Garcia KS, Mauk MD (2001) A mechanism for savings in the cerebellum. J Neurosci 21: 4081-4089. [DOI] [PMC free article] [PubMed] [Google Scholar]
- Papka M, Ivry RB, Woodruff-Pak DS (1995) Selective disruption of eyeblink classical conditioning by concurrent tapping. NeuroReport 6: 1493-1497. [DOI] [PubMed] [Google Scholar]
- Perrett SP, Ruiz BP, Mauk MD (1993) Cerebellar cortex lesions disrupt learning-dependent timing of conditioned eyelid responses. J Neurosci 13: 1708-1718. [DOI] [PMC free article] [PubMed] [Google Scholar]
- Ramnani N, Toni I, Josephs O, Ashburner J, Passingham RE (2000) Learning- and expectation-related changes in the human brain during motor learning. J Neurophysiol 84: 3026-3035. [DOI] [PubMed] [Google Scholar]
- Rorden C, Brett M (2000) Stereotaxic display of brain lesions. Behav Neurol 12: 191-200. [DOI] [PubMed] [Google Scholar]
- Schmahmann JD, Dojon J, Toga AW, Petrides M, Evans AC (2000) MRI atlas of the human cerebellum. San Diego: Academic. [DOI] [PubMed]
- Thompson RF, Bao S, Chen L, Cipriano BD, Grethe JS, Kim JJ, Thompson JK, Tracy JA, Weninger MS, Krupa DJ (1997) Associative learning. Int Rev Neurobiol 41: 151-189. [DOI] [PubMed] [Google Scholar]
- Timmann D, Diener HC (2000) Alcoholic cerebellar degeneration. In: Neurological ataxia (Klockgether T, ed), pp 571-606. New York: Dekker.
- Timmann D, Gerwig M, Maschke M, Kolb FP (2005) Eyeblink conditioning in patients with hereditary ataxia: a one year follow-up study. Exp Brain Res, in press. [DOI] [PubMed]
- Topka H, Valls-Sole J, Massaquoi SG, Hallett M (1993) Deficit in classical conditioning in patients with cerebellar degeneration. Brain 116: 961-969. [DOI] [PubMed] [Google Scholar]
- Trouillas P, Takayanagi T, Hallett M, Currier RD, Subramony SH, Wessel K, Bryer A, Diener HC, Massaquoi S, Gomez CM, Coutinho P, Ben Hamida M, Campanella G, Filla A, Schut L, Timann D, Honnorat J, Nighoghossian N, Manyam B (1997) International Cooperative Ataxia Rating Scale for pharmacological assessment of the cerebellar syndrome. The Ataxia Neuropharmacology Committee of the World Federation of Neurology. J Neurol Sci 145: 205-211. [DOI] [PubMed] [Google Scholar]
- Welsh JP, Harvey JA (1989) Cerebellar lesions and the nictitating membrane reflex: performance deficits of the conditioned and unconditioned response. J Neurosci 9: 299-311. [DOI] [PMC free article] [PubMed] [Google Scholar]
- Woodruff-Pak DS, Jaeger ME (1998) Predictors of eyeblink classical conditioning over the adult age span. Psychol Aging 13: 193-205. [DOI] [PubMed] [Google Scholar]
- Woodruff-Pak DS, Papka M (1996) Huntington's disease and eyeblink classical conditioning: normal learning but abnormal timing. J Int Neuropsychol Soc 2: 323-334. [DOI] [PubMed] [Google Scholar]
- Woodruff-Pak DS, Steinmetz JE (2000) Eyeblink classical conditioning, Vol II, Animal models. Boston: Kluwer Academic.
- Woodruff-Pak DS, Papka M, Ivry RB (1996) Cerebellar involvement in eyeblink classical conditioning in humans. Neuropsychology 10: 443-458. [Google Scholar]
- Yeo C, Hardiman MJ, Glickstein M (1984) Discrete lesion of the cerebellar cortex abolish the classically conditioned nictitating membrane response of the rabbit. Behav Brain Res 13: 261-266. [DOI] [PubMed] [Google Scholar]
- Yeo CH, Hesslow G (1998) Cerebellum and conditioned reflexes. Trends Cogn Sci 2: 322-330. [DOI] [PubMed] [Google Scholar]
- Yeo CH, Hardiman MJ, Glickstein M (1985a) Classical conditioning of the nictitating membrane response of the rabbit. I. Lesions of the cerebellar nuclei. Exp Brain Res 60: 87-98. [DOI] [PubMed] [Google Scholar]
- Yeo CH, Hardiman MJ, Glickstein M (1985b) Classical conditioning of the nictitating membrane response of the rabbit. II. Lesions of the cerebellar cortex. Exp Brain Res 60: 99-113. [DOI] [PubMed] [Google Scholar]