

Abstract
Neuronal activity regulates the synaptic strength of neuronal networks. However, it is still unclear how diminished activity changes connection patterns in neuronal circuits. To address this issue, we analyzed neuronal connectivity and relevant mechanisms using hippocampal cultures in which developmental synaptogenesis had occurred. We show that diminution of network activity in mature neuronal circuit promotes reorganization of neuronal circuits via NR2B subunit-containing NMDA-type glutamate receptors (NR2B-NMDARs), which mediate silent synapse formation. Simultaneous double whole-cell recordings revealed that diminishing neuronal circuit activity for 48 h increased the number of synaptically connected neuron pairs with both silent and functional synapses. This increase was accompanied by the specific expression of NR2B-NMDARs at synaptic sites. Analysis of miniature EPSCs (mEPSCs) showed that the frequency of NMDAR-mediated, but not AMPAR-mediated, mEPSCs increased, indicating that diminished neuronal activity promotes silent synapse formation via the surface delivering NR2B-NMDARs in mature neurons. After activation of neuronal circuit by releasing from TTX blockade (referred as circuit reactivation), the frequency of AMPAR-mediated mEPSCs increased instead, and this increase was prevented by ifenprodil. The circuit reactivation also caused an increased colocalization of glutamate receptor 1-specfic and synaptic NR2B-specific puncta. These results indicate that the circuit reactivation converts rapidly silent synapses formed during activity suppression to functional synapses. These data may provide a new example of homeostatic circuit plasticity that entails the modulation of neuron-neuron connectivity by synaptic activity.
Keywords: activity, connection, network, NMDA, synaptogenesis, surface delivery
Introduction
A single neuron generally receives multiple synaptic inputs from different neurons and processes these excitatory and inhibitory inputs, with temporal and spatial summation. The number of neurons with synaptic input to a single neuron and the plasticity of these connections are the most basic features underlying the construction of neuronal circuits and circuit plasticity. Neuronal activity is thought to be one of key factors to elucidate the mechanism. In the peripheral nervous system, a skeletal muscle fiber that is innervated by multiple motor neurons in early development stabilizes a single synaptic input by activity-dependent selection (for review, see Sanes and Lichtman, 1999). This type of synaptic selection is also observed in CNSs that develop between climbing fibers and Purkinje cells in the cerebellum (Mariani, 1983; Hashimoto and Kano, 2003) and retinogeniculate synapse (Chen and Regehr, 2000). The synaptic connections to one cell are, in general, selected to be a limited number of inputs and eliminated the others. In addition to these selective mechanisms, the activity-dependent increase in synaptic connections is also indispensable to maintain the brain function over the life. Accordingly, the bidirectional regulation might become important in the higher processing in the CNSs.
Previous studies have indicated that neuronal activity is essential for synaptic modifications and regulates both postsynaptic properties (Gomperts et al., 2000) and presynaptic properties (Bacci et al., 2001), as well as the postsynaptic localization of receptors (Rao and Craig, 1997) and spine densities (Papa et al., 1995). Several models have been proposed to explain the mechanisms governing the modulation of synaptic strength. One is Hebb's rule, which holds that coincident presynaptic and postsynaptic activity strengthens the excitatory transmission (Hebb, 1949; Bonhoeffer et al., 1989). An alternative model is homeostatic plasticity, by which globally increased or decreased network activity attenuates or enhances synaptic strengths, respectively (Turrigiano et al., 1998; Watt et al., 2000; Burrone et al., 2002; Desai et al., 2002). Homeostatic plasticity has been thought to adjust synaptic strength to maintain an appropriate dynamic range of synaptic response (for review, see Turrigiano and Nelson, 2000; Davis and Bezprozvanny, 2001; Burrone and Murthy, 2003). Although homeostatic synaptic plasticity is thought to stabilize neuronal circuit functions, it is still unclear whether the activity of neuronal circuits can modulate established neuron-neuron connections or influence the network structure of the circuit, for example, by promoting formation of new connections.
In this paper, we focus on the homeostasis of neuron-neuron connectivity in mature cultures of hippocampal neurons. Diminished activity-induced increase in the connectivity is accompanied by the surface delivery of NR2B subunit-containing NMDA-type glutamate receptors (NR2B-NMDARs) to form silent synapses. These synapses are subsequently converted to functional synapses by neuronal activation. Based on electrophysiological and histochemical results, we propose a novel mode of homeostatic plasticity in mature neuronal circuits.
Materials and Methods
Dissociated hippocampal culture. Hippocampi were dissected from embryonic day 18 Sprague Dawley rats and treated with 0.125% trypsin for 15 min at room temperature. The dissociated neurons were plated on polyethylenimine (0.01%; Sigma-Aldrich, St. Louis, MO)-coated glass coverslips (number 1 s; Matsunami, Osaka, Japan) at a density of 6 × 10⁴ cells/cm2. The neurons were first cultured in DMEM containing 5% fetal bovine serum and 5% horse serum with supplements of penicillin (50 U/ml), streptomycin (50 μg/ml), glutamine (1 mm), and insulin (50 μg/ml; Sigma-Aldrich). After 4 d in culture, cytosine 1-β-d-arabinofuranoside (2 μm; Sigma-Aldrich) was added for 24 h to inhibit proliferation of non-neuronal cells. The neurons were then maintained in DMEM containing 10% horse serum for up to 5 weeks. Half of the medium was changed twice weekly. For activity suppression experiments, neurons cultured longer than 18 d in vitro (DIV) were treated with the Na+ channel blocker tetrodotoxin (TTX) (1 μm; Wako Chemicals, Osaka, Japan). All chemicals for culture were purchased from Invitrogen (San Diego, CA), unless otherwise stated.
Solutions and statistics. Extracellular solution contained the following (in mm): 124 NaCl, 5 KCl, 30 glucose, 2 CaCl2, 1 MgCl2, 0.1 picrotoxin (PTX) (TCI, Tokyo, Japan), and 25 HEPES (Dojin, Kumamoto, Japan), unless otherwise stated. The pH was adjusted to 7.4 and the osmolarity to 320 mOsm. Solutions in patch pipettes contained the following (in mm): 110 Cs methanesulfonate, 10 CsCl2, 20 HEPES, 4 MgCl2, 10 EGTA-Cs, 0.3 GTP-Na3, and 4 mm ATP-Na2, pH 7.3. All chemicals for electrophysiological experiments were obtained from Wako Chemicals, unless otherwise stated.
Statistics were done using the Mann-Whitney U test or Wilcoxon's test. Data are presented as means ± SE.
Assay for synaptic connectivity and NMDAR currents. Whole-cell patch-clamp recordings were made at room temperature (22-25°C) using EPC8 patch-clamp amplifiers (Heka Elektronik, Lambrecht/Pfalz, Germany) or Multiclamp 700A (Axon Instruments, Union City, CA). Double whole-cell recording was performed to examine synaptic connectivity between neuron pairs. A first neuron was excited by depolarization (100 mV, 1 ms), and EPSCs were recorded at holding potentials of -60 or +40 mV in the second neuron. The converse experiment was also performed for each pair of neurons, with depolarization of the second neuron and measurement of EPSCs in the first neuron.
To record NMDAR-mediated whole-cell currents (NMDAR currents), NMDA (20 μm; Tocris Cookson, Bristol, UK) was applied to neurons with the pressure-application system (Pico pump; World Precision Instruments, Sarasota, CA) using a patch pipette with an ∼3-μm diameter tip in Mg2+-free extracellular solution containing TTX (1 μm) and CaCl2 (1 mm). Pressure was adjusted to as low as possible to record constant NMDAR currents and kept constant during each experimental series. NR2B-NMDAR-mediated currents were calculated by subtracting ifenprodil-insensitive NMDAR currents, recorded with ifenprodil (1 μm; Tocris Cookson)-containing solution, from total NMDAR currents, which were recorded before ifenprodil treatment. Representative NMDAR currents were averaged for at least five sweeps and processed using Clampfit 9 software (Axon Instruments).
To activate neuronal circuits, TTX-treated neurons were washed and transferred to extracellular solution for 30 min at room temperature. Neurons were then assayed for miniature EPSCs (mEPSCs) and subjected to immunocytochemical analysis.
Assay for synaptic and nonsynaptic NMDARs. To evaluate the ratio of synaptic to whole-cell NMDARs, synaptically activated NMDARs were use dependently blocked with MK-801 [(+)-5-methyl-10,11-dihydro-5H-dibenzo [a,d] cyclohepten-5,10-imine maleate] (5 μm; Tocris Cookson). Two protocols for synaptic activation were used. In the first, presynaptic firing-dependent synaptic transmission caused by autonomous circuit activity was monitored in normal extracellular solution with the current-clamp mode of whole-cell recording. In the second, synaptic transmission was monitored in Mg2+-free extracellular solution containing TTX (1 μm) with the voltage-clamp mode (-60 mV holding potential). In both protocols, glutamate released from presynaptic termini could activate synaptic NMDARs, and the activated NMDARs were irreversibly blocked by MK-801, whereas extrasynaptic NMDARs remained intact. The former protocol evaluated NMDARs activated by circuit activity. The latter evaluated NMDARs activated by a quantal release of glutamate that was independent from circuit activity. After MK-801 treatment, the blocker was completely washed out, and total NMDAR currents were then reexamined in the same cell. The ratio was calculated from the NMDAR currents before and after MK-801 treatment. In these experiments, neurons were pretreated with genistein (50 μm; Sigma-Aldrich) to block NMDAR current rundown (Vissel et al., 2001).
To analyze dual-component mEPSCs, spontaneous synaptic events were recorded in Mg2+-free extracellular solutions containing TTX (1 μm) and glycine (10 μm). NMDAR components of mEPSCs were blocked by ifenprodil (4 μm) and then d,l-aminophosphonovalerate (APV) (100 μm). The mEPSCs were detected by the criterion of a fast rise time (within 5 ms) and analyzed rise, decay time, and amplitude with the MINI ANALYSIS software program (Synaptosoft, Decatur, GA).
Assay of NMDARs delivered to the neuron surface. To assay the surface delivery of NMDARs, all NMDARs initially at the cell surface membrane were blocked by coapplication of NMDA (10 μm) and MK-801 (10 μm) for 5 min. The treated neurons were carefully washed with culture medium and returned to the incubator, and culturing was continued with or without TTX. After 2 d, newly surface-expressed NMDARs were examined by NMDA application.
Cell counting and immunocytochemistry. Neurons cultured on glass coverslips were fixed in 4% paraformaldehyde in PBS- containing 4% sucrose (15 min) and further fixed and permeabilized in methanol (-20°C) for 5 min. For cell counting, fixed neurons were imaged with Hoffman modulation contrast microscopy (Modulation Optics, Greenvale, NY) using 10× objective lens and captured with cooled CCD camera (CoolSNAP HQ; Photometrics, Huntington Beach, CA). Pyramidal neurons were manually counted at least for 10 objective fields (0.6 mm2/objective field) for each series of experiments. In some experiments, pyramidal neurons were confirmed with immunostaining with antimitogen-activated protein 2 (MAP2) antibody (Sigma-Aldrich). To reveal neuronal density change during culture, double-positive cells with MAP2 immunostaining and Hoechst 33258 were counted with MetaMorph software (Universal Imaging Corporation, West Chester, PA). For immunochemistry, neurons were then washed with PBS- and blocked in PBS- containing 2% BSA and 2% goat serum for 1-2 h at room temperature. Primary antibodies were incubated for 1-2 h at room temperature in blocking solution. The primary antibodies used were as follows: 1:200 rabbit anti-NR2B subunit (Molecular Probes, Eugene, OR); 1:200 mouse anti-NR2B subunit (PharMingen/Becton Dickinson, San Diego, CA); 1:200 rabbit anti-NR2A subunit (Chemicon, Temecula, CA); 1:1000 rabbit anti-synapsin1 (Chemicon); 1:1000 mouse anti-synaptophysin (clone SVP-38; Sigma-Aldrich); 1:2000 rabbit anti-glutamic acid decarboxylase-65 (GAD65) (Sigma); 1:200 anti-rabbit glutamate receptor 1 (GluR1) subunit (Chemicon); 1:200 anti-rabbit GluR2 subunit (Chemicon); and 1:1000 anti MAP2. After incubation with primary antibodies, the neurons were washed extensively in PBS- and incubated for 20 min with fluorescent secondary antibody conjugates (goat anti-mouse or goat anti-rabbit, Alexa 488 at 1:2000, or Alexa 564 at 1:2000; Molecular Probes). For triple staining, anti-synaptophysin antibodies directly labeled with Alexa 647 (Alexa Fluor 647 monoclonal antibody labeling kit; Molecular Probes) were used.
For comparisons of immunofluorescent synaptic proteins, sister-cultured neurons were used for control and conditioned and stained concurrently under the same conditions including antibody concentrations and incubation time. After embedding with PermaFluor (Thermo Electron Corporation, Woburn, MA), fluorescent images were acquired with a cooled CCD camera (CoolSNAP HQ) with a Nipkow disk-based confocal scanning unit (CSU-10; Yokogawa, Tokyo, Japan) mounted on an inverted microscope (IX70; Olympus Optical, Tokyo, Japan) with 100× objectives for determining colocalization of synaptic molecules. Illumination intensity (laser power, argon-krypton, 60 mW at optical fiber input), exposure time, and CCD camera gain were kept constant during a series of recordings. Acquired images were analyzed using MetaMorph software or NIH ImageJ. Immunofluorescent images of synaptophysin-, GAD65-, MAP2-, NR2A-, NR2B-, GluR1-, and GluR2-specific signals were processed to binary images with arbitrary threshold values for each antibody, and the threshold values were applied on control and TTX-treated samples. For colocalization analysis of synaptophysin, NR2B, and GluR1 or GluR2, logical summation (logical AND) was first done with binary synaptophysin and NR2B images. Then, the logical AND image was multiplied on the NR2B raw image, and the resulting image (synaptic NR2B image) was analyzed for puncta number and intensity as synaptic NR2B puncta by “integrated morphometry analysis” with MetaMorph software. The logical AND image for synaptophysin and NR2B was further logically multiplied on the binary image of GluR1 or GluR2, and the resulting binary image was multiplied on the GluR1 or GluR2 raw image. Synaptic NR2B accompanying no GluR1 (regarded as a silent synapse) was calculated by logical multiplying binarized GluR1-negative images and synaptic NR2B images. Furthermore, these images were also analyzed by integrated morphometry analysis in MetaMorph software. To reduce noise contamination, synaptic puncta obtained from these immunofluorescent images were limited to have 0.016 μm2 area.
Results
The maturation of neuronal circuits in hippocampal neurons requires 18 d
NR2B-NMDARs are known to be the major NMDAR in immature neurons and to decrease in abundance with development (Hestrin, 1992; Tovar and Westbrook, 1999). The maturation of neuronal circuits in cultured hippocampal neurons was initially investigated using two parameters, the ratio of NR2B-NMDARs to whole-cell NMDARs and the firing rate in neuronal circuits. In this culture system, synaptic currents mediated by NR2B-NMDARs in pyramidal neurons decreased gradually with the number of days in vitro, eventually reached a low stationary level at 18 DIV (∼20% of the total NMDAR current) (Fig. 1A). The firing rate, in contrast, increased and reached a plateau (Fig. 1B). Neuronal density were also decreased during first 2 weeks and reached a stationary level before 18 DIV (Fig. 1C).
Figure 1.

Developmental changes in the subunit composition of NMDARs and neuronal circuit activity in hippocampal culture. A, Ifenprodil-sensitive NMDAR currents. To determine the proportion of ifenprodil-sensitive currents, whole-cell currents mediated by NMDARs were recorded without drugs and with the sequential addition of ifenprodil and APV (n = 5). B, Firing rate in hippocampal pyramidal neurons. Spontaneous neuronal firings were monitored by the cell-attached mode of patch-clamp recording for 3 min (n = 4 series of experiments). C, Neuronal density in culture. Neuronal densities were obtained by counting Hoechst 33258 and MAP2 double-positive cells over 10 objective fields (0.15 mm2) in each series of culture. Mean data are plotted from four independent series of culture.
To examine excitatory synaptic connectivity during development, double whole-cell recordings were performed on neurons at 4, 10, and 21 DIV. Synaptically connected neuron pairs were not found at 4 DIV (zero of six pairs of neurons), and 59.2 ± 0.5% of paired neurons were connected at 10 DIV (four series of culture, 10-12 pairs of neurons in each series.). Neuronal connectivity, however, decreased to 38.2 ± 1.3% at 21 DIV (three series of culture, 10-18 pairs of neurons in each series). These results show that neuronal connectivity increases initially and decreases during development, whereas cell density decreased during the first 2 weeks and reached a steady state before 18 DIV (four series of cultures) (Fig. 1C). Based on our results and others (Passafaro et al., 2003), we regard the neuronal circuits in our cultured neurons as the completion of developmental synaptogenesis, entering a stationary state at ∼18 DIV.
Suppression of neuronal activity increases neuron-neuron connectivity
To determine whether diminution of neuronal activity influences neuron-neuron connectivity in mature neuronal circuits, the connectivity between neurons at 18 DIV was assessed, after circuit activity was suppressed by the Na+ channel blocker TTX (1 μm, 48 h) in vitro. Double whole-cell recordings were made of paired pyramidal neurons 100 μm apart (10 series of cultures, with a total of 175 control and 201 TTX-treated neuron pairs). Because polysynaptic responses or spontaneous bursting activity occurred during the recordings, we carefully inspected EPSCs to determine whether connections were monosynaptic or polysynaptic. We designated synaptic pairs, in which the synaptic delay was under 5 ms and stable during recording, as having monosynaptic connections. When a synaptic response was detectable at both holding potentials (-60 and +40 mV), the connection was classified as functional (Fig. 2C, left). Conversely, when responses were detected only at +40 mV, the connection was classified as silent (Fig. 2C, right). The connectivity of TTX-treated neurons increased 247% of untreated control neurons (TTX-treated, 65.5 ± 4.7%; control, 26.5 ± 4.7%; n = 10 series; p < 0.01) (Fig. 2B). The silent and functional connections also increased up to 272 and 240%, respectively, in TTX-treated neurons compared with untreated neurons (control, 8.40 ± 1.7 and 18.4 ± 2.8%; TTX treated, 22.9 ± 2.7 and 44.3 ± 5.5%, for silent and functional connections, respectively; n = 10 series; p < 0.01) (Fig. 2B). These results indicate that the suppression of circuit activity enhances neuron-neuron connectivity. Although the waveforms should be analyzed to determine which receptors participate in synaptic transmission in the treated neurons, the presence of contaminating polysynaptic and spontaneous synaptic currents in response to evoked EPSCs complicates this analysis. For synaptically connected pairs free of this contamination, which were a minor population, the silent connections were completely blocked by a low dose (1 μm) of ifenprodil (five of five) (Fig. 2C, right), indicating that at least these silent synapses were composed of NR2B-NMDARs.
Figure 2.

Effect of diminished activity on neuron-neuron connectivity. A, Representative double whole-cell recordings in cultured hippocampal pyramidal neurons at 18 DIV. Neuron-neuron connectivity in control (Ctrl) and TTX-treated (TTX) neurons is shown. Total synaptic connectivity (the ratio of paired neurons connected by silent and functional synapses to total recorded paired neurons) was measured by double whole-cell recording (B, left). Silent synaptic connectivity and functional synaptic connectivity (B, middle and right) were also measured. Both silent and functional synaptic connections were increased 270 and 240%, respectively, by TTX treatment (12 series of experiments; **p < 0.05). C, Representative double whole-cell recordings of paired neurons with functional (left, pre) and silent (right, post) synaptic connections in TTX-treated neurons. Each trace is an average of five successive responses from a stimulated presynaptic and postsynaptic neuron at -60 or +40 mV holding potentials. EPSCs in silent connections at +40 mV holding potential were completely blocked by 1 μm ifenprodil.
The increase in neuronal connectivity after TTX treatment might be accounted for by three possibilities: a decrease in cell density, synapse formation with new partner neurons, or an increase in transmitter release probability. To access the first possibility, we examined neuronal density. Although absolute cell densities were varied among series of experiments, TTX treatment had no significant effects on cell survival in each experiment (six series of experiments; averaged cell density, control, 159.7 ± 30.8 neurons/mm2; TTX treated, 156.9 ± 29.4 neurons/mm2; 10 objective field of 0.15 mm2 per each experiment) (Fig. 3A). With respect to synapse formation, immunostaining for detecting a presynaptic marker protein revealed that TTX treatment significantly increased the number, not size, of synaptophysin-positive presynaptic termini (number: control, 3.51 ± 0.21 × 10⁴/mm2; TTX treated, 4.03 ± 0.19 × 10⁴/mm2; n = 51 from 3 experiments; p < 0.05; area: control, 1.99 ± 0.15 μm2; TTX treated, 2.10 ± 0.18 μm2; n = 51 from 3 experiments; p = 0.922) (Fig. 3C). Coimmunostaining of the marker protein GAD65, a membrane-anchored enzyme and marker for GABAergic synaptic termini (Fig. 3B), showed the number of inhibitory synaptic terminus and could estimate relatively the number of excitatory synaptic terminus, because major excitatory and inhibitory synapses are glutamatergic and GABAergic synapses in hippocampal neuron, respectively. There were no significant changes in the number of GABAergic synapses, indicating that the relative abundance of excitatory synaptic termini was increased by TTX treatment (total number of synapses, control, 52.3 ± 1.4%; TTX treated, 61.7 ± 1.9%; n = 51 from 3 experiments; p < 0.001) (Fig. 3Bb). To further examine the excitatory synapse number, synaptic puncta along dendrites were counted (control, 25.2 ± 1.6; TTX, 34.5 ± 1.6; n = 35 segments of 50 μm dendrite from 10 neurons; p < 0.001) (Fig. 3Bc). This result also indicates that the number of excitatory synapse was increased by TTX treatment.
Figure 3.
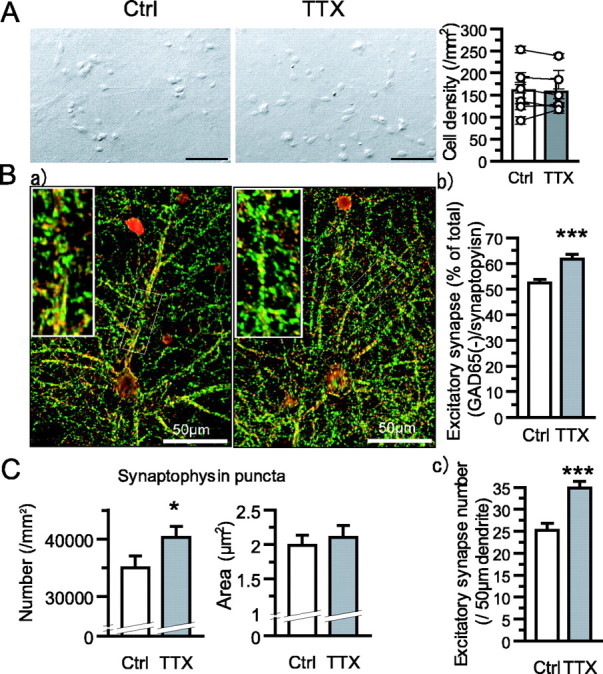
Effects of diminished activity on neuronal and synaptic density. A, Representative images of control (left, Ctrl) or TTX-treated (right, TTX) neurons. Scale bar, 20 μm. Comparisons of mean neuronal density in each experiment are in a scatter plot, and averaged data of six experiments are presented in a bar plot. B, Representative images of double staining with synaptophysin (green) and GAD65 (red) antibodies. Inset, Magnified images of boxed area in the original images. Double-positive immunofluorescent puncta containing synaptophysin and GAD65 were regarded as GABAergic synaptic termini, and the remaining synaptophysin immunofluorescent puncta were evaluated as excitatory synaptic termini (b; control, 52.3 ± 1.4% of total number of synapse; TTX treated, 61.7 ± 1.9%; n = 51 from 3 experiments; p < 0.001). c, The examinations were limited in dendritic region (control, 25.2 ± 1.6; TTX, 34.5 ± 1.6; n = 35 segments of 50 μm dendrite from 10 neurons; p < 0.001). C, Property of synaptophysin puncta. Mean number and area of puncta are plotted (number: control, 3.51 ± 0.21 × 10⁴ synapses/mm2; TTX treated, 4.03 ± 0.19 × 10⁴/mm2; n = 51 from 3 experiments; p < 0.05; size: control, 1.99 ± 0.15 μm2; TTX treated, 2.10 ± 0.18 μm2; n = 51 from 3 experiments; not significant).
To address the possibility that transmitter release was altered, the properties of excitatory synapse transmission were analyzed. When TTX treatment increased the amplitude of AMPAR-mediated EPSCs (AMPAR-EPSCs) of functional connections (control, 66.5 ± 12.3 pA, n = 22 pair neurons; TTX, 100.6 ± 29.1 pA, n = 25; p < 0.05) (Fig. 4A), the same treatment increased a value of the inverse of the square of coefficient variation (1/CV2) of AMPAR-EPSC amplitude. Given that synaptic transmission follows a binomial process, the value of 1/CV2 is the product of n and p/(1 - p), where n is the number of synaptic sites, and p is the release probability. The increase in 1/CV2 indicates that TTX treatment increases the number of synaptic sites and/or the release probability, independent of quantal size (Faber and Korn, 1991; Kullmann, 1994; Selig et al., 1995). Additional analyses of AMPAR-mEPSCs recorded at -60 mV holding potential revealed significant increases in the amplitude but not in the frequency (Fig. 4B) (see Fig. 8A,B). Increased quantal size by activity suppression has also been observed in cortical cultures (Turrigiano et al., 1998; Watt et al., 2000). Considering these results, TTX treatment induces an increase at least in quantal size of single functional synaptic site. Although both parameters, the frequency of AMPAR-mEPSCs and 1/CV2, are dependent on both release probability and number of synaptic site, the changes of parameters by activity suppression was not consistent. The discrepancy was remained.
Figure 4.

Increase in EPSC amplitude and 1/CV2 in TTX-treated neurons. A, Averaged amplitude (left) and 1/CV2 (right) of evoked AMPAR-mediated EPSCs in control (Ctrl) and TTX-treated (TTX) neurons (22 control pairs, 25 TTX-treated pairs; *p < 0.05). B, Averaged amplitude and frequency of mEPSCs in control and TTX-treated neurons. Spontaneous mEPSCs were aligned with the onset of rising phase of events and averaged (72 control and 61 TTX-treated neurons; *p < 0.05). Note that a significant difference is observed in the amplitude but not in the frequency.
Figure 8.
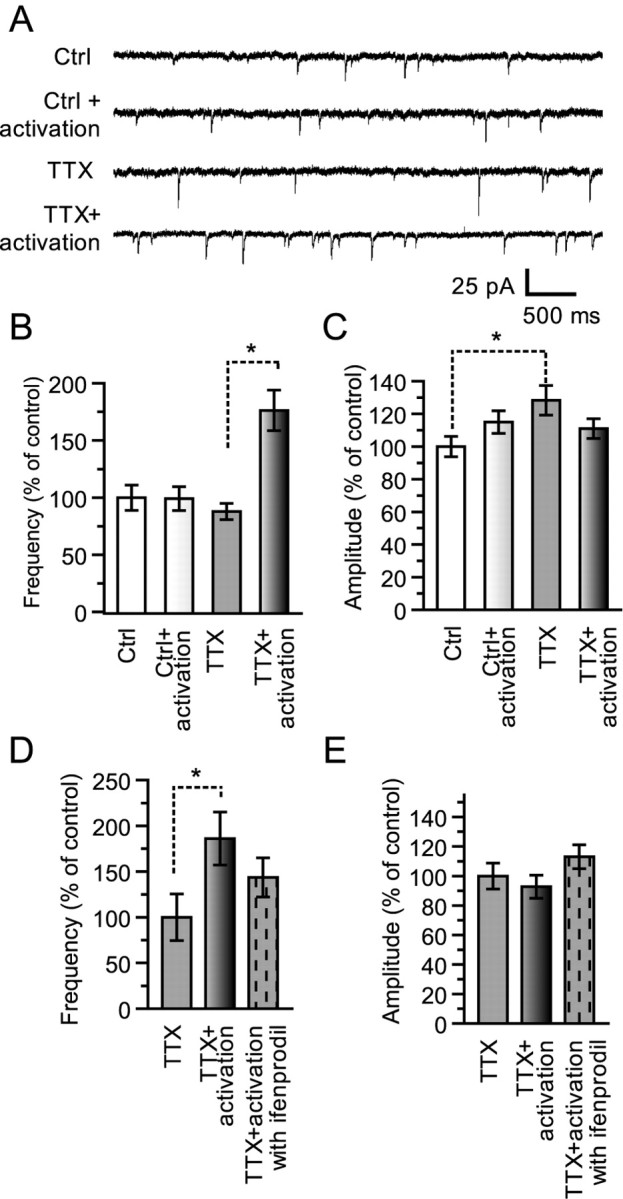
Rapid increase of AMPAR-mEPSCs by circuit reactivation in TTX-treated neurons. A, Representative traces of AMPAR-mEPSCs in each condition. Ctrl, Control neurons; TTX, TTX-treated neurons. B, Analysis of AMPAR-mEPSC frequency in control and TTX-treated neurons with or without circuit activation. Circuits were activated by washing out TTX and incubating neurons in extracellular solution with PTX (100 μm) for 30 min. Although TTX treatment did not increase the AMPAR-mEPSC frequency, circuit reactivation rapidly caused an increase in the frequency (Ctrl, 100.0 ± 11.0%, n = 27; Ctrl + activation, 99.2 ± 10.4%, n = 29; TTX, 87.9 ± 7.0%, n = 25; TTX + activation, 176.4 ± 17.8%, n = 33; *p < 0.05). C, Plot of the effects of circuit reactivation on the amplitude of AMPAR-mEPSCs. A significant increase in the amplitude is observed for TTX-treated neurons (Ctrl, 100.0 ± 6.2%, n = 27; Ctrl + activation, 115.0 ± 6.9%, n = 29; TTX, 128.4 ± 9.1%, n = 25; TTX + activation, 111.0 ± 6.1%, n = 33; *p < 0.05). D, E, Effect of ifenprodil on the AMPAR-mEPSC increase induced by circuit activation. The NR2B-NMDAR antagonist ifenprodil (4 μm) was included during circuit reactivation. Ifenprodil prevented the increase in AMPAR-mEPSC frequency (TTX, 100.0 ± 25.5%, n = 9; TTX + activation, 186.1 ± 28.9%, n = 10; TTX + activation with ifenprodil, 143.6 ± 21.4%, n = 16).
Diminished neuronal activity increases NR2B-NMDARs
The increase in silent synaptic connections induced by TTX treatment of mature neurons, in which NR2B-NMDAR-mediated currents decreased to a low stationary level (Fig. 1B), suggests that these receptors were being reexpressed. It has been shown that silent synapses formed at immature neurons consist of NR2B-NMDARs (Lu et al., 2001). The activity-dependent reexpression of NR2B-NMDARs has also been reported in cultured chick cerebrum neurons (Kiyosue et al., 2004). Ifenprodil-sensitive NMDAR currents increased significantly in TTX-treated neurons (52.1 ± 3.7%, average of 17 series of cultures, with a total of 57 neurons) compared with untreated neurons (20.8 ± 6.1%, average of 17 series of cultures, 54 neurons; p < 0.05) (Fig. 5B), indicating that NR2B-NMDARs are the predominant NMDAR population on the surface of TTX-treated neurons, although their functional contribution to NMDAR currents is relatively low at 18 DIV under control conditions. To further confirm the reexpression of NR2B-NMDARs, we performed an immunofluorescence study. The density of NR2B-specific, but not of NR2A-specific, immunofluorescent puncta was significantly increased in TTX-treated neurons (NR2A puncta/mm2: control, 13.4 ± 1.1 × 10⁴; TTX treated, 11.8 ± 0.7 × 10⁴; n = 11; NR2B puncta/mm2: control, 6.7 ± 1.6 × 10⁴; TTX treated, 17.2 ± 1.7 × 10⁴; n = 10; p < 0.01) (Fig. 5C). These data indicate strongly that the increase in functional NR2B-NMDARs is attributable to the expression of the NR2B subunit and not to a relative decrease in the NR2A subunit.
Figure 5.

Reexpression of NR2B-NMDARs and their participation in synaptic function induced by diminished neuronal activity. A, Representative traces of NMDA currents with (dotted line) or without (thick line) ifenprodil in control (Ctrl) and TTX-treated (TTX) neurons. B, Mean ifenprodil sensitivity of NMDA currents in control and TTX-treated neurons (Ctrl, 20.8 ± 6.1%, n = 17; TTX, 52.1 ± 3.7%, n = 17; *p < 0.05). C, Analysis of immunofluorescence of NR2 subunits. NR2A and NR2B subunits were stained with specific antibodies. Immunofluorescent puncta densities for NR2A (left) and NR2B (right) are plotted for each condition (NR2A: control, 13.4 ± 1.1 × 10⁴ puncta/mm2; TTX treated, 11.8 ± 0.7 × 10⁴ puncta/mm2; n = 11; NR2B: control, 6.7 ± 1.6 × 10⁴ puncta/mm2; TTX treated, 17.2 ± 1.7 × 10⁴ puncta/mm2; n = 10; p < 0.01). D, Experimental protocol for assaying the ratio of synaptic and extrasynaptic NMDARs. First, NMDA was applied to the soma and dendritic region of neurons to evaluate surface-expressed NMDARs (NMDA test pulse). Next, the neurons were treated with MK-801, a powerful reagent that blocks activated NMDARs. During treatment, neuronal synapses were allowed to be activated by presynaptically released glutamate during spontaneous neuronal firing (left) or by quantal released glutamate without cell firing (right; recorded in TTX- and Mg2+-free solution). The amount of synaptic NMDARs was estimated as the proportion of NMDAR currents blocked by MK-801, whereas extrasynaptic NMDARs were unblocked currents. NMDAR currents are plotted as a function of treatment time with MK-801. The synaptic NMDARs activated by spontaneous synaptic transmission were blocked with a similar time course in both control (5.56 ± 0.60% of level before MK-801 treatment; n = 8) and TTX-treated (4.74 ± 0.97% of level before MK-801 treatment; n = 8) neurons. Quantal released glutamate also blocked most NMDARs within 10 min of MK-801 treatment (control, 25.6 ± 6.8% of level before treatment, n = 6; TTX-treated, 28.7 ± 4.8% of level before treatment; n = 7).
Surface NMDARs function as synaptic receptors in neurons cultured longer than 18 DIV
Although the ratio of NR2B-NMDARs to whole-cell surface NMDARs increased, the ratio of synaptic to extrasynaptic NMDARs was unknown. To determine this value, synaptic NMDARs were selectively blocked by MK-801, which acts as an “irreversible” open channel blocker (Huettner and Bean, 1988). In the presence of MK-801, synaptic NMDARs were blocked at the moment of spontaneous release of glutamate. Comparing NMDAR currents before and after MK-801 treatment revealed that NMDAR blockade under spontaneous network activity was progressively observed and completed within 10 min (n = 8) (Fig. 5D, left). It was possible that the amount of synaptic NMDARs was an overestimate, because cell firing with bursting would cause an unusual diffusion of the released glutamate from the synaptic cleft. To avoid this possibility, an alternative protocol, which activates synaptic NMDARs by spontaneous, quantal transmitter release in the presence of TTX, was used during MK-801 treatment. After treatment, NMDAR currents were reduced to ∼20% (control, n = 6; TTX, n = 7) (Fig. 5D, right), indicating that at least 80% of NMDARs acted as synaptic NMDARs in neurons at this stage, although NR2B-NMDARs reside in the extrasynaptic area of mature neurons (Li et al., 1998; Tovar and Westbrook, 1999). No significant difference in MK-801 sensitivity was observed between TTX-treated and untreated neurons, indicating that not only preexisting but also most reexpressed NMDARs on the neuronal surface function as synaptic receptors in the neurons cultured longer than 18 DIV.
Diminished neuronal activity promotes NR2B-NMDAR-specific delivery to the cell surface
The activity-dependent incorporation and removal of AMPARs at a synaptic site directly influences the amplitude of synaptic transmission (Nishimune et al., 1998) (for review, see Bredt and Nicoll, 2003; Malenka, 2003). Because the subunit composition of NMDARs on the neuronal surface was shown to be changed by activity suppression, the mechanism of this change became of interest (Hoffmann et al., 2000; Philpot et al., 2001; Kiyosue et al., 2004). To determine whether NR2B-NMDARs were incorporated into or other NMDARs were removed from synaptic sites, all cell-surface NMDARs were blocked by administration of NMDA (10 μm) and MK-801 (10 μm) before TTX treatment. This treatment blocked completely NMDAR currents induced by NMDA application (data not shown). After MK-801 was removed by washing, the neurons were cultured for 2 d in the presence of TTX. In a control experiment, only a low level of NMDA current was induced by NMDA application (2.88 ± 0.34 × 10⁻¹⁰ C; n = 9), of which only 22% was ifenprodil sensitive (0.64 ± 0.13 × 10⁻¹⁰ C; n = 9) (Fig. 6B). In contrast, a high level of NMDAR current was observed in TTX-treated neurons (4.77 ± 0.30 × 10⁻¹⁰ C; n = 23) (Fig. 6B), and 63% of the receptors was blocked by ifenprodil (ifenprodil-sensitive currents, 2.99 ± 0.30 × 10⁻¹⁰ C; n = 23). These data indicate that TTX treatment selectively enhances the incorporation of NR2B-NMDARs at the neuronal surface compared with non-NR2B-NMDARs (Fig. 6C).
Figure 6.

Subunit-specific surface delivery of NMDA receptors. A, Representative traces of surface-delivered NMDAR-mediated currents with (dotted line) or without (thick line) ifenprodil after 2 d of TTX treatment. The neurons were pretreated with both MK-801 and NMDA to block all NMDARs expressed at the neuronal surface. B, Total NMDA currents in each control (Ctrl) and TTX-treated (TTX) neurons were measured before and after the addition of ifenprodil. Averaged data are indicated in bars (Ctrl, 2.88 ± 0.37 × 10⁻¹⁰ C, n = 14; Ctrl + ifenprodil, 2.24 ± 0.31 × 10⁻¹⁰ C, n = 14; TTX, 4.77 ± 0.30 × 10⁻¹⁰ C, n = 11; TTX + ifenprodil, 1.78 ± 0.22 × 10⁻¹⁰ C, n = 11). C, Subunit typing of surface-delivered NMDARs. NR2B-NMDAR- and non-NR2B-NMDAR-mediated currents were determined in control and TTX-treated neurons (Ctrl, n = 9; TTX, n = 23; *p < 0.05).
Surface-delivered NR2B-NMDARs act at silent synapses
To determine whether the newly delivered NR2B-NMDARs were incorporated into mature functional synapses to modulate their function and/or newly formed silent synapses, we examined NMDAR components in mEPSCs. Because mature glutamatergic synapses are, in general, composed of both AMPARs and NMDARs and generate dual-component EPSCs, mEPSCs containing AMPAR-mediated first rising components were analyzed as mature synaptic currents. The mEPSCs were recorded serially from a neuron in the presence of ifenprodil (4 μm), APV (100 μm), or no drug, and then mature mEPSCs were selected and averaged. Although a slight blockade by ifenprodil of the slow component of mature mEPSCs was observed in TTX-treated or control neurons, there was no significant blockade (Fig. 7A,B). APV blockade of the slow component of mature mEPSCs ensured that this analysis was sufficient for detecting NMDAR mediating slow component of EPSCs. However, because the sensitivity of detection depended in part on the population of synaptic types, these results indicate that NR2B-NMDARs do not act in functional, mature synapses, and/or do not constitute a major population at a synapse, or that NR2B-NMDAR-containing synapses are a minor population among mature synapses.
Figure 7.

NR2B-NMDARs act at silent but not at functional synapses in TTX-treated neurons. A, Representative mEPSCs recorded at -60 mV holding potential from control (Ctrl, left traces) and TTX-treated (TTX, right traces) neurons. The second and third traces were obtained in the presence of 1 μm ifenprodil and 100 μm APV, respectively. Bottom, Representative traces for BotxA-treated (BotxA) neurons, showing the absence of miniature synaptic events. B, Plot of decay time versus amplitude of mature mEPSCs. Ifenprodil (4 μm) and APV (100 μm) sensitivities of mEPSCs are indicated in the second and third rows, respectively. Cumulative plot of decay time of mEPSCs is indicated in the bottom row, showing that NR2B-NMDARs do not make a major contribution to mEPSCs. C, Fluctuations of membrane currents from control (Ctrl), TTX-treated (TTX), and TTX plus BotxA-treated (TTX + BotxA) neurons. Note that the fluctuation of membrane currents in TTX-treated neurons is significantly larger than in Ctrl (**p < 0.01) and TTX + BotxA (*p < 0.05) neurons.
The fluctuation of membrane currents under Mg2+-free conditions was found to increase in TTX-treated neurons compared with controls (average SD of membrane currents in TTX-treated neurons, 3.23 ± 0.24 pA, n = 20; control neurons, 2.05 ± 0.15 pA, n = 10; p < 0.05) (Fig. 7C). Furthermore, ifenprodil significantly reduced fluctuations in TTX-treated neurons (78.6 ± 3.0%; n = 5) compared with untreated neurons (52.5 ± 6.9%; n = 4; p < 0.05), indicating that they were attributable to NR2B-NMDARs. To confirm whether the fluctuations originated from synaptically released glutamate, neurons were treated with botulinum toxin A (BotxA) (100 ng/ml), a potent inhibitor of glutamate release from presynaptic termini, for 1 h before recording. BotxA clearly blocked fluctuations in TTX-treated neurons (BotxA treated, 2.25 ± 0.74 pA; n = 8) (Fig. 7C), indicating that the NR2B-NMDAR-mediated membrane fluctuation was generated by numerous overlapping NMDAR-mediated mEPSCs in TTX-treated neurons. Considering that there were no changes in the frequency in AMPAR-mEPSCs and increase in 1/CV2 of evoked AMPAR synaptic transmission in TTX-treated neurons (Fig. 4), surface-expressed NR2B-NMDARs contributed to an increase in the number of silent synaptic sites rather than an increase in the number of mature synapses.
In addition to the electrophysiological data, immunocytochemical experiments were performed by triple staining with anti-NR2B, anti-synaptophysin, and anti-GluR1 antibodies to examine whether NR2B-NMDARs were delivered to immature silent synapses or to mature functional synapses (see Fig. 9A). Immunofluorescent analysis (see Materials and Methods) revealed that the number of NR2B subunit-specific puncta colocalizing with the presynaptic protein synaptophysin (synaptic NR2B) increased in TTX-treated neurons (control, 23.9 ± 3.0% of total synapse number, n = 10; TTX, 36.6 ± 3.8, n = 11; *p < 0.05; total synapse number: control, 96.6 ± 11.9 × 10³/mm2; TTX, 111.3 ± 7.5 × 10³/mm2) (see Fig. 9B). Additional GluR1-negative synaptic NR2Bs (silent synapse) were significantly increased (control, 5.52 ± 1.12% of total synapse number, n = 10; TTX, 16.9 ± 2.6, n = 11; **p < 0.01), whereas there was no significant increase in the extent of colocalization of synaptic NR2B and GluR1 fluorescent puncta (NR2B-positive functional synapse, control, 15.7 ± 2.4%, n = 10; TTX, 19.3 ± 2.8, n = 11) (see Fig. 9C), indicating that NR2B-NMDARs were delivered to immature silent synapses rather than to functional synapses. Because the delivery and synthesis of GluR1 subunit are more rapidly regulated by synaptic activity (Shi et al., 1999; Ju et al., 2004), reduced activity could lose or decrease GluR1 subunit in synapses. This caused underestimation of the functional synapse number. To verify this point, a more stable AMPA receptor, GluR2, was used as a functional synapse marker. Immunostaining with GluR2 subunit also showed no significant increase in colocalization of GluR2 and synaptic NR2B puncta (percentage of total synapse number, control, 6.98 ± 1.50%, n = 7; TTX, 6.67 ± 1.06%, n = 8). These data also support the incorporation of NR2B-NMDARs into silent synapses rather than into mature synapses.
Figure 9.

Rapid increase in the colocalization of GluR1 and synaptic NR2B induced by circuit reactivation in TTX-treated neurons. A, Immunofluorescent images of NR2B, synaptophysin, and GluR1 puncta. Triple staining with antibodies to NR2B (a-c), synaptophysin (d-f; Synp), and GluR1 (g-i) are displayed with the same gain and encoded in merged images (NR2B in green, synaptophysin in blue, and GluR1 in red). Scale bar, 5 μm. Ctrl, Control neurons; TTX, TTX-treated neurons. B, Quantification of synaptic NR2B puncta. NR2B puncta colocalizing with synaptophysin were counted and normalized by total synapse number. TTX treatment significantly increased the number of silent synapse (control, 23.9 ± 3.0% of total synapse number, n = 10; TTX, 36.6 ± 3.8, n = 11; *p < 0.05; total synapse number: control, 96.6 ± 11.9 × 10³/mm2; TTX, 111.3 ± 7.5 × 10³/mm2). Circuit reactivation, achieved by washing out TTX and incubating neurons in extracellular solution with PTX (100 μm) for 30 min, did not increase the number of silent synapse (TTX + activation, 18.4 ± 1.7% of total synapse; n = 10). C, Quantitative analysis of NR2B-positive functional synapse. GluR1 puncta colocalizing with synaptic NR2B puncta were counted and normalized by total synapse number. TTX treatment did not significantly increase the extent of colocalization of GluR1 and synaptic NR2B puncta (control, 15.7 ± 2.4%, n = 10; TTX, 19.3 ± 2.8%, n = 11). Circuit reactivation clearly increased the number of GluR1 puncta colocalizing with synaptic NR2B puncta (TTX + activation, 28.5 ± 3.3; n = 10; *p < 0.05). Total synapse number was 129 ± 15.9/mm2 (n = 10), 148 ± 9.9/mm2 (n = 11), and 119.3 ± 10.0/mm2 (n = 10) for control, TTX, and TTX + activation, respectively. D, Quantification of GluR1 recruitment on synaptic NR2B puncta. Fluorescent intensities of GluR1 on synaptic NR2B puncta were quantified and plotted (left, same experiment in B; right, pooled data from three independent experiments). Circuit reactivation also increased the intensity of GluR1 signals on synaptic NR2B puncta (left; TTX, 176.1 ± 4.8, n = 11; TTX + activation, 198.4 ± 8.5, n = 10) and confirmed (right; pooled data, TTX, 100 ± 2%, n = 23 from 3 experiments; TTX + activation, 116 ± 2%, n = 31 from 3 experiments; ***p < 0.001).
Reactivation of neuronal circuits after TTX treatment increases AMPAR-mEPSCs
A straightforward conclusion is that the increase in neuronal connectivity in TTX-treated neurons is accompanied by an increase in the number of functional synaptic sites (Fig. 2B). Although this idea is supported by immunocytochemical analysis (Fig. 3B), electrophysiological data showed no significant increase in the number of functional synapses, because there was no increase in the frequency of AMPAR-mEPSCs (Fig. 4B). This discrepancy could arise from differences in both experimental conditions. When neuronal connectivity was examined, neurons were incubated in extracellular solution lacking TTX and containing PTX, a blocker of inhibitory synapses, to generate action potentials and to detect excitatory synaptic transmissions. This condition also led to autonomously augmented circuit activity. In contrast, neurons were maintained in TTX-containing solution after TTX treatment to assay for mEPSCs. To determine whether the autonomously increased activity converts silent into functional synapses and thereby increases the frequency of AMPAR-mEPSCs, the mEPSC assay was performed after incubating neurons in extracellular solution lacking TTX and containing 100 μm PTX for 30 min. This treatment was termed circuit reactivation. The frequency of AMPAR-mEPSCs was clearly increased by circuit reactivation in TTX-treated neurons but not in control neurons [Ctrl, 100 ± 11%, n = 27; Ctrl + activation, 99.2 ± 10.4%, n = 29; TTX, 87.9 ± 7.0%, n = 25; TTX + activation, 176 ± 18%, n = 33; p < 0.05 (Fig. 8A)]. Conversely, the amplitude of AMPAR-mEPSCs decreased to not a significant level of control [Ctrl, 100.0 ± 6.2%, n = 27; Ctrl + activation, 115 ± 6.9%, n = 29; TTX, 128.4 ± 9.1%, n = 25; TTX + activation, 111.0 ± 6.1%, n = 33 (Fig. 8B)]. This increase in mEPSC frequency can be explained by two mechanisms: conversion of silent to functional synapses and/or an increase in transmitter release probability. Because NR2B-NMDARs are reexpressed and act at silent synapses, we examined whether they contributed to this rapid conversion of synaptic property and found that ifenprodil (4 μm) significantly prevented this increase [TTX, 100 ± 26%, n = 9; TTX + activation, 186 ± 29%, n = 10; TTX+activation with ifenprodil, 144 ± 21%, n = 16 (Fig. 8C)]. Immunocytochemical analysis was again performed to further confirm the former possibility. The circuit reactivation significantly increased the number of colocalizing synaptic NR2B-positive functional synapse [GluR1 fluorescent puncta colocalizing with synaptic NR2B puncta, in percentage of control: TTX, 19.4 ± 2.8, n = 11; TTX + activation, 28.5 ± 3.3, n = 10; p < 0.05; total synapse number, TTX + activation, 716 ± 60/mm2 (Fig. 9C)]. We further examined the amount of recruited GluR1 subunit to synaptic NR2B puncta by the circuit reactivation. Quantification of GluR1 signal on the synaptic NR2B puncta revealed that the circuit reactivation significantly increased [TTX, 176.1 ± 4.8 arbitrary units (AU), n = 11 fields; TTX + activation, 198.4 ± 8.5 AU, n = 10; p < 0.05 (Fig. 9C, left)]. This rapid GluR1 recruitment on synaptic NR2B puncta was confirmed in three independent experiments [data were normalized by mean signal from TTX-treated neurons in each series of experiment; TTX, 100 ± 2%, n = 23 from 3 experiments; TTX + activation, 116 ± 2%, n = 31 from 3 experiments; p < 0.001 (Fig. 9C, right)]. Recent papers report that similar circuit activation rapidly induces synaptic plasticity in vitro (Watt et al., 2004) and in vivo (Lu and Constantine-Paton, 2004). Although there is no data that rule out an increase in transmitter release probability, these data strongly indicate that circuit reactivation rapidly converts the silent to functional synapses. The discrepancy was clearly resolved by the conversion.
The increase of neuron-neuron connectivity requires NMDAR activation
To understand the requirement for surface-delivered NR2B-NMDARs to increase neuron-neuron connectivity, the effects of NMDAR blockers on connectivity and on the surface expression of NR2B-NMDARs were examined. A reversible open-channel NMDAR blocker, ketamine (200 μm), prevented an increase in connectivity [CNT, 20.0 ± 5.9%; TTX, 76.7 ± 4.4%; TTX + ketamine, 33.4 ± 2.9%; n = 4 series; p < 0.05 (Fig. 10A)]. Conversely, this treatment did not prevent the delivery of NMDARs to the surface even in neurons treated with both TTX and ketamine [CNT, 21.6 ± 4.7%, n = 9; TTX, 65.2 ± 2.9%, n = 8; TTX + ketamine, 75.0 ± 4.3%, n = 12; p < 0.01 for control vs TTX and for control vs TTX + ketamine (Fig. 10B)]. NMDAR activation is thus required for the increase in connectivity but not for the delivery of NR2B-NMDARs to the surface.
Figure 10.

Requirement of NMDAR activation for the increase in neuron-neuron connectivity but not for the increase in surface NR2B-NMDARs. A, Neuron-neuron connectivity was measured as described in Figure 2. Neurons were untreated (Ctrl) or treated with TTX (TTX) or TTX plus 200 μm ketamine (TTX + ketamine) for the last 2 d of a 20 d culture (mean of 3 series of experiments; 20.0 ± 5.9, 76.7 ± 4.4, and 33.4 ± 2.9% for control, TTX, and TTX + ketamine, respectively; n = 4 series; *p < 0.05). B, Ifenprodil-sensitive currents were measured as described in Figure 5. Averaged currents of control (Ctrl), TTX-treated (TTX), and TTX plus ketamine-treated (TTX + ketamine) neurons (n = 8-12; *p < 0.05) are indicated. C, Averaged ifenprodil sensitivity of NMDA currents in control, TTX-treated, and CNQX-treated neurons (mean of 3 series of experiments; Ctrl, 28.9 ± 3.6%; TTX, 49.5 ± 1.8%; CNQX, 49.3 ± 1.6%; *p < 0.05). D, Averaged ifenprodil sensitivity of NMDA currents in control, TTX-treated, and both TTX- and AMPA-treated neurons (mean of 3 series of recordings; Ctrl, 21.4 ± 1.7%; TTX, 41.3 ± 4.5%; TTX plus AMPA, 17.9 ± 3.6%; *p < 0.05).
The increase of NR2B-NMDARs requires AMPAR inactivation
Because low doses of AMPA are known to prevent morphological changes in dendritic spines in response to blocking synaptic inputs in hippocampal slice cultures (McKinney et al., 1999), AMPAR activation is thought to be required for the maintenance of preexisting synaptic connections. This interpretation suggests that AMPAR activation prevents the delivery of NR2B-NMDARs to the surface of TTX-treated neurons. As expected, a low dose of AMPA (100 nm) administration during TTX treatment prevented an increase of NR2B-NMDAR currents in the neurons [CNT, 21.4 ± 1.7%; TTX, 41.3 ± 4.5%; TTX plus AMPA, 17.9 ± 3.6%; p < 0.05 (Fig. 10C)]. If AMPAR activation were critical for this result, the AMPAR antagonist CNQX should enhance NR2B-NMDAR expression. Treatment with CNQX instead of TTX indeed caused an increase in NR2B-NMDAR currents [CNT, 28.9 ± 3.6%; TTX, 49.5 ± 1.8%; CNQX, 49.3 ± 1.6%; p < 0.05 (Fig. 10D)], suggesting that blocking AMPAR activation is a key factor in inducing NR2B-NMDAR surface expression.
In conclusion, diminished neuronal activity promotes the expression and surface delivery of NR2B-NMDARs, and synaptic activation of these receptors converts silent synapses to functional synapses, resulting an increase in neuron-neuron connectivity. Although it has been known that synaptic receptors, including AMPARs, are reciprocally regulated by neuronal activity, we demonstrated that an important aspect of neuronal homeostatic plasticity is the formation of synapses between previously unconnected neurons in response to diminished synaptic activity.
Discussion
Homeostatic circuit plasticity is accompanied by synapse formation in mature neuronal circuits
Two well described mechanisms of activity-dependent synaptic modification are Hebbian and homeostatic plasticity. According to Hebb's rule, if both presynaptic and postsynaptic neurons get activated coincidently, synapses between the neurons are strengthened. Following this rule, synaptic strengths tend to be saturated because it is essentially positive feedback. To avoid saturation, neurons are thought to regulate synaptic strength to adjust to a dynamic range of synaptic inputs. Such normalization of synaptic inputs has been described as a parameter of homeostatic plasticity (Turrigiano and Nelson, 2000; Davis and Bezprozvanny, 2001; Burrone and Murthy, 2003). Previous reports indicated that neuronal activity modulates the extent of synaptic strength in existing excitatory synapses in cortical neuronal cultures (Turrigiano et al., 1998; Watt at al, 2000). Furthermore, modulations of neuronal excitability in a single neuron by expressing the inward-rectifying potassium channel Kir2.1 revealed that homeostatic plasticity rather than Hebbian plasticity is the predominant rule for regulating synaptic strength after synapse formation in hippocampal culture (Burrone et al., 2002).
In contrast to previous reports describing modifications of existing synapses, we demonstrated a distinct type of homeostatic plasticity, including modification of neuronal connectivity by synapse formation. Although we also observed modification on the amplitude of excitatory synaptic transmission, a prominent phenomenon was the upregulation of synapse formation accompanied by the surface delivery of NR2B-NMDARs. This synapse formation increased the neuron-neuron connectivity. Additional activity-dependent organization of neuronal circuit during development has been well described, although this report provides new aspects on homeostatic plasticity with neuronal connectivity in the mature neuronal circuit. This type of plasticity may induce the reorganization of neuronal networks to properly process informational input.
During development, it is well known that inhibition of neuronal activity prevents elimination of excess synapses (Mariani, 1983; Sanes and Lichtman, 1999; Chen and Regehr, 2000). The phenomena are considered that the treatment prevents the process for synaptic selection, probably attributable to a kind of synaptic competition. In this report, we showed that TTX treatment significantly promotes the formation of silent synapse even in a mature neuronal circuit and allows the mature neurons to be ready to make functional synapses with unconnected new partners. The mature neurons, therefore, have a potential of synaptic plasticity to alter their connections, as well as the long-term change in efficiency of synaptic transmission. It is plausible that diminished neuronal activity would promote the expression of some molecular factors that are required for synapse formation. Because this mechanism would also explain the selective elimination or decrease of once established synapses, activity-dependent bidirectional regulation of mature neuronal circuit is the certifiable hypothesis.
Previous reports found differences in homeostatic effects in cortical and hippocampal neurons (Turrigiano et al., 1998; Watt et al, 2000; Bacci et al., 2001; Burrone et al., 2002; Thiagarajan et al., 2002). The amplitude of mEPSCs changes in cortical neurons but not in hippocampal neurons. In contrast, the frequency of mEPSCs changes in hippocampal but not in cortical neurons. Although we used hippocampal neurons, 2 d TTX treatment increased the amplitude of functional mEPSCs but not the frequency. Interestingly, activation of neuronal circuit increased rapidly the frequency of mEPSCs, not the amplitude. The apparent change in parameters of frequency and amplitude of evoked and miniature postsynaptic currents might depend on whether the silent synapses had been converted to functional ones or not. This could explain discrepancies between our and previous reports.
During our TTX treatments, however, no activity accompanying action potentials that can induce the synaptic conversion was observed. Calcium/calmodulin-dependent kinase II (CaMKII) is one of the plausible candidates of the synaptic modulation. Neuronal CaMKII consists of α and β isoform (Miller and Kennedy, 1985), which is known to participate in synaptic plasticity (Malinow et al., 1988; Nicoll and Malenka, 1999; Hayashi et al., 2000), including conversion of silent to functional synapse (Wu et al., 1996). β isoform of CaMKII (βCaMKII) has higher calmodulin sensitivity than α isoform (Brocke et al., 1999), and reduction of neuronal activity can upregulate the expression of βCaMKII within a few days in hippocampal neurons (Thiagarajan et al., 2002). During the TTX treatment, a small quantity of Ca2+ increase, for example, caused by spontaneous synaptic release, can activate βCaMKII to result in the conversion. Expression levels of the kinase may also explain the difference between cortical and hippocampal neurons.
Incorporation of surface-delivered NR2B-NMDARs into silent synapses and rapid conversion of silent to functional synapses
The roles of NR2B-NMDARs in synaptic plasticity and neuronal organization have been well studied. NR2B-NMDARs are predominantly expressed before synapse formation and are present in immature synapses in hippocampal neurons (Tovar and Westbrook, 1999). Whereas NR2A-NMDARs are incorporated into synapses, NR2B-NMDARs are primarily extrasynaptic after synapse formation (Li et al., 1998; Tovar and Westbrook, 1999; Townsend et al., 2003). If extrasynaptic NR2B-NMDARs are activated, cAMP response element-binding protein signaling is shut off to result in cell death (Hardingham et al., 2002). Previous reports indicate that extrasynaptic NR2B-NMDARs act as negative regulators in cell signaling (Hardingham et al., 2002; Vanhoutte and Bading, 2003).
However, we show that surface-delivered NR2B-NMDARs are indispensable for silent synapse formation and for the reorganization of neuronal networks in the activity-diminished mature neuronal circuits. These results imply that not only receptor subunit identity but also the localization of NMDARs is critical for circuit reorganization. Particularly, an effect of signaling via NR2B-NMDARs on synaptic function should depend on the neuronal history of whether neurons have been activated or deactivated. Differential regulation of synaptic and extrasynaptic NMDARs was reported previously (Li et al., 2002), and the additional details would provide insight into the regulatory mechanisms of synapse formation in mature neurons.
Although NR2B-NMDARs have been indicated to be essential for the expression of long-term potentiation (LTP) in the somatosensory cortex during development (Lu et al., 2001), our findings are the first observation that NR2B-NMDARs are important for the conversion of silent to functional synapses in mature neuronal circuits. Concerning the involvement of NR2 subtype NMDARs in synaptic plasticity, our data conflicts somewhat with recent reports that NR2A and NR2B are critical for LTP and long-term depression expression, respectively, in adult rat hippocampal (Liu et al., 2004) and cortex slice preparations (Massey et al., 2004). However, our findings suggest that signaling mechanisms that involve NR2B-NMDARs in synaptic plasticity should depend on neuronal history in activity. NR2B-NMDARs may play key roles in homeostatic circuit plasticity, as negative regulators when neuronal circuits are appropriately or sufficiently active and as positive regulators when they are less active.
Activity-dependent surface delivery of NR2B-NMDARs
The trafficking of AMPARs into and out of synapses has been shown to be regulated in an activity-dependent manner on a timescale of minutes (Luscher et al., 1999; Noel et al., 1999; Shi et al., 1999). In contrast, NMDARs at synapses are thought to be more static. The synaptic changes induced by blocking receptors take several days (Liao et al., 2001). Neuronal activity also modulates subunit contributions to functional NMDARs at synapses or neuronal surfaces (Hoffmann et al., 2000; Philpot et al., 2001; Kiyosue et al., 2004). However, a representative mechanism for ensuring subunit-specific trafficking to neuronal surfaces and synapses was unknown.
Recent studies showed that the trafficking of NMDARs from the endoplasmic reticulum (ER) to plasma membrane is regulated by the C terminus of the NR1 subunit (Okabe et al., 1999; Standley et al., 2000). This region has ER retention and ER export signals, which are regulated by phosphorylation or mRNA splicing (Scott et al., 2001; Xia et al., 2001). Suppression of neuronal activity causes mRNA splicing to produce a C2′ cassette containing the NR1 subunit (Mu et al., 2003). This type of NR1 subunit has the ER export signal via a COPII-dependent mechanism.
It is still unclear which NR2 subtype forms a complex with the NR1 subunit to be delivered to synapses. In this paper, we demonstrated clearly that NR2B-NMDARs are transported to the cell surface in response to activity suppression. Based on these data, the delivery of the NR2B subunit might depend on C2′ cassette containing NR1 trafficking, although other possibilities are not excluded. For example, the increase in NR2B-NDMARs may be caused by protein synthesis, degradation, or changes in plasma or internal membrane localization.
Footnotes
This work was supported by the National Institute of Advanced Industrial Science and Technology. We thank Dr. T. Ishimoto and K. Ninomiya for preparing hippocampal cultures and Drs. H. Nishimune and A. Kobayashi for helpful comments for preparing this manuscript.
Correspondence should be addressed to either Dr. K. Kiyosue or Dr. T. Taguchi, Neuronics Research Group, Research Institute for Cell Engineering, National Institute of Advanced Industrial Science and Technology, 1-8-31, Midorigaoka, Ikeda, Osaka 563-8577, Japan. E-mail: kiyosue-k@aist.go.jp or taguchi-takahisa@aist.go.jp.
Copyright © 2005 Society for Neuroscience 0270-6474/05/254040-12$15.00/0
References
- Bacci A, Coco S, Pravettoni E, Schenk U, Armano S, Frassoni C, Verderio C, De Camilli P, Matteoli M (2001) Chronic blockade of glutamate receptors enhances presynaptic release and downregulates the interaction between synaptophysin-synaptobrevin-vesicle-associated membrane protein 2. J Neurosci 21: 6588-6596. [DOI] [PMC free article] [PubMed] [Google Scholar]
- Bonhoeffer T, Staiger V, Aertsen A (1989) Synaptic plasticity in rat hippocampal slice cultures: local “Hebbian” conjunction of pre- and postsynaptic stimulation leads to distributed synaptic enhancement. Proc Natl Acad Sci USA 86: 8113-8117. [DOI] [PMC free article] [PubMed] [Google Scholar]
- Bredt DS, Nicoll RA (2003) AMPA receptor trafficking at excitatory synapses. Neuron 40: 361-379. [DOI] [PubMed] [Google Scholar]
- Brocke L, Chiang LW, Wagner PD, Schulman H (1999) Functional implications of the subunit composition of neuronal CaM kinase II. J Biol Chem 274: 22713-22722. [DOI] [PubMed] [Google Scholar]
- Burrone J, Murthy VN (2003) Synaptic gain control and homeostasis. Curr Opin Neurobiol 13: 560-567. [DOI] [PubMed] [Google Scholar]
- Burrone J, O'Byrne M, Murthy VN (2002) Multiple forms of synaptic plasticity triggered by selective suppression of activity in individual neurons. Nature 420: 414-418. [DOI] [PubMed] [Google Scholar]
- Chen C, Regehr WG (2000) Developmental remodeling of the retinogeniculate synapse. Neuron 28: 955-966. [DOI] [PubMed] [Google Scholar]
- Davis GW, Bezprozvanny I (2001) Maintaining the stability of neural function: a homeostatic hypothesis. Annu Rev Physiol 63: 847-869. [DOI] [PubMed] [Google Scholar]
- Desai NS, Cudmore RH, Nelson SB, Turrigiano GG (2002) Critical periods for experience dependent synaptic scaling in visual cortex. Nat Neurosci 5: 783-789. [DOI] [PubMed] [Google Scholar]
- Faber DS, Korn H (1991) Applicability of the coefficient of variation method for analyzing synaptic plasticity. Biophys J 60: 1288-1294. [DOI] [PMC free article] [PubMed] [Google Scholar]
- Gomperts SN, Carroll R, Malenka RC, Nicoll RA (2000) Distinct roles for ionotropic and metabotropic glutamate receptors in the maturation of excitatory synapses. J Neurosci 20: 2229-2237. [DOI] [PMC free article] [PubMed] [Google Scholar]
- Hardingham GE, Fukunaga Y, Bading H (2002) Extrasynaptic NMDARs oppose synaptic NMDARs by triggering CREB shut-off and cell death pathways. Nat Neurosci 5: 405-414. [DOI] [PubMed] [Google Scholar]
- Hashimoto K, Kano M (2003) Functional differentiation of multiple climbing fiber inputs during synapse elimination in the developing cerebellum. Neuron 38: 785-796. [DOI] [PubMed] [Google Scholar]
- Hayashi Y, Shi SH, Esteban JA, Piccini A, Poncer JC, Malinow R (2000) Driving AMPA receptors into synapses by LTP and CaMKII: requirement for GluR1 and PDZ domain interaction. Science 287: 2262-2267. [DOI] [PubMed] [Google Scholar]
- Hebb DO (1949) The organization of behavior: a neurophysiological theory. New York: Wiley.
- Hestrin S (1992) Developmental regulation of NMDA receptor-mediated synaptic currents at a central synapse. Nature 357: 686-689. [DOI] [PubMed] [Google Scholar]
- Hoffmann H, Gremme T, Hatt H, Gottmann (2000) Synaptic activity-dependent developmental regulation of NMDA receptor subunit expression in cultured neocortical neurons. J Neurochem 75: 1590-1599. [DOI] [PubMed] [Google Scholar]
- Huettner JE, Bean BP (1988) Block of N-methyl-d-aspartate-activated current by the anticonvulsant MK-801: selective binding to open channels. Proc Natl Acad Sci USA 85: 1307-1311. [DOI] [PMC free article] [PubMed] [Google Scholar]
- Ju W, Morishita W, Tsui J, Gaietta G, Deerinck TJ, Adams SR, Garner CC, Tsien RY, Ellisman MH, Malenka RC (2004) Activity-dependent regulation of dendritic synthesis and trafficking of AMPA receptors. Nat Neurosci 7: 244-253. [DOI] [PubMed] [Google Scholar]
- Kiyosue K, Hiyama TY, Nakayama K, Kasai M, Taguchi T (2004) Reexpression of NR2B-containing NMDA receptors in vitro by suppression of neuronal activity. Int J Dev Neurosci 22: 59-65. [DOI] [PubMed] [Google Scholar]
- Kullmann DM (1994) Amplitude fluctuations of dual-component EPSCs in hippocampal pyramidal cells: implications for long-term potentiation. Neuron 12: 1111-1120. [DOI] [PubMed] [Google Scholar]
- Li B, Chen N, Luo T, Otsu Y, Murphy TH, Raymond LA (2002) Differential regulation of synaptic and extra-synaptic NMDA receptors. Nat Neurosci 5: 833-834. [DOI] [PubMed] [Google Scholar]
- Li JH, Wang YH, Wolfe BB, Krueger KE, Corsi L, Stocca G, Vicini S (1998) Developmental changes in localization of NMDA receptor subunits in primary cultures of cortical neurons. Eur J Neurosci 10: 1704-1715. [DOI] [PubMed] [Google Scholar]
- Liao D, Scannevin RH, Huganir R (2001) Activation of silent synapses by rapid activity-dependent synaptic recruitment of AMPA receptors. J Neurosci 21: 6008-6017. [DOI] [PMC free article] [PubMed] [Google Scholar]
- Liu L, Wong TP, Pozza MF, Lingenhoehl K, Wang Y, Sheng M, Auberson YP, Wang YT (2004) Role of NMDA receptor subtypes in governing the direction of hippocampal synaptic plasticity. Science 304: 1021-1024. [DOI] [PubMed] [Google Scholar]
- Lu HC, Gonzalez E, Crair MC (2001) Barrel cortex critical period plasticity is independent of changes in NMDA receptor subunit composition. Neuron 32: 619-634. [DOI] [PubMed] [Google Scholar]
- Lu W, Constantine-Paton M (2004) Eye opening rapidly induces synaptic potentiation and refinement. Neuron 43: 237-249. [DOI] [PubMed] [Google Scholar]
- Luscher C, Xia H, Beattie EC, Carroll RC, von Zastrow M, Malenka RC, Nicoll RA (1999) Role of AMPA receptor cycling in synaptic transmission and plasticity. Neuron 24: 649-658. [DOI] [PubMed] [Google Scholar]
- Malenka RC (2003) Synaptic plasticity and AMPA receptor trafficking. Ann NY Acad Sci 1003: 1-11. [DOI] [PubMed] [Google Scholar]
- Malinow R, Madison DV, Tsien RW (1988) Persistent protein kinase activity underlying long-term potentiation. Nature 335: 820-824. [DOI] [PubMed] [Google Scholar]
- Mariani J (1983) Elimination of synapses during the development of the central nervous system. Prog Brain Res 58: 383-392. [DOI] [PubMed] [Google Scholar]
- Massey PV, Johnson BE, Moult PR, Auberson YP, Brown MW, Molnar E, Collingridge GL, Bashir ZI (2004) Differential roles of NR2A and NR2B-containing NMDA receptors in cortical long-term potentiation and long-term depression. J Neurosci 24: 7821-7828. [DOI] [PMC free article] [PubMed] [Google Scholar]
- McKinney RA, Capogna M, Durr R, Gahwiler BH, Thompson SM (1999) Miniature synaptic events maintain dendritic spines via AMPA receptor activation. Nat Neurosci 2: 44-49. [DOI] [PubMed] [Google Scholar]
- Miller SG, Kennedy MB (1985) Distinct forebrain and cerebellar isozymes of type II Ca2+/calmodulin-dependent protein kinase associate differently with the postsynaptic density fraction. J Biol Chem 260: 9039-9046. [PubMed] [Google Scholar]
- Mu Y, Otsuka T, Horton AC, Scott DB, Ehlers MD (2003) Activity-dependent mRNA splicing controls ER export and synaptic delivery of NMDA receptors. Neuron 40: 581-594. [DOI] [PubMed] [Google Scholar]
- Nicoll RA, Malenka RC (1999) Expression mechanisms underlying NMDA receptor-dependent long-term potentiation. Ann NY Acad Sci 868: 515-525. [DOI] [PubMed] [Google Scholar]
- Nishimune A, Isaac JT, Molnar E, Noel J, Nash SR, Tagaya M, Collingridge GL, Nakanishi S, Henley JM (1998) NSF binding to GluR2 regulates synaptic transmission. Neuron 21: 87-97. [DOI] [PubMed] [Google Scholar]
- Noel J, Ralph GS, Pickard L, Williams J, Molnar E, Uney JB, Collingridge GL, Henley JM (1999) Surface expression of AMPA receptors in hippocampal neurons is regulated by an NSF-dependent mechanism. Neuron 23: 365-376. [DOI] [PubMed] [Google Scholar]
- Okabe S, Miwa A, Okado H (1999) Alternative splicing of the C-terminal domain regulates cell surface expression of the NMDA receptor NR1 subunit. J Neurosci 19: 7781-7792. [DOI] [PMC free article] [PubMed] [Google Scholar]
- Papa M, Bundman MC, Greenberger V, Segal M (1995) Morphological analysis of dendritic spine development in primary cultures of hippocampal neurons. J Neurosci 15: 1-11. [DOI] [PMC free article] [PubMed] [Google Scholar]
- Passafaro M, Nakagawa T, Sala C, Sheng M (2003) Induction of dendritic spines by an extracellular domain of AMPA receptor subunit GluR2. Nature 424: 677-681. [DOI] [PubMed] [Google Scholar]
- Philpot BD, Sekhar AK, Shouval HZ, Bear MF (2001) Visual experience and deprivation bidirectionally modify the composition and function of NMDA receptors in visual cortex. Neuron 29: 157-169. [DOI] [PubMed] [Google Scholar]
- Rao A, Craig AM (1997) Activity regulates the synaptic localization of the NMDA receptor in hippocampal neurons. Neuron 19: 801-812. [DOI] [PubMed] [Google Scholar]
- Sanes JR, Lichtman JW (1999) Development of the vertebrate neuromuscular junction. Annu Rev Neurosci 22: 389-442. [DOI] [PubMed] [Google Scholar]
- Scott DB, Blanpied TA, Swanson GT, Zhang C, Ehlers MD (2001) An NMDA receptor ER retention signal regulated by phosphorylation and alternative splicing. J Neurosci 21: 3063-3072. [DOI] [PMC free article] [PubMed] [Google Scholar]
- Selig DK, Hjelmstad GO, Herron C, Nicoll RA, Malenka RC (1995) Independent mechanisms for long-term depression of AMPA and NMDA responses. Neuron 15: 417-426. [DOI] [PubMed] [Google Scholar]
- Shi SH, Hayashi Y, Petralia RS, Zaman SH, Wenthold RJ, Svoboda K, Malinow R (1999) Rapid spine delivery and redistribution of AMPA receptors after synaptic NMDA receptor activation. Science 284: 1811-1816. [DOI] [PubMed] [Google Scholar]
- Standley S, Roche KW, McCallum J, Sans N, Wenthold RJ (2000) PDZ domain suppression of an ER retention signal in NMDA receptor NR1 splice variants. Neuron 28: 887-898. [DOI] [PubMed] [Google Scholar]
- Thiagarajan TC, Piedras-Renteria ES, Tsien RW (2002) alpha- and beta-CaMKII. Inverse regulation by neuronal activity and opposing effects on synaptic strength. Neuron 36: 1103-1114. [DOI] [PubMed] [Google Scholar]
- Tovar KR, Westbrook GL (1999) The incorporation of NMDA receptors with a distinct subunit composition at nascent hippocampal synapses in vitro J Neurosci 19: 4180-4188. [DOI] [PMC free article] [PubMed] [Google Scholar]
- Townsend M, Yoshii A, Mishina M, Constantine-Paton M (2003) Developmental loss of miniature N-methyl-d-aspartate receptor currents in NR2A knockout mice. Proc Natl Acad Sci USA 100: 1340-1345. [DOI] [PMC free article] [PubMed] [Google Scholar]
- Turrigiano GG, Nelson SB (2000) Hebb and homeostasis in neuronal plasticity. Curr Opin Neurobiol 10: 358-364. [DOI] [PubMed] [Google Scholar]
- Turrigiano GG, Leslie KR, Desai NS, Rutherford LC, Nelson SB (1998) Activity-dependent scaling of quantal amplitude in neocortical neurons. Nature 391: 892-896. [DOI] [PubMed] [Google Scholar]
- Vanhoutte P, Bading H (2003) Opposing roles of synaptic and extrasynaptic NMDA receptors in neuronal calcium signaling and BDNF gene regulation. Curr Opin Neurobiol 13: 366-371. [DOI] [PubMed] [Google Scholar]
- Vissel B, Krupp JJ, Heinemann SF, Westbrook GL (2001) A use-dependent tyrosine dephosphorylation of NMDA receptors is independent of ion flux. Nat Neurosci 6: 587-596. [DOI] [PubMed] [Google Scholar]
- Watt AJ, van Rossum MC, MacLeod KM, Nelson SB, Turrigiano GG (2000) Activity coregulates quantal AMPA and NMDA currents at neocortical synapses. Neuron 26: 659-670. [DOI] [PubMed] [Google Scholar]
- Watt AJ, Sjostrom PJ, Hausser M, Nelson SB, Turrigiano GG (2004) A proportional but slower NMDA potentiation follows AMPA potentiation in LTP. Nat Neurosci 7: 518-524. [DOI] [PubMed] [Google Scholar]
- Wu G, Malinow R, Cline HT (1996) Maturation of a central glutamatergic synapse. Science 274: 972-976. [DOI] [PubMed] [Google Scholar]
- Xia H, Hornby ZD, Malenka RC (2001) An ER retention signal explains differences in surface expression of NMDA and AMPA receptor subunits. Neuropharmacology 41: 714-723. [DOI] [PubMed] [Google Scholar]