

Abstract
We used statistical modeling to investigate variability in the cortical auditory representations of 24 normal-hearing epilepsy patients undergoing electrocortical stimulation mapping (ESM). Patients were identified as normal or impaired listeners based on recognition accuracy for acoustically filtered words used to simulate everyday listening conditions. The experimental ESM task was a binary (same-different) auditory syllable discrimination paradigm that both listener groups performed accurately at baseline. Template mixture modeling of speech discrimination deficits during ESM showed larger and more variable cortical distributions for impaired listeners than normal listeners, despite comparable behavioral performances. These results demonstrate that individual differences in speech recognition abilities are reflected in the underlying cortical representations.
Keywords: statistical modeling, auditory cortex, speech recognition, epilepsy, brain mapping, superior temporal gyrus
Introduction
Most human listeners compensate readily when the speech signal is degraded acoustically by background noise or other environmental factors (Nabelek and Pickett, 1974). However, it is estimated that up to 15% of normal-hearing individuals fail to compensate for loss of acoustic information regardless of age, resulting in speech recognition impairments detrimental to verbal communication (American Speech-Language and Hearing Association, 1996). Electrophysiology and neuroimaging studies have suggested a neurological basis for these impairments, including atypical hemispheric lateralization and decreased interhemispheric transfer (Estes et al., 2002; Bamiou et al., 2004; Warrier et al., 2004). The possibility of associated abnormalities in intrahemispheric organization, especially in the language-dominant left hemisphere, has not been investigated.
Neuroimaging studies show activation of the left superior temporal gyrus (STG) during speech discrimination (Scott et al., 2000; Poldrack et al., 2001; Binder et al., 2004; Liebenthal et al., 2005). Furthermore, activation is primarily restricted to the posterior half of the STG (pSTG) when stimulus discriminability is high and the discrimination task does not require phonological or lexical-semantic processing associated with other cortical regions. An electrocortical stimulation mapping (ESM) study identified the left lateral pSTG as critical for speech discrimination in normal listeners (Miglioretti and Boatman, 2003). ESM is used to map speech and language functions in epilepsy surgery patients (Ojemann, 1979). This method is useful for investigating variability in cortical representations because ESM effects are transient, focal, and highly reproducible (Howard et al., 2000; Boatman, 2004). Animal and human microelectrode recording studies have indicated that the lateral pSTG is functionally specialized for processing complex sounds (Howard et al., 2000; Rauschecker and Tian, 2000, 2004). Inadequate functional specialization of this region has been associated with reading and other language impairments (Klingberg et al., 2000). We hypothesized that impaired listeners recruit more cortical resources than normal listeners during speech discrimination to compensate for inadequate functional specialization of the pSTG. To test this hypothesis, we used statistical modeling to quantify differences in ESM results from two new groups of epilepsy patients identified behaviorally as normal or impaired listeners.
Materials and Methods
Patients
We tested 24 epilepsy patients, 16-57 years of age (mean, 34 years), undergoing extraoperative ESM (Table 1). All were surgical candidates with medically intractable, unilateral left hemisphere, complex partial seizures. Inclusion criteria were (1) no comorbid neurological disorders (e.g., tumor), (2) seizure foci outside the perisylvian cortex, and (3) no history of hearing loss or speech-language, motor, attention, or psychiatric disorders. Twenty-one patients underwent the intracarotid amobarbital procedure for language lateralization (Boatman et al., 2000). Audiometric testing confirmed normal hearing bilaterally, with pure tone air and bone conduction thresholds ≤25 dB hearing level (HL) at 0.25-8.0 kHz, middle ear peak compliance pressure at 0 ± 100 daPa (226 Hz probe), and acoustic reflexes ≤95 dB HL (2.0 kHz contralateral stimulation). All gave informed written consent for participation in accordance with the Institutional Review Board. Parental consent and patient assent were obtained for patients under 21 years of age.
Table 1.
Patient characteristics and presurgical word recognition scores represented as proportion correct
|
|
|
|
|
|
|
|
Hearing threshold (dB HL)a |
Word recognition score |
||||
|---|---|---|---|---|---|---|---|---|---|---|---|---|
| Patient |
Sex |
Age (years) |
Dominant hand |
Seizure onset age |
FSIQ |
IAP results |
RE |
LE |
Nonfiltered |
Filtered |
||
| Normal listeners | ||||||||||||
| 1 | M | 57 | Left | 13 years | 100 | MD | 22 | 23 | 1.00 | 0.85 | ||
| 2 | F | 21 | Left | 12 years | 96 | LH | 13 | 12 | 0.96 | 0.93 | ||
| 3 | M | 45 | Right | 39 years | 101 | MD | 23 | 22 | 1.00 | 0.93 | ||
| 4 | M | 21 | Right | 17 years | 105 | LH | 12 | 10 | 1.00 | 0.88 | ||
| 5 | F | 46 | Right | 7 years | 75 | NT | 23 | 23 | 0.98 | 0.85 | ||
| 6 | F | 16 | Right | 5 years | 85 | NT | 22 | 20 | 0.98 | 0.85 | ||
| 7 | M | 23 | Left | 4 years | 99 | LH | 13 | 12 | 0.98 | 0.85 | ||
| 8 | M | 31 | Right | 16 years | 97 | LH | 10 | 10 | 1.00 | 0.88 | ||
| 9 | M | 45 | Right | 11 months | 81 | BL | 22 | 22 | 0.98 | 0.88 | ||
| 10 | F | 52 | Right | 31 years | 80 | LH | 23 | 22 | 1.00 | 0.85 | ||
| 11 | F | 37 | Left | 16 years | 93 | LH | 20 | 18 | 0.98 | 0.83 | ||
| 12 | F | 26 | Right | 2 years | 73 | LH | 12 | 12 | 0.96 | 0.90 | ||
| Mean | 0.99 | 0.87 | ||||||||||
| Median | 0.98 | 0.87 | ||||||||||
| Impaired listeners | ||||||||||||
| 1 | M | 25 | Right | 9 months | 92 | LH | 7 | 7 | 0.98 | 0.60 | ||
| 2 | F | 54 | Left | 29 years | 101 | BL | 22 | 23 | 0.98 | 0.73 | ||
| 3 | M | 48 | Right | 8 years | 99 | LH | 20 | 20 | 0.96 | 0.65 | ||
| 4 | F | 46 | Left | 24 years | 105 | LH | 20 | 22 | 1.00 | 0.68 | ||
| 5 | M | 24 | Right | 18 months | 88 | MD | 10 | 10 | 1.00 | 0.60 | ||
| 6 | M | 33 | Right | 29 years | 83 | MD | 13 | 13 | 1.00 | 0.73 | ||
| 7 | F | 36 | Left | 11 months | 79 | MD | 20 | 22 | 0.98 | 0.60 | ||
| 8 | M | 24 | Right | 16 months | 85 | MD | 12 | 12 | 0.96 | 0.48 | ||
| 9 | F | 16 | Right | 2 years | 101 | NT | 8 | 10 | 1.00 | 0.73 | ||
| 10 | F | 40 | Right | 4 years | 88 | MD | 22 | 20 | 1.00 | 0.70 | ||
| 11 | M | 34 | Right | 8 years | 96 | LH | 17 | 15 | 0.98 | 0.45 | ||
| 12 | F | 26 | Right | 24 years | 85 | LH | 8 | 8 | 1.00 | 0.70 | ||
| Mean | 0.99 | 0.64 | ||||||||||
| Median |
|
|
|
|
|
|
|
|
0.99 |
0.67 |
||
FSIQ, Full-scale intelligence quotient; IAP, intracarotid amobarbital procedure; RE, right ear; LE, left ear; M; male; F, female; MD, mixed language dominance; LH, left hemisphere language dominance; NT, not tested; BL, bilateral language.
Average three-frequency (0.5-2.0 kHz) pure tone hearing threshold.
Presurgical testing
An audiologist blinded to the study administered two standardized tests of word recognition in an audiometric booth using insert earphones (Eartone-3A) and a two-channel audiometer. Patients repeated single words presented at 50 dB HL in a carrier phrase. Word recognition under good listening conditions was tested monaurally with 50 digitized (44 kHz, 16 bit sampling) monosyllabic words (male speaker) from standardized phonetically balanced word lists (CID Auditory Test W-22) (Katz, 1997). All patients demonstrated excellent word recognition under good listening conditions (≥96%). Word recognition under adverse listening conditions was tested monaurally with 40 digitized, low-pass-filtered (1.0 kHz cutoff, 32 dB/octave roll-off) monosyllabic words (SCAN-A Test) (Keith, 1994). Twelve patients performed normally (mean standard score, 10 ± 3) with scores ≥83% correct; 12 scored ≤73% correct, >2 SD below the mean, and were classified as impaired listeners (Table 1). Logistic regression confirmed that impaired listeners had poorer filtered word scores than normal listeners (p < 0.0001). The two groups did not differ in age (p = 0.40; t test), sex (p = 1.00; Fisher's exact test), handedness (p = 0.54; Fisher's exact test), intelligence quotient (IQ) (p = 0.85; t test), or seizure onset age (p = 0.24; t test). Impaired listeners showed a borderline significant trend toward higher rates of atypical language dominance (p = 0.057; Fisher's exact test).
Brainstem auditory evoked responses were recorded from the last 11 patients (six normal listeners and five impaired listeners). Rarefaction clicks were presented (21/s) monaurally at 75 dB sound pressure level (SPL) with 45 dB of masking noise in the contralateral ear. Four silver disk electrodes were used to record from vertex (Cz) to the mastoid (A1 and A2) ipsilateral to the stimulated ear, with a forehead ground. For each ear, 2000 trials were recorded at electrode impedances <5kΩ using a Nicolet spirit-evoked response system. The EEG filter was set to band-pass 0.1-3.0 kHz. Waveforms were averaged using a poststimulus analysis time of 15 ms. Peak latencies for waves I-V were identified for each ear. Absolute, interpeak, and interaural latencies were within normal limits in all cases, as determined by clinical norms.
Electrode implantation surgery
Arrays of 6 × 8 and 2 × 8 electrodes were implanted subdurally over the left lateral cortex. Electrodes were 3 mm platinum disks embedded 10 mm apart in medical-grade silastic (Adtech, Racine WI). Electrode locations were determined using patients' presurgical magnetic resonance imaging (MRI) scans, intraoperative photographs, and computed tomographic (CT) scans obtained after electrode implantation (Boatman et al., 2000). Patients had electrode coverage of the posterior (23 patients) and anterior (19 patients) temporal lobe, frontal lobe (12 patients), and parietal lobe (12 patients). Differences in electrode coverage were determined by clinical circumstances.
Electrocortical stimulation mapping
Clinical language tasks. Three language functions were tested during ESM: picture naming, single-word reading, and auditory comprehension. Picture-naming stimuli were 35 line drawings from the Boston Naming Test. Reading stimuli were 50 single words of three to seven letters that patients read aloud (Burnstine et al., 1990). Auditory comprehension was assessed with 30 one-step verbal directions from the Token Test.
Experimental task and stimuli. We used a binary (same-different) auditory discrimination paradigm (Boatman et al., 2000) to present 50 stimulus pairs comprising three types: syllables (30), pure tones (10), and spectrally complex, frequency-modulated (FM) tones (10). Each stimulus pair was 1200 ms in duration: 400 ms per stimulus with a fixed intrapair interval of 400 ms. Syllable pairs (e.g., paba and daga) were generated from digitized consonant-vowel syllables (44.1 kHz, 16 bit sampling) containing an initial stop consonant (/p, t, k, b, d, g/) followed by the vowel /a/ (Sound Forge; Sonic Foundry). Pure tone pairs (0.5-2.5 kHz, 0.2-1.0 kHz contrasts) and three-formant FM tone pairs were generated (NCH tone generator). FM tones were composed of a steady-state first (750 Hz) and third (2500 Hz) frequency formant. The initial 70 ms of the second formant contained an upward or downward transition (starting frequencies, 0.9, 1.3, and 2.0 kHz) with a 0.2 or 0.9 kHz slope to the target frequency of 1.1 kHz, selected to approximate the second formant of the vowel /a/. Stimuli were blocked by type, with random order of presentation within and between blocks. Patients responded by pressing a button pad.
Baseline testing. Testing was initiated 1-2 d after surgery and before ESM to rule out surgery-related changes in hearing or word recognition and provide baseline data for interpretation of ESM results. Patients were tested individually, at bedside, in single-occupant rooms in the Epilepsy Monitoring Unit (ambient noise <45 dB SPL, sound level meter). Normal cochlear function was confirmed bilaterally (0.5-6.0 kHz) with a handheld Distortion Product Otoacoustic Emissions screener (EROSCAN). Auditory word recognition was tested with a different set of 50 digitized monosyllabic words (female speaker): 25 nonfiltered words and 25 low-pass-filtered (1.0 kHz, 32 dB/octave roll-off) words presented in the same carrier phrase (Auditec, 1984). Auditory stimuli were presented binaurally through insert earphones (Eartone-3A) at 65 dB HL (≥40 dB SL) using a customized two-channel auditory system. Baseline auditory discrimination testing was used for statistical comparisons with patients' ESM performances. Baseline language testing identified for exclusion stimuli that elicited incorrect responses, ensuring accurate response scoring during clinical ESM (Burnstine et al., 1990; Boatman et al., 2000). An ESM nurse and technician, blinded to patients' group status, performed the baseline testing and ESM studies under supervision of an epileptologist.
ESM procedures. Patients underwent 3-5 d of ESM and continuous intracranial EEG recordings. Anticonvulsant medications were tapered for seizure localization. ESM was performed according to clinical procedures (Lesser et al., 1987). Five second trains of 50 Hz, 0.3 ms, alternating polarity square-wave pulses were generated between adjacent electrodes using a Grass cortical stimulator (Grass-Telefactor; Astro Med). Auditory discrimination mapping was done in conjunction with clinical language mapping. Testing was performed at current thresholds between 13 and 15 mA and was not performed at sites where ESM induced sensory or motor effects or afterdischarges. Stimuli were presented ∼1 s after current onset, with one stimulus trial administered in each 5 s current period. Intertrial intervals were not fixed to allow for visual inspection of the EEG for afterdischarges. To avoid patient fatigue or overfamiliarization, a subset of 4-10 stimuli from each language task was selected for each electrode site. Auditory discrimination was screened at each electrode site using five syllable pairs selected randomly from those that patients discriminated accurately at baseline. The full discrimination task was administered when one or more errors occurred during screening. Pure tone and FM tone discrimination were tested only at sites where syllable discrimination errors occurred. FM tone discrimination was assessed only in the last nine patients.
Auditory discrimination and language errors were defined as responses that were incorrect, absent, or delayed. Delayed responses occurred after the 5 s period of current activation. In this study, there were no instances of delayed syllable discrimination responses during ESM. A language deficit was defined clinically as more than one error on a language task. A syllable discrimination deficit was defined as a significant decrease relative to patients' baseline performance. Because the small number of FM and pure tones precluded parametric analysis, a deficit was defined as an increase of more than one error relative to each patient's baseline error rate. Based on ESM results, a comprehensive cortical map of binary (±deficit) data was generated for each patient.
Data analysis
Behavioral data. Within-patient comparisons of baseline versus ESM response accuracy were performed using Fisher's exact test of no association (Armitage and Berry, 1994). Mantel-Haenszel χ2 tests were used to identify within-patient differences by consonant feature. Group comparisons were performed using an overdispersed logistic regression model to account for clustering within patients (McCullagh and Nelder, 1989).
Electrode mapping. Electrode locations were normalized to a two-dimensional (2D) brain representation for statistical modeling (see Fig. 1). A 2D representation was used because electrodes are located only on the lateral cortical surface (Gordon et al., 1997). Electrode locations were mapped to a 2D coordinate system (anteroposterior and inferosuperior) using measurements from each patient's intraoperative photographs and MRI and CT images, referencing the anterior temporal pole and Sylvian fissure (Gordon et al., 1997; Miglioretti et al., 2000). Five patients (two normal listeners and three impaired listeners) had three-dimensional (3D) MRI and CT scans in formats suitable for normalization to a 3D stereotactic brain atlas using SPM2 (http://www.fil.ion.ucl.ac.uk/spm/software/spm2). Each patient's 3D MR and CT images were coregistered and then normalized with the MR image into standard stereotactic space [Montreal Neurological Institute (MNI), Montreal, Quebec, Canada]. Electrode positions were verified visually and cross-referenced with 3D reconstructions generated with Neuroscan Curry software (Neurosoft Inc.). Talairach coordinates for electrode sites where syllable discrimination was impaired were then computed for each set of electrode coordinates in MNI space (Table 2).
Figure 1.
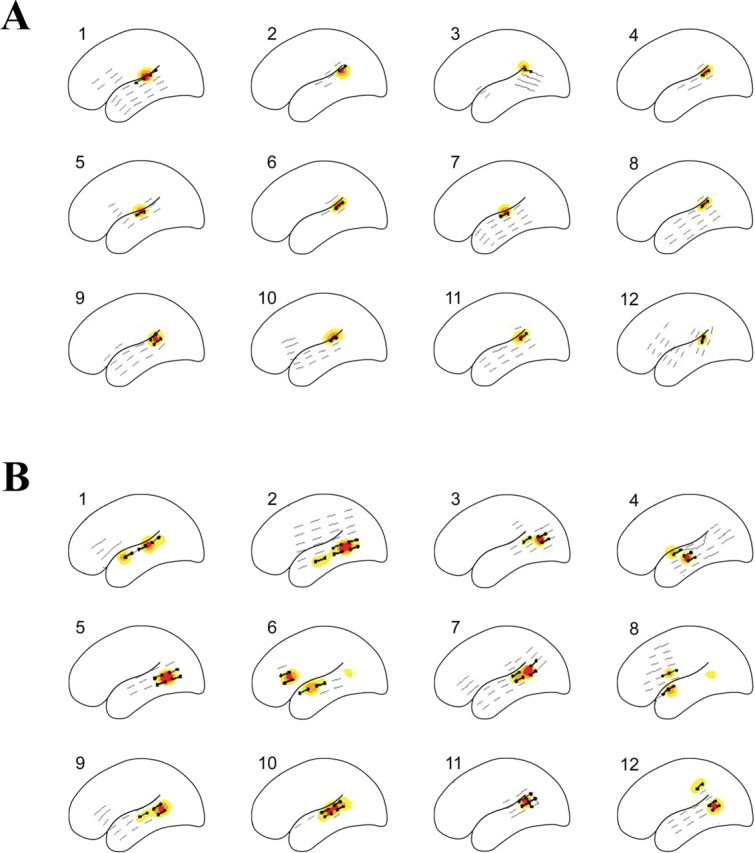
Individual probability contours of sites associated with ESM auditory speech discrimination deficits in normal listeners (A) and impaired listeners (B). Black dots represent sites where speech discrimination was impaired; gray lines identify sites where speech discrimination remained intact. Yellow contours, 0.05 ≤ p < 0.10; orange contours, 0.10 ≤ p < 0.20; red contours, p > 0.20, where p is the probability that a site is associated with a deficit.
Table 2.
Stereotactic locations of electrodes associated with speech discrimination deficits during left hemisphere ESM in normal and impaired listeners
|
Region |
x |
y |
z |
|---|---|---|---|
| Normal listeners (n = 2) | |||
| Temporal lobe | |||
| Superior temporal gyrus | −66 | −37 | 15 |
| −67 | −30 | 9 | |
| −65 | −20 | 5 | |
| −64 | −23 | 5 | |
| −64 | −33 | 13 | |
| Impaired listeners (n = 3) | |||
| Temporal lobe | |||
| Superior temporal gyrus | −57 | −42 | 14 |
| −57 | −28 | 8 | |
| −59 | −31 | 13 | |
| −59 | −24 | 4 | |
| −58 | −15 | 11 | |
| −56 | −6 | 3 | |
| −55 | −1 | −4 | |
| −53 | −32 | 11 | |
| −49 | −39 | 17 | |
| Superior/middle temporal gyri | −55 | −19 | 2 |
| Middle temporal gyrus | −57 | −26 | −6 |
| −57 | −34 | 0 | |
| −58 | −6 | −10 | |
| −59 | −15 | −4 | |
| Parietal lobe | |||
| Inferior parietal | −57 | −49 | 21 |
| −61 | −45 | 24 | |
| −43 | −46 | 23 | |
| Postcentral | −49 | −26 | 35 |
| −45 | −17 | 41 | |
| Frontal lobe | |||
| Precentral | −48 | −12 | 34 |
| Inferior frontal |
−52 |
18 |
27 |
Statistical modeling. The cortical distribution of speech discrimination deficits was modeled statistically using template mixture modeling (Miglioretti et al., 2000, 2003). For individual patients and the population, cortical sites associated with auditory discrimination were modeled as mixtures of circular templates specified by two location parameters (μ1k and μ2k) and a radius (ρk). Templates used to model individual patient sites were derived from a distribution centered at one of the population templates. The number of individual and population templates needed to model cortical areas was estimated from the data. Observed binary values for each site (±deficit) were modeled as a function of the combined regions delineated by the templates using logistic regression (McCullagh and Nelder, 1989): log it (E(yij | μi, ρi)) = α0 + α1H(μi, ρi, xij)).
Regression parameters α0 and α1 describe the error rates for auditory speech discrimination, with α0 the log odds of observing a deficit when the jth site does not overlap with a cortical site associated with a deficit. The slope of the parameter α1 describes the chance, in log odds, of inducing a deficit as the location of ESM increasingly overlaps with a cortical region necessary for auditory discrimination. The amount of electrical current from the jth electrode site overlapping cortical regions of interest, standardized from 0 to 1, is represented as H(μi, ρi, xij). The model was fit using the Bayesian approach of reversible jump Markov chain Monte Carlo simulation (Green, 1995). Individual probability contours were derived for each patient to determine the location, shape, and size of cortical regions associated with auditory discrimination deficits. Probable locations of deficits in the population were estimated by pooling information across patients. The estimated size of individual and population regions was based on the computed area of regions having at least a 5% posterior probability of being critical for auditory speech discrimination. The 95% highest posterior density intervals, the Bayesian equivalent of 95% confidence intervals (Gelman et al., 1995), were calculated using SAS PROC KDE (SAS Institute Inc., Cary, NC).
Results
Baseline results
All patients demonstrated normal nonfiltered word recognition after surgery (≥92%), with no significant differences between listener groups (p ≥ 0.44). For filtered word recognition, normal listeners showed no significant change from their presurgical scores (p > 0.59), which continued to be normal (≥84%). Similarly, impaired listeners showed no changes from their presurgical impaired performances (p > 0.59) and continued to perform significantly worse than normal listeners (p < 0.001). On baseline auditory syllable, FM, and tone discrimination testing, all patients demonstrated ≥90% accuracy, with no differences between listener groups (p > 0.45).
ESM results
A total of 350 electrode sites were tested across the 24 patients. The number of sites tested for normal listeners (range, 5-22; mean, 13) and impaired listeners (range, 7-28; mean, 16) did not differ (p = 0.32; t test). Group differences were found in the number, location, and patterns of auditory discrimination deficits observed during ESM.
Normal listeners
Syllable discrimination was impaired at a total of 14 electrode sites across the 12 normal listeners, with one or two sites per patient (p < 0.01 in all cases; Fisher's exact test). Deficits were located exclusively in the posterior half of the lateral STG (Fig. 1A). Analysis of patients' syllable discrimination errors showed no differences for consonant voicing or place of articulation (p = 0.29; Mantel-Haenszel χ2 test). Normal listeners did not exceed baseline tone discrimination error rates but did exceed baseline FM discrimination error rates by three to five errors per patient. Clinical language ESM at the same sites induced auditory comprehension deficits in all 12 patients; naming and word reading remained intact.
Impaired listeners
Syllable discrimination was impaired at 45 electrode sites, three to five sites per patient, across the 12 impaired listeners (p < 0.01 in all cases; Fisher's exact test). Syllable discrimination deficits were mapped to the pSTG of all impaired listeners, except the one patient who did not have electrode coverage of this region, and to sites outside the pSTG (Fig. 1B). These sites included the anterior STG (four patients), middle temporal gyrus (seven), and inferior frontal (two) and parietal (one) lobes. The number of sites where syllable discrimination was impaired was greater for impaired listeners than normal listeners (p = 0.0001; Mantel-Haenszel χ2 test). Impaired listeners also showed a borderline significant trend toward greater consonant place of articulation than voicing errors (p = 0.074; Mantel-Haenszel χ2 test). Pure tone discrimination error rates did not exceed baseline; FM tone discrimination error rates increased by two to seven errors per patient. Clinical language ESM in impaired listeners induced deficits in auditory comprehension, naming, and reading at sites where syllable discrimination was impaired.
Statistical modeling
Template mixture models revealed differences in estimated individual regions critical for syllable discrimination (Fig. 1). The average size of individual regions for normal listeners was 1.25 mm2 [95% highest posterior density (HPD), 0.77-2.32 mm2], whereas that of impaired listeners was 5.06 mm2 (95% HPD, 3.63-6.58 mm2). The probability that speech discrimination mapped to a larger cortical area in an impaired listener compared with a normal listener was >0.99 (estimated difference, 3.48 mm2; 95% HPD, 1.90-5.32 mm2). Intersubject variances for individual regions were greater for impaired than normal listeners. For normal listeners, the sums of intersubject variances associated with the two-dimensional template locations were 1.8 and 1.4 (95% HPD, 0.3-4.2 and 0.2-3.9 mm2) compared with 5.3 and 4.7 for impaired listeners (95% HPD, 2.7-9.2 and 2.2-7.7 mm2). Estimated population regions for normal and impaired listeners also differed (Fig. 2). For normal listeners, the size of this region was 1.27 mm2 (95% HPD, 0.00-1.55 mm2), whereas that of impaired listeners was 6.48 mm2 (95% HPD, 2.92-10.49 mm2). The probability that speech discrimination mapped to a larger cortical area in impaired listeners as a group versus normal listeners was >0.99 (estimated difference, 6.32 mm2; 95% HPD, 2.39-10.32 mm2).
Figure 2.
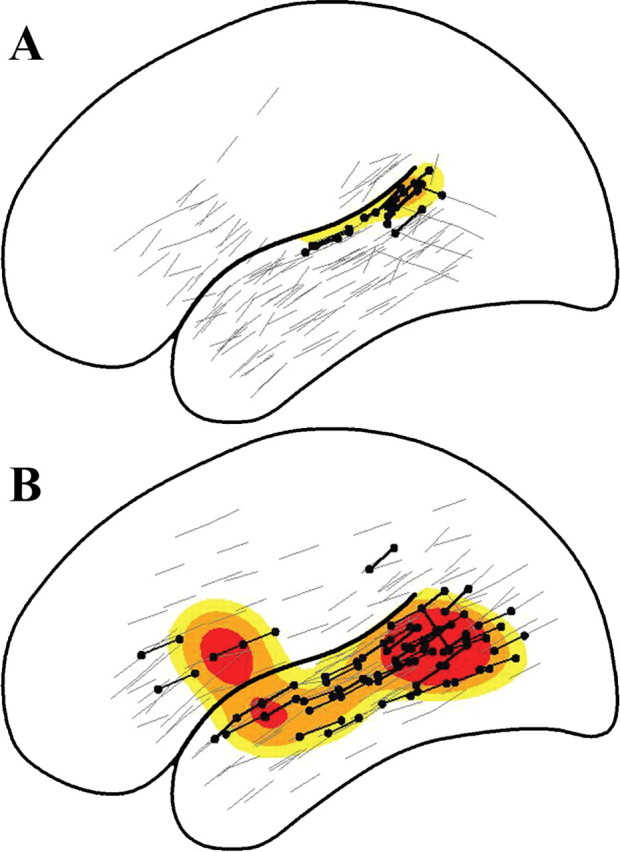
Population probability densities for the distribution of auditory speech discrimination deficits in normal listeners (A) and impaired listeners (B). Black dots represent sites where auditory speech discrimination was impaired; gray lines identify sites where speech discrimination was intact. Yellow contours, 0.05 ≤ p < 0.10; orange contours, 0.10 ≤ p < 0.20; red contours, p > 0.20, where p is the probability that a site is associated with a deficit.
Discussion
Our results demonstrate that individual differences in filtered word recognition accuracy are reflected in the underlying cortical distributions. Statistical modeling of ESM results, using template mixture models, revealed a larger and more variable left hemisphere distribution for impaired than normal listeners when a simple syllable discrimination task was used to control for differences in behavioral performance. These results are consistent with and extend previous findings suggesting a neurological basis for speech recognition impairments under adverse listening conditions (Estes et al., 2002; Bamiou et al., 2004; Warrier et al., 2004).
For normal listeners, syllable discrimination mapped to the lateral pSTG, replicating results from a previous ESM study (Miglioretti and Boatman, 2003). Concurrent deficits in FM tone discrimination and auditory comprehension, with sparing of pure tone discrimination, picture naming, and word reading, are consistent with electrode locations on the lateral pSTG. Animal and human studies have suggested that the lateral pSTG, which houses nonprimary auditory areas (e.g., belt and parabelt areas), is functionally specialized for processing acoustically complex sounds, whereas more medial primary (core) auditory areas respond best to simple tones (Howard et al., 2000; Rauschecker and Tian, 2000, 2004; Liebenthal et al., 2005). The lack of consonant feature dissociations, coupled with the selective language impairment in auditory comprehension, is consistent with the location of auditory-specific sites within the proposed ventral temporal lobe “what” auditory pathway involved in hierarchical integration of acoustic features for complex sound perception (Rauschecker and Tian, 2000, 2004). The particular language tasks administered, however, do not entirely preclude involvement of auditory-related functions, such as phonological processing for reading.
Our findings are consistent with neuroimaging studies showing little activation outside the left pSTG when stimulus discriminability is high and requirements for phonological encoding (i.e., stimulus matching and identification) or lexical-semantic processing (i.e., lexical decision and comprehension) are low (Scott et al., 2000; Poldrack et al., 2001; Binder et al., 2004; Liebenthal et al., 2005). We used consonant-vowel syllables, discriminated accurately by all patients, in a same-different paradigm that did not require phonological or lexical-semantic processing. ESM effects are relatively focal, producing cortical maps that are more circumscribed than those generated from neuroimaging studies (Boatman, 2004). However, because ESM is also restricted to gyral structures of one hemisphere, potential contributions from sulcal structures and the contralateral hemisphere could not be determined.
For impaired listeners, syllable discrimination mapped to the pSTG and other left hemisphere regions, including the anterior STG, middle temporal gyrus, and parietal and frontal lobes. Only the pSTG was identified consistently across patients. The non-pSTG sites have been associated with later stages of auditory speech processing in normal listeners, such as phonological and lexical-semantic processing (Scott et al., 2000; Poldrack et al., 2001; Binder et al., 2004; Liebenthal et al., 2005), and with compensatory processing for degraded speech intelligibility (Davis and Johnsrude, 2003). In keeping with previous studies, impaired listeners also showed higher rates of atypical language lateralization, suggesting abnormal interhemispheric as well as intrahemispheric organization (Estes et al., 2002; Bamiou et al., 2004; Warrier et al., 2004).
Compared with normal listeners, impaired listeners had larger distributions of syllable discrimination deficits that included areas outside the pSTG, suggesting that they may require more cortical resources. The need for additional cortical resources may reflect inadequate functional specialization of the pSTG resulting from abnormal development of white matter connections as found in dyslexia and other language disorders (Klingberg et al., 2000). Additional studies are needed to determine whether similar white matter abnormalities occur in impaired listeners. An alternative explanation is that the underlying cortical representations do not differ in size but differ in functionality. Normal listeners may have more robust systems that allow them to compensate for disruptions outside the pSTG. Conversely, impaired listeners may be unable to recruit other cortical resources because of decreased functionality in the system. Although our results do not differentiate between these two accounts, the pSTG is critical for speech discrimination in both.
Group differences in ESM results cannot be attributed to differences in patients' age, sex, handedness, IQ, or age of epilepsy onset. Moreover, both listener groups demonstrated normal hearing and brainstem auditory evoked responses, suggesting that filtered word recognition performance was not affected by subcortical auditory dysfunction, as shown recently (Wible et al., 2005). It may be argued that the presence of seizure disorders precludes generalization to other populations. However, this cannot explain the group differences observed because both groups comprised seizure patients. The higher rate of speech recognition difficulties in epilepsy patients compared with the normal population, although not well understood, underscores the utility of the epilepsy model for studies of auditory disorders. In addition to providing direct evidence for a neurological basis of impaired speech recognition, our findings suggest that failure to identify individual differences in speech recognition abilities may result in overestimating normal variability in cortical auditory representations.
Footnotes
This work was supported by National Institutes of Health Grant R01 DC-005645 and a Presidential Early Career Award in Science and Engineering. We thank Drs. Eva Ritzl, Lauren Moo, John Hart, Nathan Crone, and Christopher Bowers for the electrode maps.
Correspondence should be addressed to Dr. Dana Boatman, Department of Neurology, Johns Hopkins School of Medicine, 600 North Wolfe Street, Meyer 2-147, Baltimore, MD 21287. E-mail: dboatma@jhmi.edu.
Copyright © 2005 Society for Neuroscience 0270-6474/05/255475-06$15.00/0
References
- American Speech-Language and Hearing Association (1996) Central auditory processing: current status of research and implications for clinical practice. Am J Audiol 5: 41-54. [Google Scholar]
- Armitage P, Berry G (1994) Statistical methods in medical research. Oxford: Blackwell.
- Auditec (1984) NU-6 words. St. Louis: Auditec.
- Bamiou DE, Musiek FE, Sisodiya SM, Free SL, Mitchell TN, Davies RA (2004) Defective auditory interhemispheric transfer in a patient with a PAX6 mutation. Neurology 62: 489-490. [DOI] [PubMed] [Google Scholar]
- Binder JR, Liebenthal E, Possing ET, Medler DA, Ward BD (2004) Neural correlates of sensory and decision processes in auditory object identification. Nat Neurosci 7: 295-301. [DOI] [PubMed] [Google Scholar]
- Boatman D (2004) Cortical bases of speech perception: evidence from functional lesion studies. Cognition 92: 47-65. [DOI] [PubMed] [Google Scholar]
- Boatman D, Gordon B, Hart J, Selnes O, Miglioretti D, Lenz F (2000) Transcortical sensory aphasia: revisited and revised. Brain 123: 1634-1642. [DOI] [PubMed] [Google Scholar]
- Burnstine TH, Lesser RP, Hart Jr J, Uematsu S, Zinreich SJ, Krauss GL, Fisher RS, Vining EP, Gordon B (1990) Characterization of the basal temporal language area in patients with left temporal lobe epilepsy. Neurology 40: 966-970. [DOI] [PubMed] [Google Scholar]
- Davis MH, Johnsrude IS (2003) Hierarchical processing in spoken language comprehension. J Neurosci 23: 3423-3431. [DOI] [PMC free article] [PubMed] [Google Scholar]
- Estes RI, Jerger J, Jacobson G (2002) Reversal of hemispheric asymmetry on auditory tasks in children who are poor listeners. J Am Acad Audiol 13: 59-71. [PubMed] [Google Scholar]
- Gelman A, Carlin J, Stern H, Rubin D (1995) Bayesian data analysis. London: Chapman and Hall.
- Gordon B, Hart JJ, Boatman D, Lesser RP (1997) Cortical stimulation (interference) during behavior. In: Behavioral neurology and neuropsychology (Feinberg TE, Farah MJ, eds), pp 667-672. New York: McGraw-Hill.
- Green P (1995) Reversible jump Markov chain Monte Carlo computation and Bayesian model determination. Biometrika 82: 711-732. [Google Scholar]
- Howard MA, Volkov IO, Mirsky R, Garell PC, Noh MD, Granner M, Damasio H, Steinschneider M, Reale RA, Hind JE, Brugge JF (2000) Auditory cortex on the human posterior superior temporal gyrus. J Comp Neurol 416: 79-92. [DOI] [PubMed] [Google Scholar]
- Katz J (1997) CID auditory test W-22. Vancouver: Precision Acoustics.
- Keith R (1994) SCAN-A: a test of central auditory function for adolescents and adults. San Antonio, TX: Psychological Corporation.
- Klingberg T, Hedehus M, Temple E, Salz T, Gabrieli JD, Moseley ME, Poldrack RA (2000) Microstructure of temporo-parietal white matter as a basis for reading ability: evidence from diffusion tensor magnetic resonance imaging. Neuron 25: 493-500. [DOI] [PubMed] [Google Scholar]
- Lesser RP, Luders H, Klem G, Dinner DS, Morris HH, Hahn JF, Wyllie E (1987) Extraoperative cortical functional localization in patients with epilepsy. J Clin Neurophysiol 4: 27-53. [DOI] [PubMed] [Google Scholar]
- Liebenthal E, Binder JR, Spitzer SM, Possing ET, Medler DA (2005) Neural substrates of phonemic perception. Cereb Cortex, in press. [DOI] [PubMed]
- McCullagh P, Nelder JA (1989) Generalized linear models. London: Chapman and Hall.
- Miglioretti DL, Boatman D (2003) Modeling variability in cortical representations of human complex sound perception. Exp Brain Res 153: 382-387. [DOI] [PubMed] [Google Scholar]
- Miglioretti DL, McCulloch C, Zeger SL (2000) Template mixture models for direct cortical electrical interference data. Biostatistics 1: 403-421. [DOI] [PubMed] [Google Scholar]
- Nabelek AK, Pickett JM (1974) Reception of consonants in a classroom as affected by monaural and binaural listening, noise, reverberation, and hearing aids. J Acoust Soc Am 56: 628-639. [DOI] [PubMed] [Google Scholar]
- Ojemann GA (1979) Individual variability in cortical localization of language. J Neurosurg 50: 164-169. [DOI] [PubMed] [Google Scholar]
- Poldrack RA, Temple E, Protopapas A, Nagarajan S, Tallal P, Merzenich M, Gabrieli JD (2001) Relations between the neural bases of dynamic auditory processing and phonological processing: evidence from fMRI. J Cogn Neurosci 13: 687-697. [DOI] [PubMed] [Google Scholar]
- Rauschecker JP, Tian B (2000) Mechanisms and streams for processing of “what” and “where” in auditory cortex. Proc Natl Acad Sci USA 97: 11800-11806. [DOI] [PMC free article] [PubMed] [Google Scholar]
- Rauschecker JP, Tian B (2004) Processing of band-passed noise in the lateral auditory belt cortex of the rhesus monkey. J Neurophysiol 91: 2578-2589. [DOI] [PubMed] [Google Scholar]
- Scott SK, Blank CC, Rosen S, Wise RJ (2000) Identification of a pathway for intelligible speech in the left temporal lobe. Brain 123: 2400-2406. [DOI] [PMC free article] [PubMed] [Google Scholar]
- Warrier CM, Johnson KL, Hayes EA, Nicol T, Kraus N (2004) Learning impaired children exhibit timing deficits and training-related improvements in auditory cortical responses to speech in noise. Exp Brain Res 157: 431-441. [DOI] [PubMed] [Google Scholar]
- Wible B, Nicol T, Kraus N (2005) Correlation between brainstem and cortical auditory processes in normal and language-impaired children. Brain 128: 417-423. [DOI] [PubMed] [Google Scholar]