

Abstract
Humans and old world primates have trichromatic color vision based on three spectral types of cone [long-wavelength (L-), middle-wavelength (M-), and short-wavelength (S-) cones]. All other placental mammals are dichromats, and their color vision depends on the comparison of L- and S-cone signals; however, their cone-selective retinal circuitry is still unknown. Here, we identified the S-cone-selective (blue cone) bipolar cells of the mouse retina. They were labeled in a transgenic mouse expressing Clomeleon, a chloride-sensitive fluorescent protein, under the control of the thy1 promoter. Blue-cone bipolar cells comprise only 1-2% of the bipolar cell population, and their dendrites selectively contact S-opsin-expressing cones. In the dorsal half of the mouse retina, only 3-5% of the cones express S-opsin, and they are all contacted by blue-cone bipolar cells, whereas all L-opsin-expressing cones (∼95%) are avoided. In the ventral mouse retina, the great majority of cones express both S- and L-opsin. They are not contacted by blue-cone bipolar cells. A minority of ventral cones express S-opsin only, and they are selectively contacted by blue-cone bipolar cells. We suggest that these are genuine S-cones. In contrast to the other cones, their pedicles contain only low amounts of cone arrestin. The blue-cone bipolar cells of the mouse retina and their cone selectivity are closely similar to primate blue-cone bipolars, and we suggest that they both represent the phylogenetically ancient color system of the mammalian retina.
Keywords: retina, S-cones, L-cones, color vision, bipolar cells, mice
Introduction
In humans and old world primates, three types of cone respond selectively to photons in different regions of the visible spectrum: long-wavelength- (red or L-), middle-wavelength- (green or M-), and short-wavelength- (blue or S-) sensitive cones (Calkins and Sterling, 1999; Nathans, 1999). Comparison of L- and M- signals form a chromatic channel that mediates red-green discrimination. The anatomical substrates for this channel in the primate retina are midget bipolar and midget ganglion cells (Martin, 1998). A second, blue-yellow channel operates by comparing S-cone signals against some combination of L- and M-cone signals. The anatomical substrates for this channel are S-cone-selective (blue cone) bipolar cells and small bistratified ganglion cells (Mariani, 1984; Kouyama and Marshak, 1992; Dacey and Lee, 1994) (for review, see Dacey and Packer, 2003). Placental mammals other than primates have only two types of cone: L-cones in which the visual pigment has an absorption maximum at >500 nm and S-cones with an absorption maximum at <500 nm. They are, therefore, dichromats (Jacobs, 2002).
In an evolutionary comparison of color pigments, it has been estimated that the L-/M- separation in the old world primate lineage occurred ∼35 million years ago (Nathans et al., 1986). The separation of the L- and S-cone pigments occurred >500 million years ago and thus represents the phylogenetically ancient, primordial color system (Mollon, 1989). The morphological details of this subsystem have been described only in primates, and whether it represents the dichromatic color system, present in all mammals, lacks definite demonstration. So far, only circumstantial evidence for the existence of blue-cone bipolar cells in mammals other than primates has been presented [rabbit (Famiglietti, 1981), cat (Cohen and Sterling, 1990), rat (Euler and Wässle, 1995), and mouse (Ghosh et al., 2004; Pignatelli and Strettoi, 2004)]. Because S-cones show very specific distributions across the retina in different mammals, such as the S-cone-rich area in the ventral retina of mice and rabbits, one also has to ask how an S-cone-selective channel has adapted to such variations (Szél et al., 2000).
By using a transgenic mouse that expresses Clomeleon (Kuner and Augustine, 2000; Kuner et al., 2002), a genetically encoded fluorescent indicator for [Cl-], we were able to study the S-cone-selective pathway in the retina. Originally, this line was generated with the goal of recording intracellular [Cl-] in neurons of different brain areas. The known position effect variegation of the thy1 promoter (Feng et al., 2000) driving Clomeleon expression resulted in a transgenic line with highly specific expression in subclasses of ganglion cells, amacrine cells, and bipolar cells of the retina. Among the bipolar cells, we were able to morphologically identify the S-cone-selective (blue cone) type and to study their cone-selective contacts and retinal distribution.
Materials and Methods
Wild-type mice (C57/BL6J) and transgenic mice expressing Clomeleon, a genetically encoded ratiomeric fluorescent indicator for [Cl-] under the thy1 promoter, were used (Kuner and Augustine, 2000; Kuner et al., 2002). They were deeply anesthetized with halothane (4% in oxygen) and killed by cervical dislocation. All procedures were approved by the local animal care committee and were in accordance with the law of animal experimentation issued by the German government (Tierschutzgesetz). The eyes were removed and dissected, and the posterior eyecup containing the retina was immediately immersed in 4% (w/v) paraformaldehyde in 0.1 m phosphate buffer, pH 7.4, for 15-30 min. After fixation, the retina was dissected from the eyecup. For frozen sections, it was cryoprotected in graded sucrose solutions (10, 20, and 30% w/v, respectively), and cryostat sections were cut at 14 μm, mounted, and stored at -20°C. For vibratome sections, the retina was embedded in 2% agar, and 60- μm-thick sections were cut. For retinal whole mounts, the tissue was cryoprotected and frozen and thawed several times. Vibratome sections and whole mounts were processed free-floating.
Antibodies. Clomeleon consists of Topaz, a variant of the yellow fluorescent protein and cyan fluorescent protein fused together. Hence, it is already visible without immunostaining because of its green/yellow fluorescence. However, by applying the following antibodies against green fluorescent protein (GFP), the fluorescence signal was substantially increased: rabbit anti-GFP (1:2000; Molecular Probes, Eugene, OR) and mouse anti-GFP (1:500; Chemicon, Temecula, CA). The following antibodies against cone opsins were used: rabbit polyclonal antibodies against S-opsin (1:5000) and L-opsin (1:1000), kindly provided by Dr. J. Nathans (John Hopkins University, Baltimore, MD), and goat anti-S-opsin (1:1000) from Santa Cruz Biotechnology (Santa Cruz, CA). Cone pedicles were labeled by the application of the following antibodies: (1) mouse cone arrestin (rabbit anti-mCAR; 1:10,000; kind gift from Drs. X. Zhu and C. M. Craft, Mary D. Allan Laboratories, Los Angeles, CA) (Zhu et al., 2002); (2) kinesin, which labels the synaptic ribbons (mouse anti-kinesin II; 1:50; Babco, Richmond, CA); (3) the glutamate receptor subunit GluR5, which is expressed at the postsynaptic partners (goat anti-GluR5N; 1:100; Santa Cruz Biotechnology). Cones were labeled with a guinea pig antiserum against glycogen phosphorylase (1:1000; kind gift from Dr. B. Hamprecht, University of Tübingen, Tübingen, Germany) (Pfeiffer-Guglielmi et al., 2003).
Antibodies were diluted in PBS, pH 7.4, containing 3% normal donkey serum, 0.5% Triton X-100, and 0.05% sodium azide. Immunocytochemical labeling was performed using the indirect fluorescence method. Cryostat and vibratome sections were incubated overnight in the primary antibodies, followed by incubation (1 h) in the secondary antibodies, which were conjugated to either Alexa TM 488 (green fluorescence; Molecular Probes) or to cyanine 3 (Cy3; red fluorescence; Dianova, Hamburg, Germany). In double-labeling experiments, sections were incubated in a mixture of primary antibodies, followed by a mixture of secondary antibodies. Whole mounts were incubated for 2 d in the primary and for 2 h in the secondary antibody solution.
Light microscopy. Fluorescent specimens were viewed with a Zeiss (Oberkochen, Germany) Axiophot microscope equipped with a fluorescence filter set that was shift corrected. Black-and-white digital images were taken using a cooled CCD camera (Spot 2; Diagnostic Instruments, Sterling Heights, MI). Low-power micrographs of retinal whole mounts were taken with the 2.5× Plan Neofluar objective, and topographical maps of the retinas were assembled as mosaics from four single micrographs. The topographical maps were used to take high-power confocal images at defined retinal locations. Confocal micrographs were taken using a Zeiss LSM Pascal fluorescence microscope equipped with an argon and a HeNe laser. High-resolution scanning was performed with a Plan-apochromate 63/1.4× objective and with 2048 × 2048 pixels. Usually, a stack of 12 sections was taken from the inner nuclear layer (INL) to the outer plexiform layer (OPL) (z-axis step size, 0.6 μm). Another stack was afterward taken from the cone pedicles to the cone outer segments. The cell contacts were analyzed by looking through the individual sections. The dendritic trees were constructed by collapsing the stacks into a single plane.
The coexpression of S- and L-opsin in cone outer segments was measured by double labeling whole-mounted retinas for the two opsins. High-power, confocal micrographs of the red (rabbit anti-L-opsin) and the green (goat anti-S-opsin) channel were taken, printed separately, and all labeled cone outer segments were marked. Afterward, the prints were superimposed, and single- or double-labeled outer segments were identified. In control experiments, we performed line scans through the cone outer segments (Metaview 4.01; Diagnostic Instruments). The average gray levels of the background of the red and green channels and their SDs were measured. If the intensity level of a cone outer segment deviated >3 SDs from the average background gray level, it was assumed to be labeled. Both the subjective estimates and the line-scan measurements gave identical results. The brightness and the contrast of the final images were adjusted using Photoshop 5.5 (Adobe Systems, San Jose, CA).
Results
Blue-cone bipolar cells of the mouse retina
Multiple cell types showed green/yellow fluorescence in the retinas of mice expressing Clomeleon under the control of the thy1 promoter. For our anatomical studies, the fluorescence signal was greatly increased by staining the retinas immunocytochemically with antibodies against GFP. The great majority of ganglion cells, few amacrine cells, and ∼5% of the bipolar cells were labeled. Among the bipolar cells, a type with long, meandering dendrites showed particularly strong immunofluorescence (Fig. 1). In vertical sections, their axons could be observed descending into the innermost region of the inner plexiform layer (IPL), in which they formed sparsely branched axon terminal systems in stratum 5 (average width, 36 ± 6.5 μm; average height, 9.2 ± 2.5 μm) (Fig. 1A). In flat-mounted retinas (Fig. 1B), the dendrites from several neighboring bipolar cells converge onto points of contact (encircled), which will be shown later to represent the synaptic complexes of individual cones, the cone pedicles. The contacts can also be observed in the vertical sections (Fig. 1A, arrowhead). The dendritic branching pattern of these bipolar cells is very reminiscent of the blue-cone bipolar cells of the primate retina (Mariani, 1984; Kouyama and Marshak, 1992). As indicated by the small arrows in Figure 1B, we also observed fine processes on these bipolar cells, which terminated abruptly at the outer border of the INL. These processes have also been observed on the blue-cone bipolar cells of the monkey retina, in which they were named “blind endings,” because they never ended in the receptor plane so they could not make synaptic contacts with cone pedicles or rod spherules (Kouyama and Marshak, 1992; Wässle et al., 1994; Herr et al., 2003). It is only in the projection of the confocal stacks that they appear in the cone pedicle layer of Figure 1B. Figure 1C shows flat-mounted peripheral macaque monkey retina with blue-cone bipolar cells selectively labeled for cholecystokinin (CCK) (Kouyama and Marshak, 1992). CCK immunolabeling revealed blue-cone bipolar cells in macaque monkeys and in the marmoset monkey (Luo et al., 1999) but not in other species. The long, meandering dendrites converging onto putative S-cone pedicles (encircled) of monkey blue-cone bipolar cells are very similar to those of the mouse bipolar cells (Fig. 1B). In the following, it will be shown that they are the S-cone-selective (blue cone) bipolar cells of the mouse retina.
Figure 1.

Blue-cone bipolar cells of the mouse and the macaque monkey retina. A, Vertical view of Clomeleon/GFP-labeled cells in a vibratome section through the retina of a Clomeleon-expressing mouse (confocal stack, collapsed into a single plane). GCL, Ganglion cell layer. Many ganglion cells and their dendrites in the IPL are labeled. Two bipolar cells are also labeled. Their cell bodies are in the outer INL, and their axons descend into the innermost IPL, where they terminate in small axonal varicosities (left cell). Originating from the cell body are several fine, long dendrites that converge onto a putative cone pedicle (arrowhead). B, Horizontal view of the bipolar cells in a whole-mounted retina (dorsal retina, confocal stack, collapsed into a single plane). The cell bodies of putative blue-cone bipolar cells are indicated by asterisks. Long, meandering dendrites originate from the cell bodies and converge onto putative cone pedicles (circles). Blind endings are marked by the small arrows. They are confined to the outer INL. C, Horizontal view of blue-cone bipolar cells in a whole-mounted macaque monkey retina that was immunostained for CCK (Nomarski micrograph, immunoperoxidase staining) (for additional details, see Wässle et al., 1994). Cell bodies of blue-cone bipolar cells are marked by asterisks, and putative S-cone pedicles are marked by circles. Scale bar: (in B) A, 28.7 μm; B, C, 20 μm.
Cone selectivity of blue-cone bipolar cells
For this purpose, mouse retinas were immunostained for S-opsin. As described previously, the pattern of distribution of S-cones, with a high density area in the ventral retina, was observed (Szél et al., 1992; Ahnelt and Kolb, 2000; Applebury et al., 2000). Although the S-opsin is expressed primarily in the outer segments, we were able to induce a redistribution of the S-opsin into the cone axons and pedicles by keeping the mice in light for 5 d (Organisciak and Winkler, 1994). Figure 2A shows a vertical section that was double labeled for the S-opsin (red) and for Clomeleon/GFP (green). As indicated by the arrowhead, the S-cone pedicle is contacted by the bipolar cell dendrite. The cone is not perfectly vertically oriented, causing a displacement between the outer segment and the pedicle. The cell bodies of several other cones in Figure 2A also express S-opsin; however, their axons are only very faintly labeled. The light-induced redistribution of the S-opsin into the cone axons was preferentially observed in S-cones that were contacted by blue-cone bipolar cells. Their cell bodies were often found at a more inner position than the cell bodies of the other cones (Fig. 2A, arrow).
Figure 2.
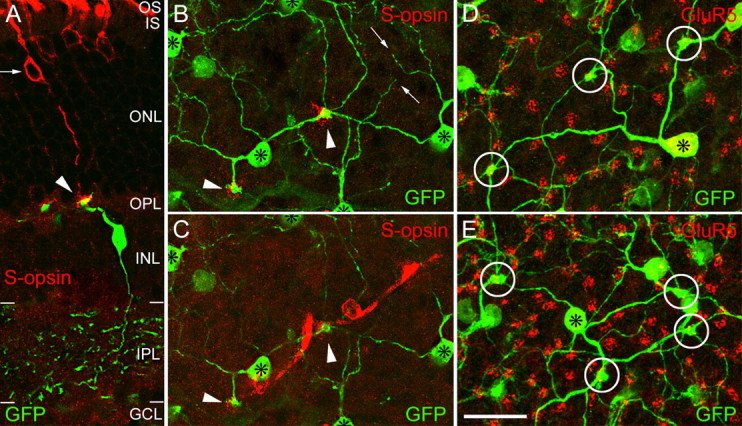
Blue-cone bipolar cells selectively contact S-opsin-expressing cones. A, Vertical view of a blue-cone bipolar cell (green) contacting a cone (red) that expresses S-opsin (ventral retina, single optical section). The arrow points to the cell body of the cone; the arrowhead points to the cone pedicle. OS, Outer segments; IS, inner segments; ONL, outer nuclear layer; GCL, ganglion cell layer. B and C show the same field from the dorsal part of a whole-mounted retina that was double labeled for Clomeleon/GFP (green) and for S-opsin (red). B, In this view (collapsed confocal stack of the INL and OPL), the cell bodies of the blue-cone bipolars (*) and their long dendrites are shown. Two S-opsin-expressing pedicles (red) are marked by arrowheads. Blind endings are marked by the small arrows. They are confined to the INL. C, In this view (collapsed confocal stack of the outer retina), two S-opsin-expressing cones, their pedicles, cell bodies, and outer segments are shown in red. The pedicles (arrowheads) are contacted by the dendrites of the blue-cone bipolar cells. D, E, Horizontal views of two different areas of a whole-mounted retina (collapsed confocal stacks) double labeled for Clomeleon/GFP (green) and for GluR5 (red). The clusters of GluR5 puncta represent individual cone pedicles. D, The dendrites of the blue-cone bipolar cell (*) contact three cone pedicles (circles) and avoid all other pedicles (n = 51). E, The blue-cone bipolar cell in the center (*) contacts four cone pedicles in this field and avoids all other cone pedicles (n = 78). Scale bar: (in E) 20 μm.
Figure 2, B and C, shows projections of a confocal stack taken through a small field of the dorsal retina. Two S-cones (Fig. 2C) and five bipolar cell perikarya (Fig. 2B, asterisks) can be detected. The two S-cones (outer segment, perikaryon, and pedicle) have an oblique orientation (Fig. 2C), and the pedicles are indicated by arrowheads in Figure 2, B and C. Inspection of the converging bipolar cell dendrites in Figure 2B shows that they are heading toward the S-cone pedicles for their contacts. We therefore conclude that they are the blue-cone bipolar cells of the mouse retina.
On their winding course to S-cone pedicles, the dendrites skip many other cone pedicles. This is shown in Figure 2, D and E, by labeling all cone pedicles for the kainate receptor GluR5. As we have shown previously (Haverkamp et al., 2001), clusters of GluR5 puncta are expressed by OFF-cone bipolar cell dendrites at their contacts with cone pedicles. At the position of S-cone pedicles, only few GluR5 puncta have been observed. This will be shown in more detail later. Three pedicles (circles) are selectively innervated in Figure 2D by the blue-cone bipolar cell marked by the asterisk, and all other cone pedicles are avoided. The cell marked by the asterisk in Figure 2E contacts four pedicles indicated by circles. Comparable with the primate retina, blue-cone bipolar cells contacted between one and five S-cone pedicles (convergence; average, 1.9 ± 0.8; n = 68). Similar numbers were also found for the divergence of the S-cone signal (average, 2.3 ± 0.8; n = 55). The pedicle in the center of Figure 2B synapsed onto at least four surrounding blue-cone bipolar cells, whereas the pedicle in the bottom left of Figure 2B contacted only one blue-cone bipolar cell.
Topography of blue-cone bipolar cells
S-cones of the primate retina follow the general cone density gradient and comprise ∼10% of all cones; however, they are absent from the foveola. Cones expressing S-opsin in the mouse retina have a very uneven distribution: in the ventral half of the retina, nearly all cones express S-cone opsin, and their density is ∼10,000 cells/mm2. In the dorsal half of the retina, cones expressing L-opsin predominate, and the density of S-opsin-labeled cones drops to <500 cells/mm2 (Szél et al., 1992; Ahnelt and Kolb, 2000; Fei and Hughes, 2001). In the intermediate zone, cones express both S- and L-opsins (Glösmann and Ahnelt, 1998; Lyubarsky et al., 1999; Lukáts et al., 2005). Some authors claim that all cones of the mouse retina are dual opsin cones, and there is basically only one cone type in the mouse retina (Applebury et al., 2000). The spectral sensitivity of cones in the neural retina leucine zipper mouse retina has been studied recently (Nikonov et al., 2005), and the coexpression ratio of L- and S-pigment varied from 1:1 to 1:3000.
We stained whole, flat-mounted mouse retinas (n = 4) for the S-cone opsin and observed a sharp drop in the density of labeled cones between ventral and dorsal retina (Fig. 3A). Within <300 μm, the density declined from 10,000 to <500 cells/mm2 (Fig. 3E). The same retinas were also immunostained for GFP (Fig. 3B), and blue-cone bipolar cells were recognized because of their distinct morphology (Fig. 3B, asterisks). From the convergence of blue-cone bipolar cell dendrites onto cone pedicles, their S-cone contacts could be identified (Fig. 3B, C, circles). In the same retinas, we also labeled all cone pedicles with antibodies against kinesin and GluR5 (Fig. 3C). Finally, in Figure 3D, the plane of focus is moved toward the cone outer segments, and they are labeled for S-opsin. The graph in Figure 3E shows measurements made along the zone of transition from dorsal to ventral retina and displays the density of S-cone opsin-expressing cones (filled circles), the density of blue-cone bipolar cells (asterisks), and the density of cone pedicles (open circles) contacted. The result is unexpected: whereas the S-opsin-expressing cones increase from ∼500 to 10,000 cells/mm2, both the number of blue-cone bipolar cells and the number of their cone pedicle contacts do not change significantly. The field in Figure 3B-D was taken from the region of highest density of S-opsin-expressing cones in the ventral retina (Fig. 3D). Blue-cone bipolar cells contact only 5% of them and thus select a subpopulation of the S-opsin-expressing cones. In the dorsal retina, in which only few S-cone-expressing cones are found, they are all contacted by the blue-cone bipolar cells. Thus, we find that blue-cone bipolar cells occur at a density of 300-600 cells/mm2 across the whole retina and contact between 300 and 600 putative S-cone pedicles, regardless of the number of S-opsin-expressing cones. From this result, we conclude that there are two populations of S-opsin-expressing cones, those that are contacted by blue-cone bipolar cells, tentatively named genuine S-cones, and those that are avoided by blue-cone bipolar cells. Genuine S-cones comprise all S-opsin-expressing cones in the dorsal retina but are only a small fraction (5%) of them in the ventral retina. Their density across the retina does not change significantly, and they comprise 3-5% of the total cone population. The density of blue-cone bipolar cells was found to be 300-600 cells/mm2 (Fig. 3E). Given a total bipolar cell density of 40,000 cells/mm2 (Jeon et al., 1998), blue-cone bipolar cells represent only ∼1% of the bipolar cell population.
Figure 3.
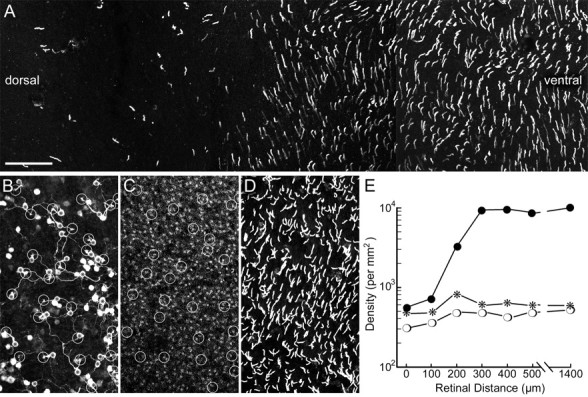
Distribution of blue cones across the mouse retina. A, Horizontal view of S-opsin-expressing cone outer segments in a whole-mounted mouse retina. In the dorsal retina (left), only few cones express S-opsin; in the ventral retina, the vast majority of cones express S-opsin (right). B, C, and D show the same field from the ventral retina that was immunolabeled for GFP, kinesin and GluR5, and S-opsin. B, Clomeleon/GFP-immunoreactive bipolar cells. The blue-cone bipolar cells (n = 30) and their cone pedicle contacts (n = 28) are marked by asterisks and circles, respectively. C, The ribbons of rod spherules and cone pedicles were revealed here with antibodies against kinesin (Muresan et al., 1999). However, in the mouse retina, it is difficult to recognize cone pedicles in kinesin-labeled whole mounts. Therefore, they were made visible in addition by an antibody against GluR5 (Haverkamp et al., 2001). Both kinesin and GluR5 antisera were recognized by Cy3-coupled secondary antibodies. All together, 528 cone pedicles can be found in C, and those that are contacted in B are encircled. D, All together, 493 S-opsin-expressing cones are found in this patch of retina. Comparable fields were evaluated along a dorsoventral intersect, and the graph in E shows the changes in density along the zone of transition between dorsal and ventral retina. E, The abscissa shows the retinal distance: 0 corresponds to the left part, 500 μm to the right part of A. At a distance of 1400 μm, a field far in the ventral retina was measured. The ordinate shows density on a logarithmic scale. Open circles represent cone pedicles contacted by blue-cone bipolar cells, asterisks represent blue-bipolar cells, and filled circles represent S-opsin-expressing cones. Measurements from 17 fields taken from four retinas showed that the density ratio of blue-cone bipolar cells to blue-cone pedicles was 1.17 ± 0.1 (mean ± SD). Scale bar: (in A) A, 50 μm; B-D, 66 μm.
Genuine S-cones of the mouse retina express no L-opsin
If all cones of the mouse retina express both S- and L-opsin, it is difficult to gain chromatic information from their light signals (Applebury et al., 2000; Neitz and Neitz, 2001; Lukáts et al., 2005). Chromatic signals would be optimal if light responses from one type of cone exclusively expressing S-opsin are compared with the signals of another class exclusively expressing L-opsin. We therefore double labeled whole mounts of mouse retinas for S- and for L-opsins (Fig. 4) and identified cones that express S-opsin only (as described in Materials and Methods). In the dorsal retina, 3-5% of all cones express S-opsin, and the remaining cones express L-opsin (Fig. 4A). The great majority of the S-opsin-labeled cones did not express any detectable amounts of L-opsin. Hence, there appears a clear segregation in the dorsal retina. In the ventral retina, we found that nearly all cones express S-opsin and most cones also express L-opsin at varying amounts (Fig. 4B). However, in a minority of ∼8-20% of the S-opsin-labeled cones, we did not observe any signs of L-opsin labeling. Thus, both in ventral and dorsal retina, there are sufficient numbers of cones expressing only S-opsin that could be selectively innervated by the dendrites of blue-cone bipolar cells, thus forming a “clean” S-cone channel.
Figure 4.

S-opsin and L-opsin expression in the mouse retina. Horizontal view of a whole-mounted retina with the focus on the cone outer segments. The retina was double immunostained for S-opsin (green) and L-opsin (red). As described in Materials and Methods, the label in the outer segment was quantified by a line scan measuring the intensities in the red and green channels. The hue of the outer segments in the two micrographs is only an approximation of the relative intensities. A, Field from the dorsal retina. Most cones (n = 238) express L-opsin (red), and only few cones (n = 7; marked by circles) express S-opsin (green). One cone (arrowhead) was double labeled. B, Field from the ventral retina (300 μm away from the zone of transition). Most cones (n = 189) express various amounts of both S- and L-opsin. The cones marked by circles (n = 19) express only S-opsin; the remaining 57 cones express only L-cone opsin. C, A line scan was performed along the oblique white line in B. The line scan intersects four cone outer segments and the white circle. The cone within the white circle (arrow) expresses S-opsin but no significant amount of L-opsin. Scale bar: (in B) 50 μm.
Next, we showed more directly that blue-cone bipolar cells select cones devoid of L-opsin. Clomeleon expressing retinas were triple immunolabeled: (1) for GFP to reveal blue-cone bipolar cells and delineate the S-cone pedicles they contact; (2) for glycogen phosphorylase (Pfeiffer-Guglielmi et al., 2003), which stains mouse cones from their pedicles to their outer segments; and (3) for L-opsin, which is found in the outer segments.
A vertical section through the dorsal part of such a triple-immunolabeled retina is shown in Figure 5A. The blue-cone bipolar cell contacts two cone pedicles. Tracing their axons toward their perikarya (asterisk) and outer segment shows that the two cones do not express L-opsin in their outer segments. From such triple-labeled retinal whole mounts, we could follow individual cones in confocal stacks from their pedicles to their outer segments (Figs. 5B-E). Four pedicles are contacted by blue-cone bipolar cell dendrites in Figure 5B (encircled). It was possible to follow the labeled cones through the stack up to their outer segments (Fig. 5C). The four outer segments are indicated by the arrows and in contrast to their neighbors, no L-opsin label can be detected. In the high-power micrograph (Fig. 5D), a single cone pedicle is contacted by the converging blue-cone bipolar cell dendrites. Following the parent cone up to the outer segment (Fig. 5E, arrow) shows that it does not express L-opsin. A total of 60 cones contacted by blue-cone bipolar cells was analyzed, and in all of them, L-cone opsin was absent from the outer segments. The cones were sampled from four different fields across the retina. Thus, genuine S-cones express S-opsin only and no detectable amounts of L-opsin.
Figure 5.
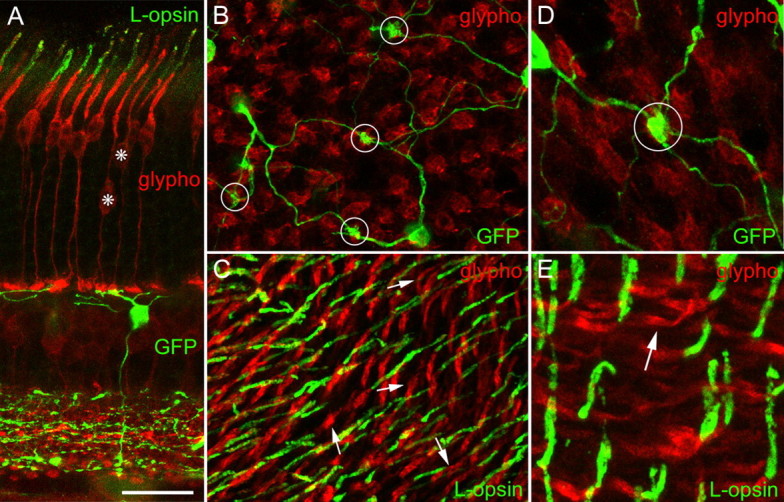
Genuine blue cones do not express detectable amounts of L-opsin. A, Vertical section of dorsal mouse retina immunostained for glycogen phosphorylase (glypho; red), L-opsin (outer segments; green), and GFP (bipolar cell and IPL; green) (confocal stack of a vibratome section, collapsed into 1 plane). The two cones (*) contacted by the blue-cone bipolar cell do not express L-opsin in their outer segments. B and C show the same field of the dorsal retina of a whole mount of the mouse retina that was triple labeled for GFP (green), glypho (red), and L-opsin (green). A confocal stack was taken from the OPL to the outer segments, and two optical sections are presented. B, With the focus in the OPL, dendrites of blue-cone bipolar cells converging onto four cone pedicles (circles) can be seen. By gradually moving the plane of focus to the outer segments, it was possible to follow an individual cone all the way from the pedicle to its outer segment. C, With the focus in the plane of the outer segments, L-opsin expression (green) can be detected. The four cones identified in B express no L-opsin in their outer segments (arrows). D and E show a field from the dorsal retina at higher magnification. D, The cone pedicle contacted by blue bipolar cell dendrites is encircled. E, The outer segment of this cone (arrow) does not express L-opsin. Scale bar: (in A) A-C, 20 μm; D, E, 11 μm.
Mouse cone arrestin is greatly reduced in genuine S-cone pedicles
It has been shown that mCAR is expressed in cone photoreceptors (Zhu et al., 2002). When we immunostained mouse retinal whole mounts for mCAR, we observed distinct labeling of the cone pedicles (Fig. 6A). However, within the cone pedicle mosaic, we observed some pedicles that were only very faintly labeled (encircled). When the same retina was double labeled for glycogen phosphorylase, we also observed crisp labeling of cone pedicles (Fig. 6B); however, the faintly mCAR-positive pedicles were prominently labeled. This finding was similar in dorsal and ventral retina. We tested whether these faintly mCAR-positive cone pedicles are genuine S-cone pedicles and applied mCAR immunostaining to Clomeleon/GFP-labeled retinas (Fig. 6C). From the converging dendrites, we defined the location of the true S-cone pedicles (Fig. 6C, encircled), and, as shown in Figure 6D, hardly any traces of mCAR can be detected in these positions, whereas other pedicles are well stained. Thus, pedicles of genuine S-cones show a greatly reduced expression of mCAR.
Figure 6.
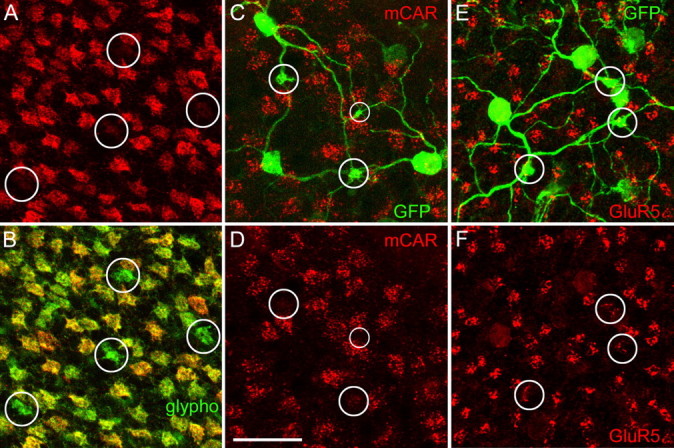
Characterization of genuine S-cone pedicles. All micrographs show horizontal views of whole-mounted retinas with the focus on the outer plexiform layer. A and B show a retina that was double labeled for mCAR (red) and glycogen phosphorylase (glypho; green). A, The mCAR-immunoreactive cone pedicles form a regular mosaic, with the encircled pedicles being only very faintly labeled. B, Same field as in A, mCAR immunoreactivity in red, glypho immunoreactivity in green. The four cone pedicles encircled in A are strongly glypho positive. C and D show a retina that was double labeled for mCAR (red) and for Clomeleon/GFP (green). C, Three putative true S-cone pedicles (circles) are defined by the convergence of blue-cone bipolar cell dendrites (green). Cone pedicles are labeled for mCAR (red). D, mCAR-immunolabeled cone pedicles. The expression mCAR is very weak at the true S-cone pedicles (circles). E and F show a retina that was double labeled for Clomeleon/GFP (green) and for the kainate receptor subunit GluR5 (red). E, Three putative true S-cone pedicles are encircled. F, At the position of the true S-cone pedicles, the numbers of GluR5 puncta are significantly reduced. Scale bar: (in D) 20 μm.
It has been observed in primates and ground squirrels that the kainate receptor subunit GluR5 shows a reduced expression at S-cone pedicles (Haverkamp et al., 2001; Li and DeVries, 2004). The same holds for genuine S-cone pedicles of the mouse retina. Figure 6E shows a whole mount that was double labeled for Clomeleon/GFP and for GluR5. Putative genuine S-cone pedicles are encircled. Figure 6F shows only the GluR5 clusters at the cone pedicles. The density of GluR5 puncta was reduced at the genuine S-cone pedicles.
In conclusion, genuine S-cones can be defined not only by their contacts with S-cone bipolar cells but also by their pedicles expressing only low amounts of mCAR immunoreactivity. Similarly, only few GluR5 puncta are observed at such pedicles. Genuine S-cones thus appear to represent a distinct type of cone.
Discussion
The blue-cone circuit of the mammalian retina
Blue-cone bipolar cells of the mouse are in many respects similar to those of the primate retina. First, their long meandering dendrites display blue-cone selectivity. Second, individual blue-cone bipolar cells contact between one and five S-cone pedicles (convergence), whereas S-cone pedicles are contacted by the dendrites of one to five blue-cone bipolar cells (divergence). Third, the density ratio of blue-cone bipolar cells to blue cones is between one and two in the primate (Kouyama and Marshak, 1992, 1997; Wässle et al., 1994; Schein et al., 2004) and 1.17 in the mouse retina (Fig. 3). In addition, their dendrites tile the retina (Fig. 3B), and their cell bodies appear equally spaced. Comparable with primate blue-cone bipolar cells, we also observed long, thin dendrites that stopped abruptly without making obvious contacts (Mariani, 1984; Kouyama and Marshak, 1992; Herr et al., 2003). In some cases, we observed these long dendrites making “kissing junctions” with the dendrites of other blue-cone bipolar cells; however, we were not able, because of the limited resolution of light microscopy, to prove that they make contacts. It thus appears plausible that the blue-cone bipolar cells of the mouse retina, revealed here by selective expression of Clomeleon, are homologous to primate blue-cone bipolar cells.
Because it is known that other mammals such as cats or rabbits also have blue cones and dichromatic color vision (Jacobs, 2002), we suggest that such blue-cone bipolar cells are present in the retinas of all those mammals and are thus the substrate of the phylogenetically ancient, primordial color system of placental mammals. Blue-cone bipolar cells comprise only 1.5% of the bipolar cells in primates (Kouyama and Marshak, 1992; Martin and Grünert, 1992) and 1% in mice. They are rare, and this may be the reason why their circuitry has not yet been described in other mammals. However, from intracellular injections of bipolar cells in rats and mice, cells of comparable shapes have been described (Euler and Wässle, 1995; Ghosh et al., 2004; Pignatelli and Strettoi, 2004). In ground squirrels, bipolar cell type B1 has been suggested to represent a blue-cone bipolar cell (Linberg et al., 1996). In the rabbit and in the cat retina, a wide-field bipolar cell has been described (Famiglietti, 1981; Cohen and Sterling, 1990; Jeon and Masland, 1995), which appears to be a good candidate for a blue-cone bipolar cell.
The axons of blue-cone bipolar cells terminate in sublamina 5 of the IPL, close to the ganglion cell layer, suggesting they are ON bipolar cells. In the primate retina, they innervate the inner stratum of bistratified ganglion cells, the blue ON, yellow OFF ganglion cells (Dacey, 2000). Recently, a flat (OFF) midget bipolar cell has been described in the primate retina (Klug et al., 2003) as well as additional blue-cone-selective ganglion cells (Dacey and Packer, 2003). Nothing is known about the morphological types of ganglion cells innervated by blue-cone bipolar cells in the mouse retina. However, the mouse retina has several types of bistratified ganglion cells, one of which could be a candidate for blue ON/yellow OFF cells (Sun et al., 2002).
Not all S-opsin-expressing cones are genuine blue cones
When cone-selective antibodies were applied to the mouse retina, it was observed that most cones in the ventral retina were apparently S-cones, whereas they were rare in the dorsal retina (Szél et al., 1992). However, it was surprising that this preponderance of S-cones in ventral retina was present in the house mouse but not in other closely related mice genera (Szél et al., 1994). Later, it was shown that many cones of the mouse express both L- and S-cone opsin (Glösmann and Ahnelt, 1998; Lukáts et al., 2005), and recently, it was suggested that all cones of the mouse retina are dual opsin cones (Applebury et al., 2000). We have shown here that in the dorsal retina, blue-cone bipolar cells contact all S-opsin-expressing cones, as expected for a blue color system. It came as a real surprise to us that in ventral retina blue-cone bipolar cells did not contact all S-opsin-expressing cones but selected only 5% of them. We could show that both in ventral and in dorsal retina, the cones contacted by blue-cone bipolar cells are cones that were immunolabeled for S-opsin only but not for L-opsin. Dual opsin-expressing cones were avoided. We could also show that cone pedicles contacted by blue-cone bipolar cells expressed only low amounts of cone arrestin (Fig. 6). In mice that were kept under a normal day and night cycle, S-opsin immunostaining was only observed in the outer segments. In mice that were exposed to light for 5 d, we found that cones contacted by blue-cone bipolar cells were S-opsin immunopositive throughout the cell, including the pedicle. Such complete staining was not observed in the other S-opsin-expressing cones (Fig. 2A). It is known from humans that blue cones are more sensitive to damage than the L/M cones (Wenzel et al., 2005). It is also known that prolonged light exposure causes photoreceptor damage (Organisciak and Winkler, 1994). From these two results, we suggest that genuine blue cones of the mouse retina are more susceptible to light damage than other cones, and the redistribution of S-opsin is a sign of mild light damage. Taking these findings together, the selective contacts made by blue-cone bipolars, the strongly reduced cone arrestin expression in the pedicles, and the S-opsin redistribution, we would suggest that genuine S-cones are a specific type of cone.
Color vision in the mouse
Color vision in the mouse has been measured by recordings of the electroretinogram (ERG) and by behavioral discrimination tests (Jacobs et al., 2004). Both spectral sensitivity functions from ERG measurements and from psychophysical tests revealed contributions from two classes of cones having peak sensitivities (λmax) at ∼360 and 510 nm. However, the relative contributions of the two pigment types to spectral sensitivity differed significantly in the two types of measurements. The S-cone pigment contributed a distinctly smaller signal to spectral sensitivity in the behavioral measurements than to the ERG signal. The results of the present study possibly explain this difference. The behavioral results are based on the small number of genuine blue cones, whereas the ERG results measure the contributions of all S-opsin-expressing cones.
Electrophysiological recordings from the mouse retina classified ganglion cells into three main groups according to their spectral sensitivity profile (Lyubarsky et al., 1999; Ekesten et al., 2000): one receiving input from S-cones, a second receiving input only from L-cones, and a third receiving inputs from both types of cones. The ventral retina contained a large proportion of the first group of ganglion cells. The dorsal retina and the zone of transition contained more of the latter two groups. A small fraction of cells was found that displayed antagonistic-like interaction between S- and L-cones. We suggest that these cells represent the color selective ganglion cells of the mouse retina, and their circuitry might be as follows: signals from the cones expressing high levels of S-opsin but no detectable levels of L-opsin are collected by the blue-cone bipolar cells, which, according to their IPL stratification, are ON bipolar cells. The spectral sensitivity of this channel will be tuned to short wavelengths. Signals from six to eight cones in the same patch of retina are collected by a diffuse OFF-cone bipolar cells. The spectral sensitivity of this channel will be shifted to longer wavelengths, because it is mediated by both S- and L-opsins. A bistratified ganglion cell receiving input from the blue-cone ON bipolar cell and the diffuse OFF bipolar cell would be S-ON and S plus M-OFF and thus chromatically opponent.
Footnotes
This work was supported by Deutsche Forschungsgemeinschaft Grant SFB269/B4. We thank B. Marshallsay and G.-S. Nam for excellent technical assistance, K. Berglund and K. Ghosh for critical reading this paper, and I. Odenthal for typing this article.
Correspondence should be addressed to Heinz Wässle, Max-Planck-Institut for Brain Research, Deutschordenstrasse 46, D-60528 Frankfurt/Main, Germany. E-mail: Waessle@mpih-frankfurt.mpg.de.
Copyright © 2005 Society for Neuroscience 0270-6474/05/255438-08$15.00/0
References
- Ahnelt PK, Kolb H (2000) The mammalian photoreceptor mosaic-adaptive design. Prog Retin Eye Res 19: 711-777. [DOI] [PubMed] [Google Scholar]
- Applebury ML, Antoch MP, Baxter LC, Chun LLY, Falk JD, Farhangfar F, Kage K, Krzystolik MG, Lyass LA, Robbins JT (2000) The murine cone photoreceptor: a single cone type expresses both S and M opsins with retinal spatial patterning. Neuron 27: 513-523. [DOI] [PubMed] [Google Scholar]
- Calkins DJ, Sterling P (1999) Evidence that circuits for spatial and color vision segregate at the first retinal synapse. Neuron 24: 313-321. [DOI] [PubMed] [Google Scholar]
- Cohen E, Sterling P (1990) Convergence and divergence of cones onto bipolar cells in the central area of cat retina. Philos Trans R Soc Lond B Biol Sci 330: 323-328. [DOI] [PubMed] [Google Scholar]
- Dacey DM (2000) Parallel pathways for spectral coding in primate retina. Annu Rev Neurosci 23: 743-775. [DOI] [PubMed] [Google Scholar]
- Dacey DM, Lee BB (1994) The “blue-on” opponent pathway in primate retina originates from a distinct bistratified ganglion cell type. Nature 367: 731-735. [DOI] [PubMed] [Google Scholar]
- Dacey DM, Packer OS (2003) Colour coding in the primate retina: diverse cell types and cone-specific circuitry. Curr Opin Neurobiol 13: 421-427. [DOI] [PubMed] [Google Scholar]
- Ekesten B, Gouras P, Yamamoto S (2000) Cone inputs to murine retinal ganglion cells. Vision Res 40: 2573-2577. [DOI] [PubMed] [Google Scholar]
- Euler T, Wässle H (1995) Immunocytochemical identification of cone bipolar cells in the rat retina. J Comp Neurol 361: 461-478. [DOI] [PubMed] [Google Scholar]
- Famiglietti EV (1981) Functional architecture of cone bipolar cells in mammalian retina. Vision Res 21: 1559-1563. [DOI] [PubMed] [Google Scholar]
- Fei Y, Hughes TE (2001) Transgenic expression of the jellyfish green fluorescent protein in the cone photoreceptors of the mouse. Vis Neurosci 18: 615-623. [DOI] [PubMed] [Google Scholar]
- Feng G, Mellor RH, Bernstein M, Keller-Peck C, Nguyen QT, Wallace M, Nerbonne JM, Lichtman JW, Sanes JR (2000) Imaging neuronal subsets in transgenic mice expressing multiple spectral variants of GFP. Neuron 28: 41-51. [DOI] [PubMed] [Google Scholar]
- Ghosh KK, Bujan S, Haverkamp S, Feigenspan A, Wässle H (2004) Types of bipolar cells in the mouse retina. J Comp Neurol 469: 70-82. [DOI] [PubMed] [Google Scholar]
- Glösmann M, Ahnelt PK (1998) Coexpression of M- and S-opsin extends over the entire inferior mouse retina. Invest Ophthalmol Vis Sci 39: S1059. [Google Scholar]
- Haverkamp S, Grünert U, Wässle H (2001) Localization of kainate receptors at the cone pedicles of the primate retina. J Comp Neurol 436: 471-486. [DOI] [PubMed] [Google Scholar]
- Herr S, Klug K, Sterling P, Schein S (2003) Inner S-cone bipolar cells provide all of the central elements for S cones in macaque retina. J Comp Neurol 457: 185-201. [DOI] [PubMed] [Google Scholar]
- Jacobs GH (2002) Comparative psychology of vision. In: Handbook of psychology (Gallagher M, Nelson RJ, eds), pp 47-70. New York: Wiley.
- Jacobs GH, Williams GA, Fenwick JA (2004) Influence of cone pigment coexpression on spectral sensitivity and color vision in the mouse. Vision Res 44: 1615-1622. [DOI] [PubMed] [Google Scholar]
- Jeon CJ, Masland RH (1995) A population of wide-field bipolar cells in the rabbits retina. J Comp Neurol 360: 403-412. [DOI] [PubMed] [Google Scholar]
- Jeon CJ, Strettoi E, Masland RH (1998) The major cell populations of the mouse retina. J Neurosci 18: 8936-8946. [DOI] [PMC free article] [PubMed] [Google Scholar]
- Klug K, Herr S, Ngo IT, Sterling P, Schein S (2003) Macaque retina contains an S-cone OFF midget pathway. J Neurosci 23: 9881-9887. [DOI] [PMC free article] [PubMed] [Google Scholar]
- Kouyama N, Marshak DW (1992) Bipolar cells specific for blue cones in the macaque retina. J Neurosci 12: 1233-1252. [DOI] [PMC free article] [PubMed] [Google Scholar]
- Kouyama N, Marshak DW (1997) The topographical relationship between two neuronal mosaics in the short wavelength-sensitive system of the primate retina. Vis Neurosci 14: 159-167. [DOI] [PubMed] [Google Scholar]
- Kuner T, Augustine GJ (2000) A genetically encoded ratiometric neurotechnique indicator for chloride: capturing chloride transients in cultured hippocampal neurons. Neuron 27: 447-459. [DOI] [PubMed] [Google Scholar]
- Kuner T, Loo LS, Schäfer T, Schleich W, Augustine GJ, Feng G (2002) Developmental profile of intracellular chloride in cortical neurons determined in Clomeleon indicator mouse lines. Soc Neurosci Abstr 28: 08.9. [Google Scholar]
- Li W, DeVries SH (2004) Separate blue and green cone networks in the mammalian retina. Nat Neurosci 7: 751-756. [DOI] [PubMed] [Google Scholar]
- Linberg KA, Suemune S, Fisher SK (1996) Retinal neurons of the California ground squirrel, Spermophilus beecheyi: a Golgi study. J Comp Neurol 365: 173-216. [DOI] [PubMed] [Google Scholar]
- Lukáts A, Szabó A, Röhlich P, Vigh B, Szél A (2005) Photopigment coexpression in mammals: comparative and developmental aspects. Histol Histopathol 20: 551-574. [DOI] [PubMed] [Google Scholar]
- Luo X, Ghosh KK, Martin PR, Grünert U (1999) Analysis of two types of cone bipolar cells in the retina of a New World monkey, the marmoset, Callithrix jacchus Vis Neurosci 16: 707-719. [DOI] [PubMed] [Google Scholar]
- Lyubarsky AL, Falsini B, Pennesi ME, Valentini P, Pugh Jr EN (1999) UV- and midwave-sensitive cone-driven retinal responses of the mouse: a phenotype for coexpression of cone photopigments. J Neurosci 19: 442-455. [DOI] [PMC free article] [PubMed] [Google Scholar]
- Mariani AP (1984) Bipolar cells in monkey retina selective for the cones likely to be blue-sensitive. Nature 308: 184-186. [DOI] [PubMed] [Google Scholar]
- Martin PR (1998) Colour processing in the primate retina: recent progress. J Physiol (Lond) 513: 631-638. [DOI] [PMC free article] [PubMed] [Google Scholar]
- Martin PR, Grünert U (1992) Spatial density and immunoreactivity of bipolar cells in the macaque monkey retina. J Comp Neurol 323: 269-287. [DOI] [PubMed] [Google Scholar]
- Mollon JD (1989) “Tho' she kneel'd in that place where they grew.” The uses and origins of primate colour vision. J Exp Biol 146: 21-38. [DOI] [PubMed] [Google Scholar]
- Muresan V, Lyass A, Schnapp BJ (1999) The kinesin motor KIF3A is a component of the presynaptic ribbon in vertebrate photoreceptors. J Neurosci 19: 1027-1037. [DOI] [PMC free article] [PubMed] [Google Scholar]
- Nathans J (1999) The evolution and physiology of human color vision: insights from molecular genetic studies of visual pigments. Neuron 24: 299-312. [DOI] [PubMed] [Google Scholar]
- Nathans J, Thomas D, Hogness DS (1986) Molecular genetics of human color vision: the genes encoding blue, green and red pigments. Science 232: 193-202. [DOI] [PubMed] [Google Scholar]
- Neitz M, Neitz J (2001) The uncommon retina of the common house mouse. Trends Neurosci 24: 248-249. [DOI] [PubMed] [Google Scholar]
- Nikonov SS, Daniele LL, Zhu X, Craft CM, Swaroop A, Pugh Jr EN (2005) Photoreceptors of Nrl -/- mice coexpress functional S- and M-cone opsins having distinct inactivation mechanisms. J Gen Physiol 125: 287-304. [DOI] [PMC free article] [PubMed] [Google Scholar]
- Organisciak DT, Winkler BS (1994) Retinal light damage: practical and theoretical considerations. Prog Retin Eye Res 13: 1-29. [Google Scholar]
- Pfeiffer-Guglielmi B, Fleckenstein B, Jung G, Hamprecht B (2003) Immuno-cytochemical localization of glycogen phosphorylase isozymes in rat nervous tissues by using isozyme-specific antibodies. J Neurochem 85: 73-81. [DOI] [PubMed] [Google Scholar]
- Pignatelli V, Strettoi E (2004) Bipolar cells of the mouse retina: a gene gun, morphological study. J Comp Neurol 476: 254-266. [DOI] [PubMed] [Google Scholar]
- Schein S, Sterling P, Ngo IT, Huang TM, Herr S (2004) Evidence that each S cone in macaque fovea drives one narrow-field and several wide-field blue-yellow ganglion cells. J Neurosci 24: 8366-8378. [DOI] [PMC free article] [PubMed] [Google Scholar]
- Sun W, Li N, He S (2002) Large-scale morphological survey of mouse retinal ganglion cells. J Comp Neurol 451: 115-126. [DOI] [PubMed] [Google Scholar]
- Szél A, Rohlich P, Caffe AR, Juliusson B, Aguirre G, van Veen T (1992) Unique topographic separation of two spectral classes of cones in the mouse retina. J Comp Neurol 325: 327-342. [DOI] [PubMed] [Google Scholar]
- Szél A, Csorba G, Caffe AR, Szél G, Röhlich P, van Veen T (1994) Different patterns of retinal cone topography in two genera of rodents, Mus and Apodemus Cell Tissue Res 276: 143-150. [DOI] [PubMed] [Google Scholar]
- Szél A, Lukáts A, Fekete T, Szepessy Z, Röhlich P (2000) Photoreceptor distribution in the retinas of subprimate mammals. J Opt Soc Am A 17: 568-579. [DOI] [PubMed] [Google Scholar]
- Wässle H, Grünert U, Martin PR, Boycott BB (1994) Immunocytochemical characterization and spatial distribution of midget bipolar cells in the macaque monkey retina. Vision Res 34: 561-579. [DOI] [PubMed] [Google Scholar]
- Wenzel A, Grimm C, Samardzija M, Remé CE (2005) Molecular mechanisms of light-induced photoreceptor apoptosis and neuroprotection for retinal degeneration. Prog Retin Eye Res 24: 275-306. [DOI] [PubMed] [Google Scholar]
- Zhu X, Li A, Brown B, Weiss ER, Osawa S, Craft CM (2002) Mouse cone arrestin expression pattern: light induced translocation in cone photoreceptors. Mol Vis 8: 462-471. [PubMed] [Google Scholar]