Abstract
Animals can use different sensory signals to localize objects in the environment. Depending on the situation, the brain either integrates information from multiple sensory sources or it chooses the modality conveying the most reliable information to direct behavior. This suggests that somehow, the brain has access to a modality-invariant representation of external space. Accordingly, neural structures encoding signals from more than one sensory modality are best suited for spatial information processing. In primates, the posterior parietal cortex (PPC) is a key structure for spatial representations. One substructure within human and macaque PPC is the ventral intraparietal area (VIP), known to represent visual, vestibular, and tactile signals. In the present study, we show for the first time that macaque area VIP neurons also respond to auditory stimulation. Interestingly, the strength of the responses to the acoustic stimuli greatly depended on the spatial location of the stimuli [i.e., most of the auditory responsive neurons had surprisingly small spatially restricted auditory receptive fields (RFs)].
Given this finding, we compared the auditory RF locations with the respective visual RF locations of individual area VIP neurons. In the vast majority of neurons, the auditory and visual RFs largely overlapped. Additionally, neurons with well aligned visual and auditory receptive fields tended to encode multisensory space in a common reference frame. This suggests that area VIP constitutes a part of a neuronal circuit involved in the computation of a modality-invariant representation of external space.
Keywords: multisensory, space representation, area VIP, auditory, visual, reference frames
Introduction
Every day, we perceive multiple pieces of information from our environment based on different sensory modalities. We can orient ourselves toward a stimulus, say a singing bird, regardless of whether it was the song or the visual image of the bird that attracted our attention. Yet, the two kinds of spatial information reach us via completely different receptors and early sensory processing stages. Also, the native reference frames of the two sensory systems differ substantially: auditory information is inherently head centered, and visual information is eye centered. It thus seems that at a certain level of the neural processing the information of the two sensory systems converges and is then used to form a single representation of space in a modality-invariant manner.
Spatial and postural information arising from different sensory systems is found throughout the cortex. Yet, not all brain regions are equally involved in mechanisms of the analysis of space. One specialized region for such a process is the posterior parietal cortex (PPC) (Ungerleider and Mishkin, 1982; Sakata et al., 1986; Andersen et al., 1987; Andersen, 1989). Despite its involvement in visual signal analysis, the PPC is not purely visual but can be seen as a hub for the processing of multisensory spatial information with the goal of guiding eye, limb, and/or body movements (for review, see Hyvarinen, 1982; Andersen et al., 1987; Milner and Goodale, 1995; Colby and Goldberg, 1999). One area within the PPC, the ventral intraparietal area (VIP), is located in the fundus of the intraparietal sulcus. In their extensive work on the connectivity of macaque parietal cortex areas, Lewis and Van Essen (2000) showed that injections identifying inputs into area VIP led to more labeled cortical pathways than did the injections in its surrounding areas. The authors suggested that this high density of connectivity to different cortical pathways reflects the importance of area VIP in multisensory spatial processing mechanisms. This makes area VIP an excellent target area for studying multisensory integration. Yet, up to now, only few studies have addressed the functional implications. Single cell responses in monkeys and imaging studies in humans have revealed activation by means of visual, vestibular, and somatosensory stimulation (Colby et al., 1993; Duhamel et al., 1998; Bremmer et al., 2001, 2002a,b; Suzuki et al., 2001; Schlack et al., 2002). The projections to area VIP summarized by Lewis and Van Essen (2000) showed additionally immense inputs from auditory areas. However, the presence of auditory signals in this area has not yet been demonstrated physiologically.
In the present study, we show for the first time auditory responsiveness of macaque area VIP neurons. In most cases, these auditory responses were spatially tuned, and the auditory and visual receptive field (RF) locations were usually spatially congruent. At the population level, visual and auditory space was encoded in a continuum from an eye-centered via an intermediate to a head-centered frame of reference. We found that neurons with especially well aligned auditory and visual receptive fields tended to encode spatial information in the two modalities in a common reference frame and could thus be used for a modality-invariant representation of space.
Materials and Methods
General
We performed electrophysiological recordings in two macaque monkeys (Macaca mulatta) during auditory and visual stimulation. To ensure that the activity observed was sensory in nature, the stimuli had no behavioral significance for the animals. Neither of the animals been involved before in any other task involving behavioral decisions based on visual or auditory stimuli. All experimental protocols were in accordance with the European Communities Council Directive 86/609/EEC. Based on individual magnetic resonance imaging scans of the animals involved in our experiments, a recording chamber was placed above the middle section of the intraparietal sulcus, orthogonal to the skull. We recorded extracellulary from single units from the left hemisphere in the first animal and the right hemisphere in the second animal. All results were qualitatively similar in both animals, indicating that there is no lateralization of the effects described. In this paper, we therefore present the results of the two animals jointly. The stereotaxic coordinates of the chambers were 3 mm posterior, 15 mm lateral for the first animal and 4 mm posterior, -13.5 mm lateral for the second animal. In each recording session, we verified that we recorded from area VIP by evaluating the recording depth and comparing it to the depth predicted by the magnetic resonance scan and by means of physiological criteria. In most recording sessions, we lowered our electrode through the lateral intraparietal area (LIP), with its clear saccade-related activity, and then reached area VIP in the sulcus at a recording depth of ∼9-14 mm. Reaching area VIP was always very clear, because in this area, the saccade-related activity is clearly absent. Moreover, area VIP can be distinguished from its neighboring areas because of its strong preference for moving visual stimuli. Accordingly, visual search stimuli often were those simulating self-motion, because we and others have shown previously that area VIP neurons tend to respond well to those stimuli (Schaafsma and Duysens, 1996; Bremmer et al., 2002a,b; Schlack et al., 2002). Note, however, that the use of visual search stimuli might have led to a biased sampling of cells toward a visual responsiveness. While one animal is still involved in experiments, histological analysis of the first monkey's brain confirmed that recording sites were in area VIP.
RF mapping
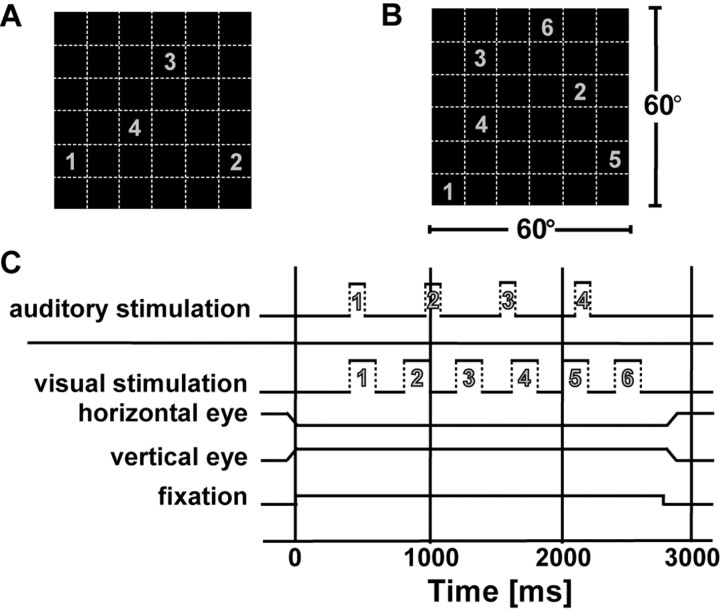
During experiments, monkeys fixated a spot of light in an otherwise dark room. The mapping range covered the central 60 × 60° of the monkey's frontal extrapersonal space and was subdivided into a virtual square grid of 36 patches. In each trial, six visual or four acoustic stimuli appeared in pseudorandomized order at the patch locations while the monkeys fixated a visual target (Fig. 1). Between trials, the fixation position varied between a central position and 10° right or left from it. The mapping paradigm started 400 ms after the monkey had achieved fixation. In blocks of trials, stimuli were either visual or auditory. We presented at least 15-20 repetitions of each stimulus. Visual stimuli were computer generated and projected on a screen 48 cm in front of the monkey. To map the visual RFs, a white bar (10 × 1°) moved at 50°/s across the different patches into the preferred direction of the neuron [determined previously with a standard technique (Schoppmann and Hoffmann, 1976)]. The stimulus duration was 200 ms followed by 200 ms without stimulation. For auditory stimulation, a virtual auditory environment was created by means of a Tucker-Davis (Power SDAC, System II; Tucker-Davis, Alachua, FL) setup based on measurements of individual head-related transfer functions (HRTFs) of the animals used in the experiments (see below). We presented frozen Gaussian noise bursts (200 Hz to 16 kHz; linear) filtered with these individual HRTFs via calibrated earphones (DT48; Beyer, Heilbronn, Germany), thereby simulating external sounds arising from the center of the virtual stimulus patches. The earphones were positioned close to the ear canal openings so that they obviated pinna movements of the animals. During the HRTF measurements, the transfer function of the earphones positioned at the very same location had been measured and had been taken into account to create the stimulus catalog. Pinna movements were restricted for two main reasons. First, changes in pinna position could have distorted the signal reaching the ear drum. Second, information on the position of the pinnas could have altered the interpretation of the signals reaching the auditory pathway, because different pinna positions would lead to different HRTF features. We cannot completely rule out the although unlikely possibility that fixing the pinna position induces a slight modification of the auditory spatial representations. One could imagine, for example, that central auditory processing includes also an efference copy of an intended pinna movement. In such case, there would have been a sensory motor conflict, because the pinna positions were determined by the positioning of the earphones and could not voluntarily be controlled by the animal. Yet, more importantly, by obviating pinna movements of our monkeys, we made sure that stimuli delivered in the experiments were maximally standardized and not distorted by any variability of the pinna positions. The stimulus duration was 80 ms (with each, a 5 ms increasing ramp at the beginning and a decreasing ramp at its end), and the interstimulus interval was 410 ms. The animals were not involved in any behavioral localization tasks related to the sensory stimuli, to make sure that we measured pure sensory responses and not responses brought into the system by behavioral training.
Figure 1.
Auditory and visual RF mapping. In both sensory modalities, our mapping range (A, B) covered the central 60 × 60° of frontal extrapersonal space. This mapping area was divided into a virtual square grid of 36 patches, each being 10 × 10° wide (dashed lines in A, B). In each trial, either four auditory (A) or six visual (B) stimuli appeared in a pseudorandomized order within the different grid positions. The numbers in A and B represent two example sequences for an auditory and visual trial, respectively. C depicts the time courses of auditory and visual trials. The numbers within the auditory and visual stimulus traces link the time courses of the sensory stimulations to the stimulus locations in A and B. The first stimulus in each trial appears 400 ms after the monkey had achieved central fixation, as indicated by the schematic traces of the horizontal and vertical eye position signals. Visual stimulation lasted for 200 ms followed by a 200 ms interval without stimulation. Auditory stimulation consisted of 80 ms white-noise bursts followed by 410 ms without stimulation. See Materials and Methods for details.
Note that we used moving stimuli to determine the visual RFs, whereas the auditory stimuli were stationary noise bursts. We had to use moving stimuli to induce strong visual responses. The auditory stimuli however did not move. This is because we did not know anything about possibly existing auditory responses in this area and did not want to confound possible spatial aspects of auditory responses with possible other interactions. Rather, we used the most standardized auditory stimulus we could achieve (see below). Also, the stimulus range was restricted to stimuli in frontal space. Several studies have shown psychoacoustically that the region of most precise spatial hearing is the forward direction. Moreover, physiological studies of areas interconnected with area VIP [ventral premotor cortex (vPMC) and caudomedial belt region (CM)] have shown a tendency of auditory RFs to be located in frontal space (Graziano et al., 1999; Recanzone et al., 2000). We therefore restricted our stimulus range to this area.
Acoustic stimuli
We created a virtual auditory environment based on the individual HRTF measurements of our monkeys. The exact procedure of these measurements was described in detail previously (Sterbing et al., 2003). Differences to the procedures described by Sterbing et al. (2003) are provided below. The measurements were performed in an anechoic room (4 × 5 × 3.5 m; low-end cut-off frequency, 200 Hz). The anesthetized animal was fixed in an upright position. To minimize reflections caused by the setup, this was done by attaching the monkey's head holder to a narrow bent steel bar that was led closely behind of the animal's head. The head-related impulse responses were measured with miniature microphones (3046; Knowles, West Sussex, UK) that were positioned within a few millimeters within the entrance of the outer ear canals of both ears, so that the ear canals were blocked. For the HRTF measurements, random-phase noise stimuli were delivered via a calibrated loudspeaker [Manger MSW (Mellrichstadt, Germany) sound transducer] that could be moved along a vertical C-shaped hoop to allow stimulus presentations at different elevations. The hoop could be rotated in azimuth to cover different azimuthal stimulus locations. We measured HRTFs for 216 directions ranging from 0 to 360° in 15° steps in azimuth and from -60 to 60° in 15° steps in elevation. Measured signals were interpolated to obtain a stimulus catalog with a 5 × 5° resolution (Hartung et al., 1999). This catalog allowed us to present the broadband noise signals with 80 dB sound pressure level (40 dB spectrum level) from any direction at a distance of 1.2 m from the center of the monkey's interaural axis. Broadband noise stimuli rather than pure tone stimuli were used, because sound source localization ability degrades markedly with decreasing signal bandwidth (Blauert, 1997).
Classification of the neuronal responses
Responsiveness and latency. We moved a sliding 100 ms window in 5 ms steps over the time course of the recorded activity after stimulus onset and computed an ANOVA on ranks over the 36 different stimulus responses and the baseline activity. If possible, we determined the first point in time after stimulus onset at which three successive analysis windows led to significant results of the ANOVA (p < 0.05). This was considered to be the latency of the response. We then determined the first point in time after this latency when the result of the ANOVA was no longer significant (i.e., when the response ended). The analysis window was defined as extending between these two points in time. Neurons were considered to be responsive to the stimulation if the spike activity in this response window was significantly different (p < 0.05) from baseline.
Receptive fields. We used the same analysis window as in the test for responsiveness (see above). Neurons with significant modulation of the discharge levels between different stimulus positions (ANOVA on ranks; p < 0.05) encoded spatial information and were therefore classified as having a spatially distinct RF. We fitted a two-dimensional (2-D) Gaussian function to the RF data and used a χ2 test to assess the goodness of the fit at the α = 0.05 level. To make our data comparable with other studies, we defined RFs (see Figs. 7, 10, black outline) as comprising those positions eliciting at least a half-maximum spike rate.
Figure 7.
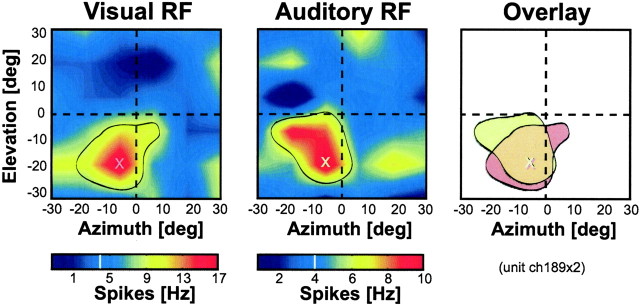
Example of the spatially congruent visual (left) and auditory (middle) RFs of an individual VIP neuron. Same conventions as for the middle panel in Figure 3. The data have been recorded while the monkey fixated a central target. The red and yellow sectors surrounded by the black outlines correspond to the RF locations (discharge >0.5 maximum discharge). The crosses indicate the hotspots (i.e., the locations of the highest discharge within the RFs). The right panel shows a superposition of outlines and hotspots of the RFs of both modalities. The two RFs largely overlapped, and the hotspots were almost identical. deg, Degrees.
Figure 10.
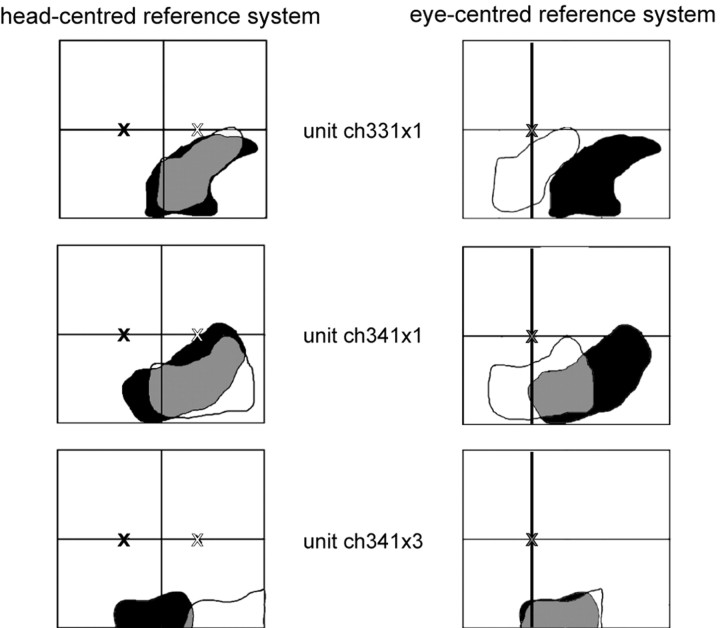
Example of three neurons with head-centered, intermediate, and eye-centered encoding of auditory spatial information. The left column shows the RF locations determined while the monkey fixated either 10° to the left (black RF; fixation position indicated by the black cross) or 10° to the right (white RF; fixation position indicated by the white cross). The RFs are plotted in a head-centered reference frame. In the right column, the very same RFs are plotted in eye-centered coordinates (fixation position indicated by the gray cross). The first cell (first row) could be described best as encoding space in a head-centered coordinate system. The second cell (second row) fitted best an intermediate encoding scheme, whereas the third cell (third row) encoded auditory information in an eye-centered reference frame (see Results for details).
Peak height analysis and variability index. We wanted to determine how reliable and strong the auditory responses were in comparison to the well known visual responses in this area. For both modalities, we analyzed the responses within the response windows described above. In a first step, we performed a peak height analysis: for each neuron with a significant RF in both modalities, we determined the stimulus position that led to the highest discharge (preferred location) in each modality, by considering the mean activity in the response window of the neuron. We then performed a t test to identify significantly different response strengths (α = 0.05 level) between modalities. As a second test, we compared the variability index (VI) between the visual and auditory responses. The VI was thereby defined as the SE of the response at the preferred location divided by the mean spike rate of the response at the same location as follows: VI = SE(X)/mean(X), where X = response to stimulus at preferred location. Low VI values thus indicate a low amount of variation in the spike rate corresponding to a low variability and thus high reliability of the response. The higher the VI value, the higher the variability and the lower the reliability of the response.
Comparison between visual and auditory RF locations
Region of overlap analysis. We determined the size of the region of overlap between the visual and auditory RFs of individual neurons and normalized the respective values to the size of the smaller of the two RFs.
Cross-correlation analysis. The advantages of a 2-D cross-correlation analyses for the comparison of RF locations have already been established (Duhamel et al., 1997). This method is much more conservative than the region of overlap analysis, because it takes not only the borders but also the fine structure of the RFs into account. We thus used this technique to determine the offset for optimal overlap between RFs in the two modalities. We applied this analysis to all neurons with significant RFs in both modalities. By using this analysis, the RFs were systematically displaced in 10° steps in upward, downward, leftward, and rightward direction relative to each other. For each shift, we determined the Pearson correlation coefficient (R) and the significance of the correlation (Fisher's r to z transformation). Based on this analysis, we determined the best fit for each neuron and normalized the respective shift relative to the auditory RF diameter. This is then called the intermodal optimal RF offset of the neuron. In one neuron, none of the R values were significant; this neuron was therefore excluded from the analysis.
Determining the reference frames
We used a 2-D cross-correlation technique as described above to determine the reference frame used to encode visual and auditory space. We applied this analysis to all neurons with significant RFs in at least two fixation conditions. Because the fixation position only varied along the horizontal axis, the analysis was restricted to this domain. We computed a shift index (SI) as a measure of the reference frame, which was defined as the shift of the RF divided by the shift of eye position. Accordingly, a shift index of 0 corresponds to a neuron encoding space regardless of eye position in a head-centered reference frame. A shift index of ∼1 implicates a shift of the RF similar to the underlying shift of the eyes (i.e., an eye-centered reference frame). Neurons with shift indices of ∼0.5 encode space in intermediate reference frames. (The exact limits we used for this classification of the SI were the following: head centered, SI between -0.3 and 0.23; intermediate, SI between 0.23 and 0.77; and eye centered, SI between 0.77 and 1.3.)
Note that we did not interpolate the data for any of the analyses applied. However, we did interpolate the data bilinearly for visualization purposes of the RF data (see Figs. 3, 4, 7, 10).
Figure 3.
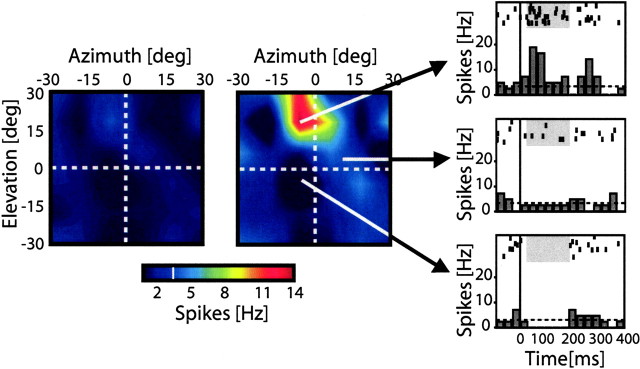
Auditory receptive field and variability map of a VIP neuron. In the left two panels, horizontal and vertical axes indicate the mapping range. The mean SE (left) or mean spike rate (middle) evoked by the stimulation of a given location is color coded. The color bar (bottom) shows which colors correspond to which spike rates. The level of spontaneous activity is indicated by the white line in the color bar. The red sector in the middle panel corresponds to the RF (see Materials and Methods). The discharge of this neuron was strongest for stimulations in the top central and left part of the mapping range. Stimulations in the region around the receptive field led to inhibition of the neuron (deep blue surround of the receptive field in the figure). The three panels on the right show peristimulus time histograms (PSTHs) and raster plots of the responses of this neuron to stimulation at three different locations (indicated by the black arrows). The vertical lines indicate the start of the auditory stimulus, and the horizontal line indicates the level of baseline activity (3.5 spikes/s). The top panel shows the response to stimulation at the preferred location. The middle panel depicts responses to a stimulation slightly below and to the right of the preferred stimulus location, leading to a response not different from spontaneous activity. The bottom panel shows responses to a stimulation 20° below the preferred stimulus location leading to an inhibitory response. The response latency of this neuron was 35 ms. The response of the neuron was significantly modulated by the stimulus for 150 ms (response duration, gray shaded area in the raster and PSTH plots). The receptive field diameter at a half-maximal response threshold was 30°. The VI for this neuron [i.e., the SE at the preferred location (see left panel) divided by the mean response at the same location (see middle panel)] was 0.36. deg, Degrees.
Figure 4.
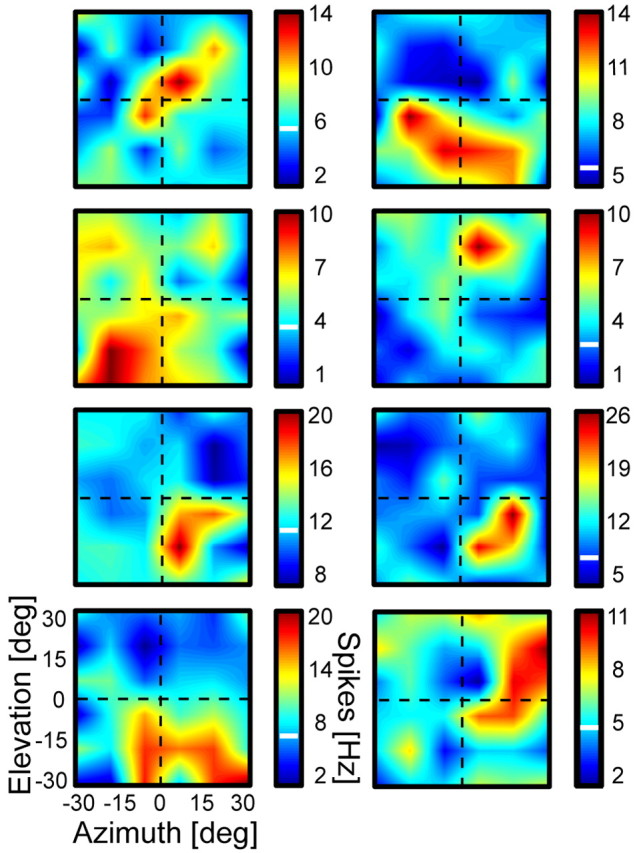
Auditory receptive field examples. Same convention as for the middle panel of Figure 3. The figure shows a variety of auditory receptive fields with different shapes, positions, and sizes. Each panel thereby corresponds to the auditory RF plot of one area VIP neuron. deg, Degrees.
Results
Auditory compared with visual response properties
We recorded from 136 neurons in area VIP of two macaque monkeys during acoustic and visual stimulation. Not surprisingly, most of these neurons (125 of 136) responded (see Materials and Methods) to visual stimulation. Yet, we found that 80% (109 of 136) of the neurons responded also significantly to acoustic stimulation, demonstrating for the first time the presence of auditory information in area VIP.
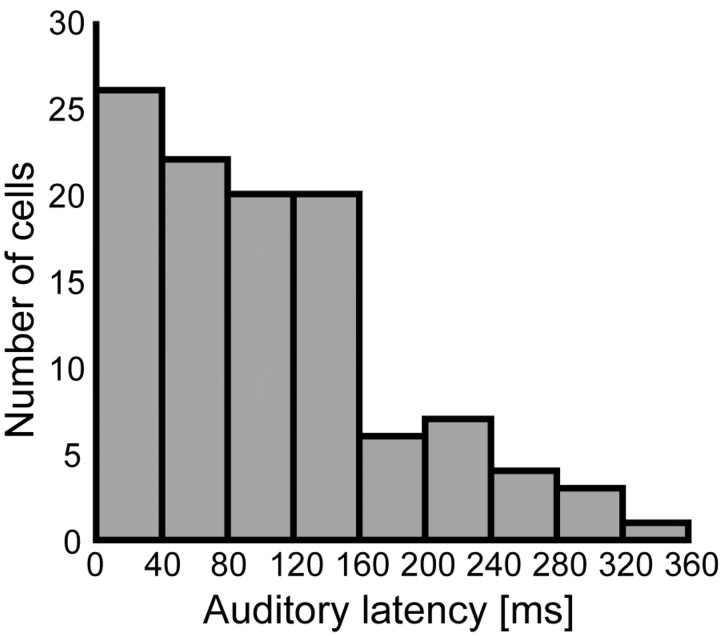
The mean latency of the auditory responses was 103 ms (±7.2 ms) [i.e., slightly but not significantly (p > 0.05) shorter than the mean latency of the visual responses (115 ± 5.9 ms) in our dataset]. A distribution of the auditory latencies is shown in Figure 2. Latencies covered a broad range. Some of the auditory responses were thereby very fast (i.e., they already occurred after a few milliseconds). (The minimal latency for auditory responses was 15 ms.) There was no systematic relationship between auditory and visual response latencies for individual neurons (r = 0.1; p > 0.05).
Figure 2.
Distribution of auditory latencies across VIP cells. Auditory responses occurred in a broad range of latencies, but there was a bias toward short latencies. More than one-half of the neurons (57%) had latencies shorter than 100 ms; 33% of the neurons had even latencies shorter than 50 ms.
Interestingly, most neurons responded only to acoustic stimuli within a clearly circumscribed region within our mapping range. Figure 3 shows an example of such a spatially distinct auditory receptive field of an individual VIP neuron.
Auditory receptive field locations varied across our mapping range. The receptive fields also varied in size and shape. To give a better impression of the variety of auditory receptive fields, Figure 4 presents some more examples.
For some neurons, the response was spatially unspecific. Yet, we observed spatially distinct RFs for 93 of the 136 (68.4%) neurons during auditory stimulation and for 121 of the neurons (89%) during visual stimulation (see Materials and Methods for details). Eighty-one neurons (60%) had spatially distinct RFs in both modalities.
We used a two-dimensional Gaussian function to fit the auditory response profiles. For almost all neurons (94.6%), we could not reject the null hypothesis, that such a gauss kernel describes the observed response profile (α = 0.05; χ2 test for goodness of fit). The mean auditory RF diameter at a half-maximum threshold was 40.6° (±0.86 SE), therefore being significantly (p < 0.01) larger than the average visual RF diameter (36.3° ± 0.8). Comparing the RF size on a cell-by-cell basis led to a similar result: there was a slight but not significant (p > 0.05) bias for individual cells to have smaller visual than auditory RFs (48 of 81 neurons).
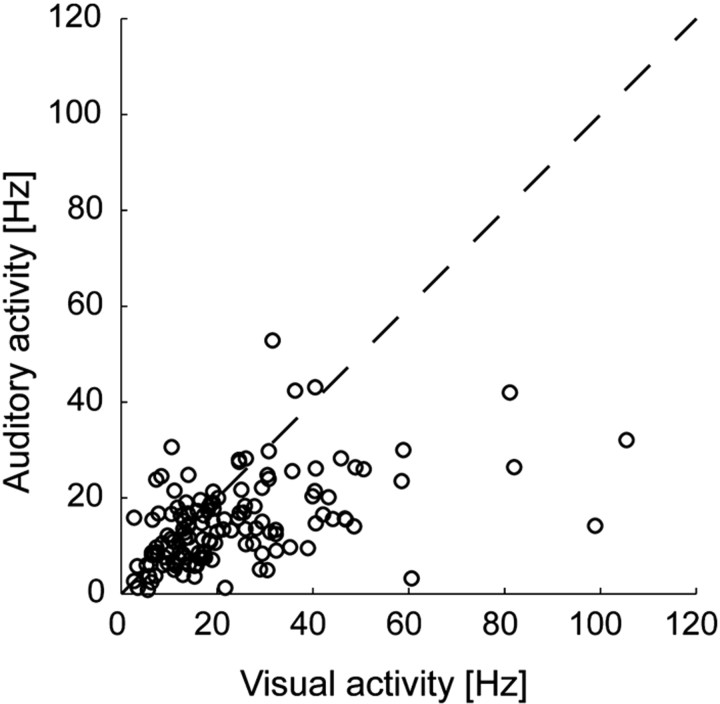
Because this is the first description of auditory responses in this area, we aimed at a quantitative measure on the robustness and variability of the auditory responses in comparison to the well studied visual ones. In a first step, we compared the magnitude of the peak response in the two modalities for individual neurons (see Materials and Methods for details). Seventy percent of the neurons with a receptive field in both modalities had a higher peak for visual compared with auditory stimulation (57 of 81). However, only for 58% of these neurons (33 of 57) was this difference significant (p < 0.05). Figure 5 shows a comparison between the firing rates evoked by stimulation at the preferred location between the auditory and visual stimulus modality.
Figure 5.
Comparison of the mean activity caused by stimulation in the hot spot of the auditory (vertical axis) and visual (horizontal axis) receptive fields for individual neurons (n = 81). Each circle represents the firing rate ratio for a single neuron. The firing rate to visual stimulation tended to be higher than to auditory stimulation as indicated by the larger number of circles located under the bisector line.
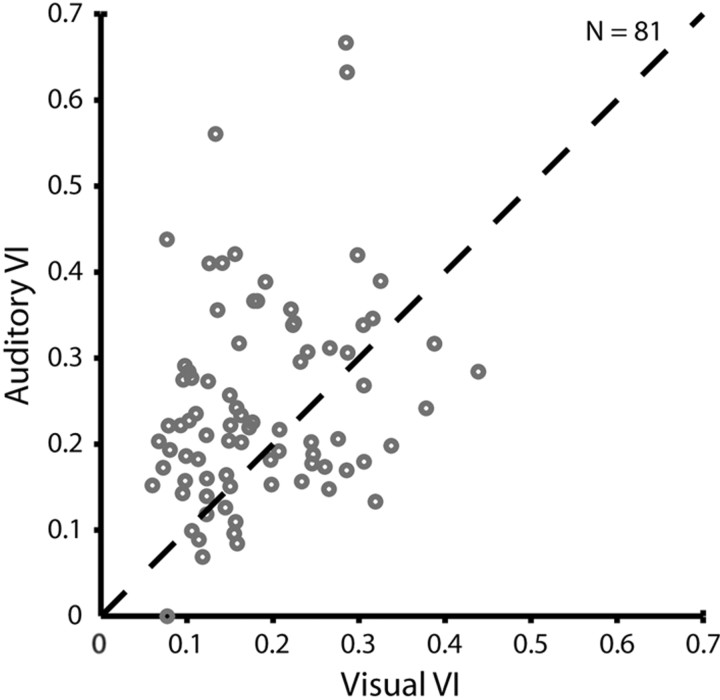
To determine how variable the auditory responses were, we defined a VI as the SE of the responses to stimulation at the preferred position relative to the mean response to this stimulus position. The larger the VI value, the noisier would be the observed response. A VI value of 0 on the other hand would represent a zero noise response. In both modalities, the observed VIs were in about the same range of values (Fig. 6). The mean VI across all neurons with significant RFs was 0.24 ± 0.02 for auditory RFs and thus was higher (p < 0.05; t test) than the VI for visual RFs (0.18 ± 0.01). Similarly, we found a significant bias (p < 0.05; χ2 test) for the visual responses to be more reliable (i.e., less variable) at the individual cell comparison: for 67% of the neurons (54 of 81), the VI was smaller (i.e., the response was less noisy) for the visual peak response compared with the auditory one.
Figure 6.
Comparison of the auditory (vertical axis) and visual (horizontal axis) VI for individual neurons (n = 81). Each circle represents the VI ratio for a single cell. The dashed line represents the bisector line. Circles on this line indicate cells with identical variability of response to visual and auditory stimulation. The values for visual and auditory VIs basically cover the same range. However, there are more data points located above the bisector line than above. For such neurons, the auditory VI is higher than the visual VI (see Results for details).
Multisensory signals
We tested a subset of neurons (n = 29) in one animal also with linear vestibular stimulation (Schlack et al., 2002). In this population of neurons, we did not find any unimodal neurons. Rather, 75.9% (22 of 29) of the neurons were trimodal, and 24.1% (7 of 29) were bimodal. Of the bimodal neurons, four neurons responded to visual and vestibular but not to acoustic stimulation, two neurons to auditory and visual but not vestibular stimulation, and one neuron to visual and vestibular but not auditory stimulation.
Auditory and visual encoding of space
In addition to the comparisons of the visual and auditory response strength and reliability, we were interested in whether the visual and auditory spatial signals carried by individual neurons coincided. In our experiments, we used an identical range for the mapping of both visual and auditory RFs, which allowed us to directly compare the RF locations in the two sensory modalities. Figure 7 shows an example of the visual and auditory RFs of one individual VIP neuron as well as the spatial relationship between the two RFs.
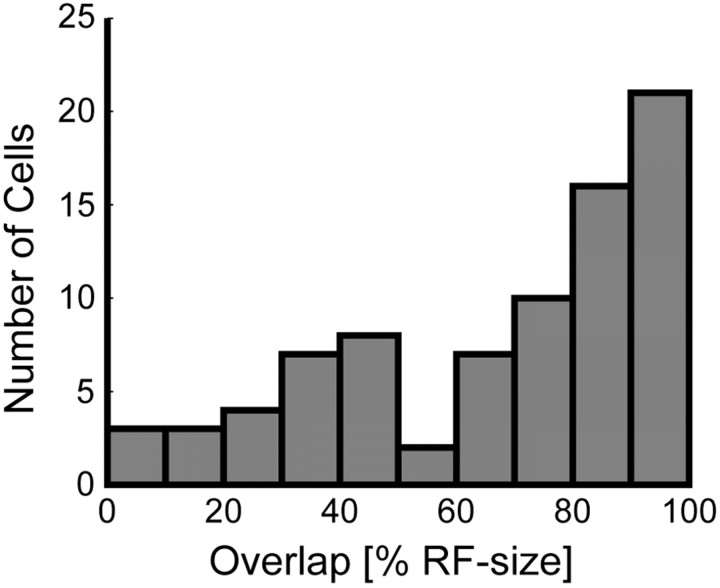
To quantify how well the visual and auditory receptive field locations corresponded at the population level, we determined the region of overlap between the two RFs for each neuron and normalized this value relative to the size of the smaller of the two RFs (see Materials and Methods). Figure 8 shows the distribution of RF overlap for the 81 neurons with significant RFs in both modalities. We found that 72.8% of the neurons with significant RFs in the two modalities (59 of 81) had visual and auditory RFs that overlapped at least one-half of the smaller RF size. This shows that the RF locations of the two sensory modalities are generally well aligned.
Figure 8.
Distribution of intermodal RF overlap normalized to RF sizes (n = 81). The figure shows the distribution of spatial overlap of the visual and auditory RFs of the individual cells in a population scheme. For the majority of neurons (72.8%), the RFs from the two sensory modalities overlapped by ≥50%.
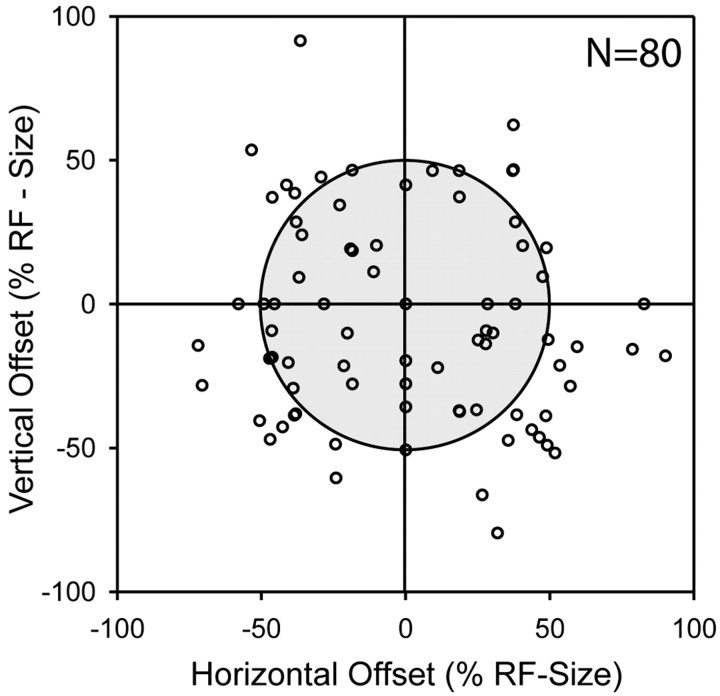
The spatial overlap analysis above showed that visual and auditory receptive field locations of single neurons tended to coincide. However, two receptive fields could be completely overlapping, but their centers of mass or their hot spots could be spatially disparate. Accordingly, as a more conservative measure for the correspondence between the visual and auditory representations, which also takes the fine structure of the receptive fields into account, we determined the intermodal optimal RF offset for 80 of the neurons by using a cross-correlation technique (see Materials and Methods). For the neuron shown in Figure 7, this offset was 0°, which could be interpreted as the two RFs being spatially congruent. We applied this analysis to all neurons with significant RFs in both modalities (see Materials and Methods). The mean absolute offset between the visual and auditory RFs for the 80 neurons was about one-half (51 ± 3%) of the auditory RF diameter. In absolute measures, this corresponds to an average shift of 21.3 ± 0.7°. Considering the horizontal and vertical axes independently, the mean azimuthal offset was 14.7 ± 0.8°, and the elevational offset was 12.9 ± 0.9°. The distribution of offsets is shown in Figure 9. For 71 (89%) of the 80 neurons, the absolute offset was <75% of the RF diameter; for 40 (50%) neurons, it was less than one-half of the RF diameter. Together with the above analysis of the region of overlap, this shows unequivocally that during central fixation the RFs in the two modalities were usually in close spatial proximity.
Figure 9.
Distribution of optimal intermodal RF offsets normalized to RF sizes (n = 80). Each open circle corresponds to the offset value of one neuron (see Materials and Methods). The gray area indicates the limit of 50% of the RF size. Symbols inside this area refer to neurons with visual RFs that had to be displaced less than one-half of their respective RF size to obtain the best possible intermodal RF match.
Auditory and visual reference frames
If a brain area were to provide spatial information in a modality-invariant manner, one could expect that the reference frames in which auditory and visual information would be provided should be similar in single neurons. To test for this hypothesis, we mapped the visual and auditory receptive fields of our 136 area VIP neurons with varying fixation positions. The locations of the fixation target were thereby varied among three azimuthal positions. This allowed us to test whether the RFs remain stable relative to the head or whether they shift with the eyes. To answer this question, we defined an SI (see Materials and Methods) that allowed us to quantify the spatial representations of individual cells as being one of three different classes: eye-centered, head-centered, and intermediate spatial encoding. The SI could be determined for 91 neurons tested in the auditory domain and 124 neurons tested in the visual domain. In line with previous findings (Duhamel et al., 1997), the reference frames in the visual modality covered the whole possible range between eye- and head-centered encodings.
Yet, we were most deeply interested in the encoding of auditory space by area VIP neurons. Figure 10 shows examples of three neurons that encoded auditory information in different reference frames. The auditory RF of a first example cell (first row, left) was located in the lower right quadrant of the mapping range regardless of the fixation position. When the two auditory RFs (white and black) obtained for two different fixation positions were superimposed in a head-centered coordinate system, they matched perfectly (gray area). When, however, the two auditory RFs were plotted in an eye-centered coordinate system (right), the RF locations no longer corresponded. This cell was thus head centered (SI, 0.0; r = 0.566; p < 0.001) (i.e., it remained in the native coordinate frame of the auditory system). However, the other two example neurons revealed different functional response patterns. For instance, for the second cell (second row), the eye position change influenced the position of the auditory RF. By changing fixation from right (white) to left (black), the RF followed the direction of the gaze change but not to the full extent. A head-centered reference frame did thus not perfectly describe this encoding. The corresponding panel on the right, on the other hand, shows that an eye-centered reference frame did not describe the spatial encoding of this cell either. Accordingly, the cell encoded auditory space in an intermediate state between eye and head coordinates (SI, 0.41; r = 0.576; p < 0.001). For a third cell (third row), the shift with the gaze change was more pronounced. In head-centered coordinates (left), the two auditory RFs hardly overlapped. However, when the two auditory RFs were plotted in eye-centered coordinates (right), the RF locations matched almost perfectly. The auditory spatial encoding of this cell was thus best described in an eye-centered reference frame (SI, 1.23; r = 0.42; p < 0.001). The analysis of the auditory reference frames for all 91 neurons revealed that the examples above were no exceptions: overall, auditory space was encoded in a continuum from eye- to head-centered representations.
Encoding of visual space in a reference frame different from eye-centered and encoding of auditory space in a reference frame different from head-centered constitutes a change away from the native reference frame of the respective sensory modality. Depending on the neural implementation, the computations necessary for such a change in spatial encoding probably require time. We therefore compared the latencies of the visual and auditory responses for the three reference frames: eye centered, intermediate, and head centered (Fig. 11). Response latencies of neurons that encoded space in the reference frame native to the respective modality (i.e., eye centered in the visual domain, head centered in the auditory domain) tended to be shorter than latencies of neurons that encoded space in the other two reference frame groups. Considering all three groups of reference frames, the interaction effect between modality and reference frame was almost significant (p = 0.052; two-way ANOVA). However, if only neurons were considered that encoded space in eye- or head-centered coordinates, this interaction effect turned out to be significant (p = 0.02).
Figure 11.
Visual and auditory latencies for neurons encoding space in head-centered, intermediate, or eye-centered coordinates. The top shows the mean latencies (±SE) of neurons that encoded auditory space in head-centered, intermediate, or eye-centered reference frames. The bottom shows the same for visual latencies. In both sensory modalities, latencies tended to be shortest for neurons using the native reference frame of the respective sensory system (eye-centered for the visual, head-centered for the auditory stimulus domain). Latencies were longest for neurons that used reference frames that required coordinate transformations to take place (see Results for details).
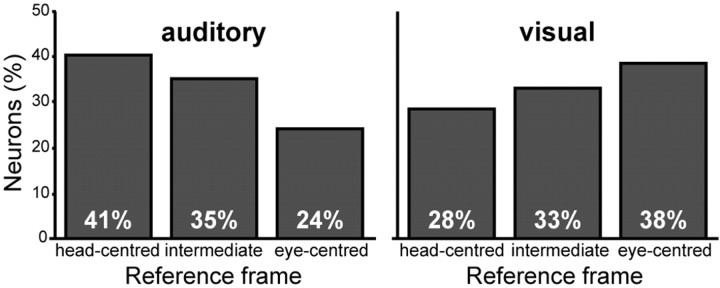
We showed above that bimodal receptive fields of individual area VIP neurons observed during central fixation usually lay in close spatial proximity. This would lead one to expect that auditory and visual signals also use the same reference frames. Figure 12 thus compares the distribution of reference frames for the two sensory modalities. As pointed out above, all three reference frames were observed in both sensory modalities. However, in the visual domain, spatial representations were slightly dominated by eye-centered encodings compared with head-centered encodings, whereas the opposite was true for the auditory domain.
Figure 12.
Distribution of reference frames within the auditory and visual RF population. The panel on the left shows the proportion of neurons encoding auditory space in the respective reference frames (n = 91). The panel on the right shows the respective data for visual space (n = 124).
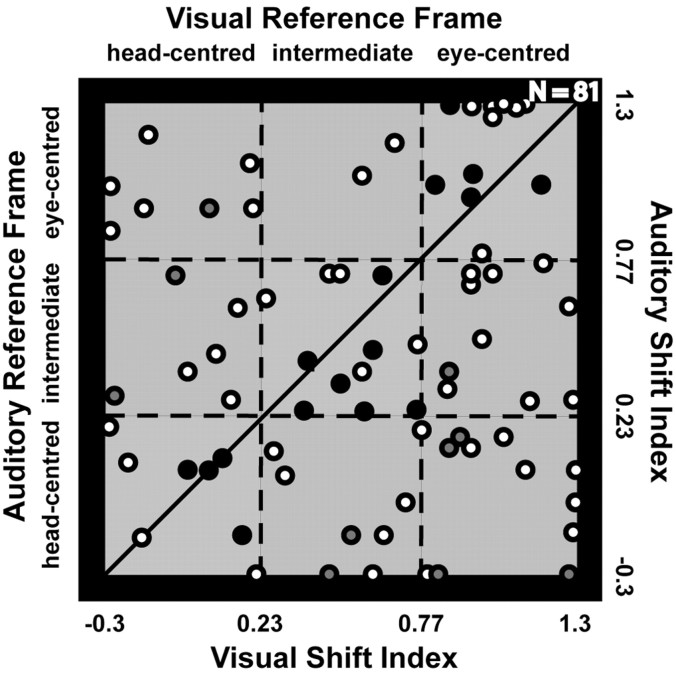
We also compared response properties on a cell-by-cell basis. Sixty-one percent of the neurons with RFs in both modalities (49 of 81) fell into different reference frame classifications (e.g., head centered vs eye centered) in the two modalities. These neurons had thus encoded auditory and visual information in different reference frames. Figure 13 shows a scatter plot for the distribution of reference frames in the two modalities for individual bimodal neurons. The individual reference frame ratios for single cells were widely spread. We could not find any significant correlation between the visual and auditory reference frames (r = 0.1; p > 0.05). Individual area VIP neurons thus represent visual and auditory signals simultaneously in different reference frames.
Figure 13.
Comparison between the respective reference frames in the visual and auditory domain for single neurons (n = 81). The auditory shift index is plotted against the visual shift index. Each data point indicates the value for a single neuron. The squares represent the limits of our classification in the three subclasses of reference frames (eye centered, intermediate, and head centered). Dots in the lighter squares (i.e., squares centered on the oblique line) indicate neurons with a similar visual and auditory reference frame. For neurons that are represented by dots below these sectors, the reference frame for visual space is shifted toward an eye-centered representation compared for the respective reference frame for auditory space. Dots above these sectors indicate neurons with a more eye-centered encoding of space in the auditory than in the visual domain. Filled dots represent neurons with spatially coinciding visual and auditory RFs during central fixation. Of these, the ones filled in gray mark cells with different reference frames, and the ones filled in black mark cells with similar reference frames.
We had previously determined the correspondence of visual and auditory receptive fields during central fixation for these very same neurons. We evaluated the reference frames for the subpopulation of neurons with spatially coinciding visual and auditory RFs during central fixation (i.e., the neurons with an intermodal RF offset less than one-half of the auditory RF diameter). We then compared the results of this subpopulation of neurons to those of the whole population of neurons to see whether there would be any relationship between spatial coinciding RFs during central fixation and encoding visual and auditory space in similar reference frames.
We could determine the visual and auditory reference frames of 34 of the 40 neurons with spatially coinciding RFs. The correlation analysis between the visual and auditory reference frames of this subpopulation revealed a higher value (r = 0.38; p = 0.08) compared with the whole population of 82 neurons (r = 0.1).
In the subpopulation of the neurons with spatially coinciding visual and auditory RFs, 68% (23 of 34) used similar reference frames in the two modalities, whereas this was true for only 39% of the whole population of cells (33% would be the chance level for this analysis). Similarly, 72% (23 of 32) of the neurons with similar reference frames in the two modalities had spatially coinciding RFs during central fixation.
The higher R values as well as the high percentage of neurons that had spatially coinciding RFs and additionally coded visual and auditory space in similar reference frames (Fig. 13) thus suggest that there is indeed a coupling between these two spatial response features.
Discussion
Auditory responses
This is the first study to show auditory responses in monkey area VIP. In adjacent area LIP, auditory responses only appear after an extensive training on an auditory saccade task (Grunewald et al., 1999). Unlike this previous study, the stimuli in our experiments had no behavioral relevance for the animals. Moreover, we found auditory responses right at the beginning of the recording period. Many neurons had rather short latencies: the response latency of one-half of the neurons was shorter than 100 ms. It is thus unlikely that the observed activity reflected some kind of covert motor planning. We conclude that the auditory responses observed in our study were sensory in nature.
Auditory receptive fields
We found that many neurons had spatially restricted auditory receptive fields. Responses of most of the neurons could be approximated with a unimodal Gaussian function. It was not unexpected to find neurons with a spatial receptive field within the mapping range of 60° of central frontal space: already in auditory cortex, there is a preference for stimuli located at the midline (for review, see Kaas et al., 1999). The spatial tuning of these auditory cortex neurons is often quite broad with a receptive field diameter extending commonly over 90° for a half-maximal response (Benson et al., 1981; Middlebrooks and Pettigrew, 1981; Middlebrooks et al., 1998; Furukawa et al., 2000; Recanzone et al., 2000). However, these larger receptive field sizes could have been caused by reflections in the experimental setups used in these studies. Support for this idea comes from the fact that smaller receptive field sizes have been found with HRTF-based stimulus presentations (Mrsic-Flogel et al., 2003). Smaller auditory receptive fields with sizes comparable with those observed for area VIP neurons as obtained in our present study have also been described in the CM (Recanzone et al., 2000) and the representation of frontal space in the superior colliculus (Kadunce et al., 2001).
Because the mapping range in the present study was restricted to the central 60°, we cannot rule out that at least part of the auditory response fields extended outside the mapped proportion of space. Yet, most goal directed actions that we perform are directed toward or within frontal space. Because area VIP is thought to be involved in the guidance of actions, it is therefore likely to observe a bias toward a frontal representation of space. In line with this, many neurons in our study had a spatially distinct receptive field with their limits inside the central 60° (Figs. 3, 4, 7). Similarly, Graziano et al. (1999) demonstrated responses to auditory stimulation in ventral premotor cortex, a region to which area VIP projects. The response fields of these neurons were most frequently located in the frontal space.
Auditory and visual responses
We found that the variability and strength of the neuronal responses to the auditory stimulation were in the same range as those to the visual stimulation. Yet, there was a significant tendency for the visual responses to be stronger and more reproducible, indicating that the visual modality might still be dominant in this area, which is after all part of the “visual pathway.” Similarly, more neurons responded to the visual stimuli than to the acoustic ones (92 and 80%, respectively). However, an alternative explanation might be that the auditory stimulus was not optimal. We used stationary stimuli for the acoustic stimulation as opposed to the moving stimuli in the visual stimulus domain. Previous studies showed a clear preference for moving compared with stationary stimuli in the visual domain (Colby et al., 1993; Bremmer et al., 2002a). Hence, future studies are needed to determine whether area VIP neurons have such a preference also for motion in the auditory domain.
We also compared latencies and RF sizes in the two sensory modalities. The latency of the auditory response tended to be shorter than the visual latency, although this bias was not statistically significant. Yet, this trend is in line with the general observation of relatively short latencies within the auditory system (for review, see Shimojo and Shams, 2001). Our finding of a large range of auditory latencies might also indicate that the auditory responses are based on various sources of input into this area. This in turn would be in line with anatomical data on cortical connections as summarized by Lewis and Van Essen (2000). These authors state that area VIP receives auditory input from several areas including the temporal opercular caudal zone, temporal parietal occipital areas, temporoparietal area, and the auditory belt region CM (the caudomedial field).
The auditory RFs tended to be slightly larger than the visual ones, which is comparable with the findings of Kadunce et al. (2001), who studied multimodal responses in the superior colliculus. On the other hand, this tendency could also be related to the fact that the spatial resolution of the auditory system is poorer than the one of the visual system (for review, see King, 1999; Shimojo and Shams, 2001).
Auditory and visual space representation
We showed that the visual and auditory receptive fields of individual neurons were in general in close spatial proximity. A similar correspondence of visual and auditory receptive field locations during central fixation has been shown in a study in one of the major projection zones of area VIP (i.e., the face representation region in ventral premotor cortex) (Graziano et al., 1999). The authors arranged six loudspeakers around the head of the animal and found a spatial register of visual, tactile, and auditory receptive fields. The qualitatively similar results as obtained in our study indicate that the multisensory vPMC zone might receive its auditory spatial information from neurons in area VIP.
We observed that the spatial locations of auditory and visual RFs did not always perfectly match. One could argue that this spatial offset might be attributable to the motion aspect or the lack thereof in the visual and auditory stimuli, respectively. If this were the case, we would expect a correlation between the direction of the offset of the auditory RF relative to the visual RF on the one hand and the preferred direction of visual motion of a neuron on the other hand. We hence determined these angular differences but found no relationship between them across the population of neurons (p > 0.05; Rayleigh test). The difference in the motion aspect of the two stimulus modalities thus does not account for the nonoptimal alignment of visual and auditory receptive fields in some of the neurons.
Auditory and visual reference frames
In a second step of our study, we were interested in the reference frames in which the visual and auditory signals were represented. Therefore, we determined the visual and auditory receptive field locations while the monkey fixated three different locations along the azimuth. Approximately 30% of the neurons with spatially well aligned visual and auditory receptive fields during central fixation also tended to encode visual and auditory information in the same coordinate system. These neurons thus might be used to represent multisensory space in a modality-invariant manner and could be used to react to external stimuli regardless of their sensory identity.
However, most of the neurons used different reference frames to encode visual and auditory information. At first glance, this seems to challenge the idea of modality-invariant representations. However, “mismatches” of multimodal representations in single neurons have been found before in area VIP and other areas. For instance, we showed previously that some VIP neurons have different preferred directions for visually simulated and real vestibularly driven self-motion (Schlack et al., 2002). As discussed also in this previous study, this seemingly paradoxical response behavior might help to dissociate the motion signals arising from self-motion (synergistic visual and vestibular signals) from those arising from pure object motion (nonsynergistic visual and vestibular signals). Analog computational tasks might require neurons with noncoinciding reference frames in the two modalities as observed in our study.
Coordinate transformations
The finding of intermediate encodings of space has frequently been interpreted as an indication of (incomplete) coordinate transformations. In line with this, area VIP has been suggested to be involved in a coordinate transformation toward a head-centered representation of space (Graziano and Gross, 1998). Yet, we here show that the multisensory reference frames used by single neurons formed a continuum. Some neurons even encoded auditory space in an eye-centered reference frame, which constitutes a change away from the native reference frame of the auditory system. This contradicts the notion that the goal of the sensorimotor processing within area VIP is to transform spatial information toward a head-centered coordinate system and questions that intermediate encodings are just representations “on the way” to a final representation. Rather, our data support the idea put forward by a recent modeling study (Pouget et al., 2002). Pouget et al. (2002) suggest that space is encoded in a more flexible way in which intermediate encodings in themselves are meaningful. In addition to the modality-invariant representation of space, the brain might thus combine visual and auditory signals in a more flexible and dynamic manner. Interestingly, the latencies of the visual and auditory responses differed systematically depending on the modality and the reference frame of the spatial representation. Spatial representations for which coordinate transformations had to take place (head-centered encodings in the visual and eye-centered encodings in the auditory domain) led to longer latencies in the sensory responses.
Multisensory signals
Previous studies have shown that area VIP neurons respond to visual, vestibular, and somatosensory stimulation. Here, we show that VIP neurons respond also to auditory stimuli. We tested a subset of neurons also with vestibular stimulation to quantify how many of the neurons were unimodal, bimodal, or even trimodal in nature. Perhaps surprisingly, all neurons tested were either trimodal (76%) or at least bimodal (24%). Together with the results mentioned above, this suggests that area VIP plays an important role as a multisensory integration hub in parietal cortex.
Footnotes
This work was supported by the Human Frontier Science Program, European Union EUROKINESIS, and Deutsche Forschungsgemeinschaft. We thank T. D. Albright, T. A. Hackett, G. Horwitz, B. Krekelberg, and V. Ciaramitaro for helpful comments on this manuscript. We thank Claudia Distler for help with the surgery and histological analysis of the monkey(s).
Correspondence should be addressed to Frank Bremmer, Department of Neurophysics, Philipps-University Marburg, Renthof 7/202, D-35032 Marburg, Germany. E-mail: frank.bremmer@physik.uni-marburg.de.
Copyright © 2005 Society for Neuroscience 0270-6474/05/254616-10$15.00/0
References
- Andersen RA (1989) Visual and eye movement functions of the posterior parietal cortex. Annu Rev Neurosci 12: 377-403. [DOI] [PubMed] [Google Scholar]
- Andersen RA, Essick GK, Siegel RM (1987) Neurons of area 7 activated by both visual stimuli and oculomotor behavior. Exp Brain Res 67: 316-322. [DOI] [PubMed] [Google Scholar]
- Benson DA, Hienz RD, Goldstein Jr MH (1981) Single-unit activity in the auditory cortex of monkeys actively localizing sound sources: spatial tuning and behavioral dependency. Brain Res 219: 249-267. [DOI] [PubMed] [Google Scholar]
- Blauert J (1997) Spatial hearing. Cambridge, MA: MIT.
- Bremmer F, Schlack A, Shah NJ, Zafiris O, Kubischik M, Hoffmann K, Zilles K, Fink GR (2001) Polymodal motion processing in posterior parietal and premotor cortex. A human fMRI study strongly implies equivalencies between humans and monkeys. Neuron 29: 287-296. [DOI] [PubMed] [Google Scholar]
- Bremmer F, Duhamel JR, Ben Hamed S, Graf W (2002a) Heading encoding in the macaque ventral intraparietal area (VIP). Eur J Neurosci 16: 1554-1568. [DOI] [PubMed] [Google Scholar]
- Bremmer F, Klam F, Duhamel JR, Ben Hamed S, Graf W (2002b) Visual-vestibular interactive responses in the macaque ventral intraparietal area (VIP). Eur J Neurosci 16: 1569-1586. [DOI] [PubMed] [Google Scholar]
- Colby CL, Goldberg ME (1999) Space and attention in parietal cortex. Annu Rev Neurosci 22: 319-349. [DOI] [PubMed] [Google Scholar]
- Colby CL, Duhamel JR, Goldberg ME (1993) Ventral intraparietal area of the macaque: anatomic location and visual response properties. J Neurophysiol 69: 902-914. [DOI] [PubMed] [Google Scholar]
- Duhamel JR, Bremmer F, Ben Hamed S, Graf W (1997) Spatial invariance of visual receptive fields in parietal cortex neurons. Nature 389: 845-848. [DOI] [PubMed] [Google Scholar]
- Duhamel JR, Colby CL, Goldberg ME (1998) Ventral intraparietal area of the macaque: congruent visual and somatic response properties. J Neurophysiol 79: 126-136. [DOI] [PubMed] [Google Scholar]
- Furukawa S, Xu L, Middlebrooks JC (2000) Coding of sound-source location by ensembles of cortical neurons. J Neurosci 20: 1216-1228. [DOI] [PMC free article] [PubMed] [Google Scholar]
- Graziano MS, Gross CG (1998) Spatial maps for the control of movement. Curr Opin Neurobiol 8: 195-201. [DOI] [PubMed] [Google Scholar]
- Graziano MS, Reiss LA, Gross CG (1999) A neuronal representation of the location of nearby sounds. Nature 397: 428-430. [DOI] [PubMed] [Google Scholar]
- Grunewald A, Linden JF, Andersen RA (1999) Responses to auditory stimuli in macaque lateral intraparietal area. I. Effects of training. J Neurophysiol 82: 330-342. [DOI] [PubMed] [Google Scholar]
- Hartung K, Braasch J, Sterbing SJ (1999) Comparison of different methods for the interpolation of head-related transfer functions. In: Spatial sound reproduction, pp 319-329. New York: Audio Engineering Society.
- Hyvarinen J (1982) Posterior parietal lobe of the primate brain. Physiol Rev 62: 1060-1129. [DOI] [PubMed] [Google Scholar]
- Kaas JH, Hackett TA, Tramo MJ (1999) Auditory processing in primate cerebral cortex. Curr Opin Neurobiol 9: 164-170. [DOI] [PubMed] [Google Scholar]
- Kadunce DC, Vaughan JW, Wallace MT, Stein BE (2001) The influence of visual and auditory receptive field organization on multisensory integration in the superior colliculus. Exp Brain Res 139: 303-310. [DOI] [PubMed] [Google Scholar]
- King AJ (1999) Sensory experience and the formation of a computational map of auditory space in the brain. BioEssays 21: 900-911. [DOI] [PubMed] [Google Scholar]
- Lewis JW, Van Essen DC (2000) Corticocortical connections of visual, sensorimotor, and multimodal processing areas in the parietal lobe of the macaque monkey. J Comp Neurol 428: 112-137. [DOI] [PubMed] [Google Scholar]
- Middlebrooks JC, Pettigrew JD (1981) Functional classes of neurons in primary auditory cortex of the cat distinguished by sensitivity to sound location. J Neurosci 1: 107-120. [DOI] [PMC free article] [PubMed] [Google Scholar]
- Middlebrooks JC, Xu L, Eddins AC, Green DM (1998) Codes for sound-source location in nontonotopic auditory cortex. J Neurophysiol 80: 863-881. [DOI] [PubMed] [Google Scholar]
- Milner AD, Goodale MA (1995) The visual brain in action. Oxford: Oxford UP.
- Mrsic-Flogel TD, Schnupp JW, King AJ (2003) Acoustic factors govern developmental sharpening of spatial tuning in the auditory cortex. Nat Neurosci 6: 981-988. [DOI] [PubMed] [Google Scholar]
- Pouget A, Ducom JC, Torri J, Bavelier D (2002) Multisensory spatial representations in eye-centered coordinates for reaching. Cognition 83: B1-B11. [DOI] [PubMed] [Google Scholar]
- Recanzone GH, Guard DC, Phan ML, Su TK (2000) Correlation between the activity of single auditory cortical neurons and sound-localization behavior in the macaque monkey. J Neurophysiol 83: 2723-2739. [DOI] [PubMed] [Google Scholar]
- Sakata H, Shibutani H, Ito Y, Tsurugai K (1986) Parietal cortical neurons responding to rotary movement of visual stimulus in space. Exp Brain Res 61: 658-663. [DOI] [PubMed] [Google Scholar]
- Schaafsma SJ, Duysens J (1996) Neurons in the ventral intraparietal area of awake macaque monkey closely resemble neurons in the dorsal part of the medial superior temporal area in their responses to optic flow patterns. J Neurophysiol 76: 4056-4068. [DOI] [PubMed] [Google Scholar]
- Schlack A, Hoffmann KP, Bremmer F (2002) Interaction of linear vestibular and visual stimulation in the macaque ventral intraparietal area (VIP). Eur J Neurosci 16: 1877-1886. [DOI] [PubMed] [Google Scholar]
- Schoppmann A, Hoffmann K-P (1976) Continuous mapping of direction selectivity in the cat's visual cortex. Neurosci Lett 2: 177-181. [DOI] [PubMed] [Google Scholar]
- Shimojo S, Shams L (2001) Sensory modalities are not separate modalities: plasticity and interactions. Curr Opin Neurobiol 11: 505-509. [DOI] [PubMed] [Google Scholar]
- Sterbing SJ, Hartung K, Hoffmann KP (2003) Spatial tuning to virtual sounds in the inferior colliculus of the guinea pig. J Neurophysiol 90: 2648-2659. [DOI] [PubMed] [Google Scholar]
- Suzuki M, Kitano H, Ito R, Kitanishi T, Yazawa Y, Ogawa T, Shiino A, Kitajima K (2001) Cortical and subcortical vestibular response to caloric stimulation detected by functional magnetic resonance imaging. Brain Res Cogn Brain Res 12: 441-449. [DOI] [PubMed] [Google Scholar]
- Ungerleider LG, Mishkin M (1982) Two cortical visual systems. In: The analysis of visual behavior (Ingle DJ, Goodale MA, Maravita A, eds), pp 549-586. Cambridge, MA: MIT.


