

Abstract
We studied the temporal coding properties of identified interneurons in the auditory system of crickets, using information theory as an analytical tool. The ascending neuron 1 (AN1), which is tuned to the dominant carrier frequency (CF) of cricket songs, selectively codes the limited range of amplitude modulation (AM) frequencies that occur in these signals. AN2, which is most sensitive to the ultrasonic frequencies that occur in echolocation calls of insectivorous bats, codes a broader range of AM frequencies, as occur in bat calls. A third neuron, omega neuron 1 (ON1), which is dually tuned to both ranges of carrier frequency, was shown previously to have CF-specific coding properties, allowing it to represent accurately the differing temporal structures of both cricket songs and bat calls. ON1 is a source of contralateral inhibition to AN1 and AN2, enhancing binaural contrast and facilitating sound localization. We used dichotic stimulation to examine the importance of the temporal structure of contralateral inhibition for enhancing binaural contrast. Contralateral inhibition degrades the coding of temporal pattern by AN1 and AN2, but only if the temporal pattern of inhibitory input matches that of excitation. Firing rate is also decreased most strongly by temporally matched contralateral inhibition. This is apparent for AN1 in its mean firing rate; for AN2, high-frequency firing is selectively suppressed. Our results show that the CF-specific coding properties of ON1 allow this single neuron to enhance effectively localization cues for both cricket-like and bat-like acoustic signals.
Keywords: cricket, temporal coding, auditory, information theory, phonotaxis, communication
Introduction
Sensory information processing often relies on precisely timed neural activity (Fricker and Miles, 2001; Lestienne, 2001; Cariani, 2004). This is particularly clear for circuits involved in sound localization. For example, in the avian nucleus laminaris and the mammalian superior olivary complex, the relative timing of converging bilateral inputs is an important factor determining neuronal responses (Oertel, 1999). The timing of these inputs is determined by the timing and intensity of sound as it reaches each ear but also by the temporal response properties of the neurons that carry this information: precise temporal coding of the stimulus allows precise bilateral interaction (Carr, 1993; Brand et al., 2002). Natural stimuli, such as communication sounds, contain characteristic patterns of amplitude modulation (AM), and neurons are often specialized to represent precisely the temporal features of these stimuli (Rieke et al., 1995; Theunissen et al., 2000; Machens et al., 2001; Nagarajan et al., 2002).
Crickets communicate with sounds that are amplitude modulated at species-specific rates (Pollack, 1998). They also respond to echolocation sounds emitted by insectivorous bats, which differ from communication signals in both carrier frequency (CF) and rates of AM. An identified neuron early in the cricket's auditory pathway, the omega neuron 1 (ON1), is dually tuned, with enhanced sensitivity to both ranges of carrier frequency. ON1 is also dually tuned with respect to its coding of the stimulus amplitude envelope (Marsat and Pollack, 2004). When stimulated with cricket-like carrier frequency, the spike train of ON1 selectively codes the narrow range of AM rates that occur in cricket songs. When the stimulus carrier frequency is bat-like, ON1 codes a broader range of AM rates, corresponding to the temporal structures of echolocation sounds.
ON1 participates in sound localization by increasing bilateral contrast through contralateral inhibition of the paired ascending neurons (ANs) AN1 and AN2 (as well as of the contralateral ON1), which respectively carry information about cricket-like and bat-like sound frequencies to the brain (Pollack, 1998). These neurons have been shown to be crucial for phonotactic responses toward cricket songs and away from ultrasound, respectively (Nolen and Hoy, 1984; Schildberger and Hörner, 1988). Positive phonotaxis depends strongly on the stimulus temporal pattern (Pollack, 1998). Analysis of temporal pattern appears to occur in the brain by circuits that receive afferent input from AN1 (Schildberger, 1984). Crickets can discriminate between patterns presented simultaneously from the two sides (Pollack, 1986), suggesting that the bilateral difference in representation of temporal patterns by the left and right AN1s influences orientation (Stable et al., 1989). The probability of responding to ultrasound stimuli does not depend on stimulus temporal pattern, although temporal pattern may affect sustained responses (Pollack and El-Feghaly, 1993). Stimulus direction is determined from bilateral comparison of activity in AN2 (Nolen and Hoy, 1984; Samson and Pollack, 2002).
In this study, we describe the temporal coding properties of AN1 and AN2. We show that the timing of contralateral inhibition affects both the firing rate and the accuracy with which the sound pattern is represented in these ANs.
Materials and Methods
Electrophysiology. Teleogryllus oceanicus were reared in the laboratory. Virgin females were used for experiments at the age of 10-20 d after final molt. They were anesthetized by chilling on ice and mounted on a support ventral-side uppermost. The prothoracic ganglion was exposed by ventral dissection, supported on a metal platform, and bathed in physiological saline (Strausfeld et al., 1983).
AN1 and AN2 were recorded extracellularly from the cervical connective, which was cut anteriorly. The connective was desheathed and separated into medial and lateral bundles. The medial bundle was wrapped several times around a stainless-steel hook electrode and covered with a mixture of petroleum jelly and mineral oil for electrical isolation. Spikes of AN1 and AN2 are easily identified by their relative amplitudes (AN1 ≪ AN2) and by frequency sensitivity (best frequency, AN1, 4-5 kHz; AN2, 15-30 kHz) (for additional details, see Faulkes and Pollack, 2000; Moiseff and Hoy, 1983). To reduce background activity, we cut the promesothoracic connectives. ON1 was recorded extracellularly from its soma-contralateral processes in the prothoracic ganglion, using blunt glass microelectrodes filled with 1 m NaCl (resistance, 5-10 MΩ). ON1 can be identified in this recording configuration by its preference for electrode-contralateral stimuli, as well as its greater sensitivity, but longer latency, to 4.5 kHz stimuli compared with ultrasound stimuli (Faulkes and Pollack, 2000). In this study, “ipsilateral” refers to the side from which sound most effectively excites the neuron. For ON1, this is ipsilateral to the soma; for the ANs, this is ipsilateral to their ascending axons (Wohlers and Huber, 1982). Recordings were amplified by a Grass P15 amplifier (Astro-Med, West Warwick, RI; for hook recordings) or a Getting 5A microelectrode amplifier (Getting Instruments, San Diego, CA) and digitized (16 bits; sampling rate, 10 kHz; Digidata 1320A; Molecular Devices, Palo Alto, CA).
Sound stimulation. Threshold was defined as the sound intensity that reliably elicits at least one spike per sound pulse (30 ms sound pulses, including 5 ms onset and offset ramps, presented at 2 Hz). CF was either 4.5 or 30 kHz.
Stimuli with random amplitude modulation envelopes (RAM) were produced by multiplying a sinusoidal signal, of desired carrier frequency, with a low-pass-filtered Gaussian signal (<200 Hz) with a SD of 5 dB. RAM stimuli were 15 s long with 0.1 s linear onset and offset ramps, and were separated by at least 45 s of silence. Stimuli were generated by a National Instruments (Austin, TX) analog-to-digital/digital-to-analog board with 12 bits of resolution, at a sampling rate of 100 kHz.
For free-field stimulation, the cricket's front legs (which bear the ears) were held flexed against the pronotum in a position similar to that assumed during flight. Sound was broadcast from loudspeakers situated to the cricket's left and right, perpendicular to the longitudinal axis. For closed-field stimulation, the legs were held horizontally and were inserted in cylindrical chambers containing earphones (Optimus Nova 401; Radio Shack). The “acoustic” trachea linking the two ears was severed to ensure stimulus isolation (Michelsen and Löhe, 1995). The chambers were 14 mm in diameter and 3 mm in length, and had calculated resonance frequencies >50 kHz (Filippi, 1999). The chambers were sealed with wax. Thresholds of AN1 and AN2 were at least 50 dB higher for contralateral than for ipsilateral stimuli. In closed-field experiments, stimuli at the ear ipsilateral to the ANs were either 65 dB sound pressure level (SPL) and 4.5 kHz, or 80 dB SPL and 30 kHz. Stimuli at the ear ipsilateral to ON1 were 8 dB higher than those to the AN-ipsilateral ear, simulating a sound source on the ON1-ipsilateral side of the cricket. These stimulus intensities were chosen because they evoked robust responses in all three neurons, and they fall within the intensity ranges that crickets are likely to encounter in the field (Nocke, 1972; Miller and Surlykke, 2001).
For both stimulation methods, sound level was calibrated using Brüel and Kjaer (Naerum, Denmark) instruments (4135 microphone; 2610 sound-level meter).
Data analysis. We quantified the information available in the spike train of a neuron about modulations in stimulus amplitude by calculating information transfer functions. The exact information content can be evaluated based on the variability between responses to repeated presentations (n = 4) of the identical RAM stimulus. Highly similar patterns of spiking across responses indicate accurate temporal coding, whereas responses bearing little similarity in firing pattern will carry little information about the stimulus pattern (for general reference, see Rieke et al., 1997).
Spike timing was compared between pairs of responses by calculating response-to-response coherence (Roddey et al., 2000). Spike trains, r(t), expressed as binary events, were separated into overlapping, Hanning-windowed, 300 ms segments, and then converted to the frequency domain [R(f)], using the fast Fourier transform. The resulting arrays for a pair of responses, Ri(f) and Rj(f), were used to calculate coherence as follows:
 |
where * indicates the complex conjugate of the variable it follows, and  indicates averaging across the 300 ms response segments. This calculation was performed for all pairwise combinations of responses to the same stimulus and averaged across response pairs, yielding
  . As explained by Roddey et al. (2000), we used the square root of the response-to-response coherence to calculate information rates as follows:
 |
Assuming that the performance of the neuron is deteriorated only by Gaussian additive noise that is independent of the signal, this measure represents the total information content of the responses (Borst and Theunissen, 1999). We showed previously (Marsat and Pollack, 2004) that the distributions of response and noise were Gaussian for ON1.
Both linear and nonlinear coding can contribute to information coding. If coding is truly linear, a linear model will capture all of the information transmitted by the neuron; otherwise, the linear model yields a lower bound of information transmission. We assessed the degree of nonlinear coding by comparing the information transfer function calculated as above with a lower-bound estimate (Borst and Theunissen, 1999).
Lower-bound information transfer functions were calculated using reverse reconstruction. We used the same standard technique described in detail previously (Theunissen et al., 1996; Clague et al., 1997; Marsat and Pollack, 2004). Arrays representing firing rate, r(t), and the stimulus envelope, s(t), were expressed as variations around their respective means, yielding r′(t) and s′(t). These arrays were segmented and converted to the frequency domain as described above, yielding R′(f) and S′(f). The frequency-domain representation of the linear reverse filter for response i was calculated as follows:
 |
Hi(f) was converted to the time domain, hi(t), using the inverse Fourier transform. hi(t) was convolved with ri(t) to reconstruct the estimate of the stimulus derived from the spike train, esti(t). Noise, ni(t), was computed as follows: si(t) - esti(t). Signal-to-noise ratio, SNRi(f), was computed as the power spectrum of esti(t) divided by that of ni(t), SNRi(f) was averaged for all i and information transfer was calculated from  according to the following equation:
 |
We quantified the breadth of information transfer functions by their half-widths, defined as the range of AM frequencies at which information rate is higher than one-half of the maximum.
Our calculations assume that response statistics are stationary over time (Rieke et al., 1997), yet the neurons studied here adapt markedly shortly after sound onset. Therefore, responses were analyzed starting 5 s after sound onset to restrict our analysis to the portion during which firing rate is stable.
Data analysis was performed with Matlab 6.5 (Mathworks, Natick, MA). Statistical tests on proportions were performed on arcsine, square root-transformed data (Zar, 1999). We used Statistica 5.5 (Statsoft, Tulsa, OK) for all tests of significance.
Results
Temporal coding in the ascending neurons
The information content in the response of a neuron about the temporal structure of a stimulus can be characterized by the information transfer function. We computed information transfer functions for AN1 and AN2 for responses to RAM stimuli. The dominant frequency of T. oceanicus songs is ∼4.5 kHz (Balakrishnan and Pollack, 1996), as is the best frequency of AN1 in this species (Faulkes and Pollack, 2000). Accordingly, CF was 4.5 kHz for AN1. The frequency content of bat echolocation sounds ranges from 20 to >100 kHz. CF of stimuli for AN2 was 30 kHz, which is well within the range of the best sensitivity of this neuron (Moiseff and Hoy, 1983).
Peak information transfer rate for AN1 occurs at AM frequencies ranging from 12 ± 3.1 to 23.3 ± 12.1 Hz, shifting to higher frequencies with increasing intensity (ANOVA; p = 0.01) (Fig. 1A). This corresponds to the range of sound-pulse rates that are most effective at eliciting positive phonotaxis (Pollack and El-Feghaly, 1993; Hennig and Weber, 1997). The information transfer rate drops sharply at ∼30 Hz. As a result, AN1 codes only a rather limited range of AM frequencies (range of half-widths, 34.6 ± 3.4 to 37.1 ± 3.9 Hz), corresponding to the AM frequencies that occur in conspecific songs (∼8-32 Hz) (Balakrishnan and Pollack, 1996). Peak information transfer rate decreases with increasing stimulus intensity, from 2.1 ± 0.1 bits/s at 15 dB above threshold to 1.2 ± 1.2 bits/s at 35 dB above threshold (ANOVA; p = 0.003). Mean firing rate increases with intensity (ANOVA; p = 0.0007), saturating at 25 dB above threshold (Tukey test; p = 0.4).
Figure 1.
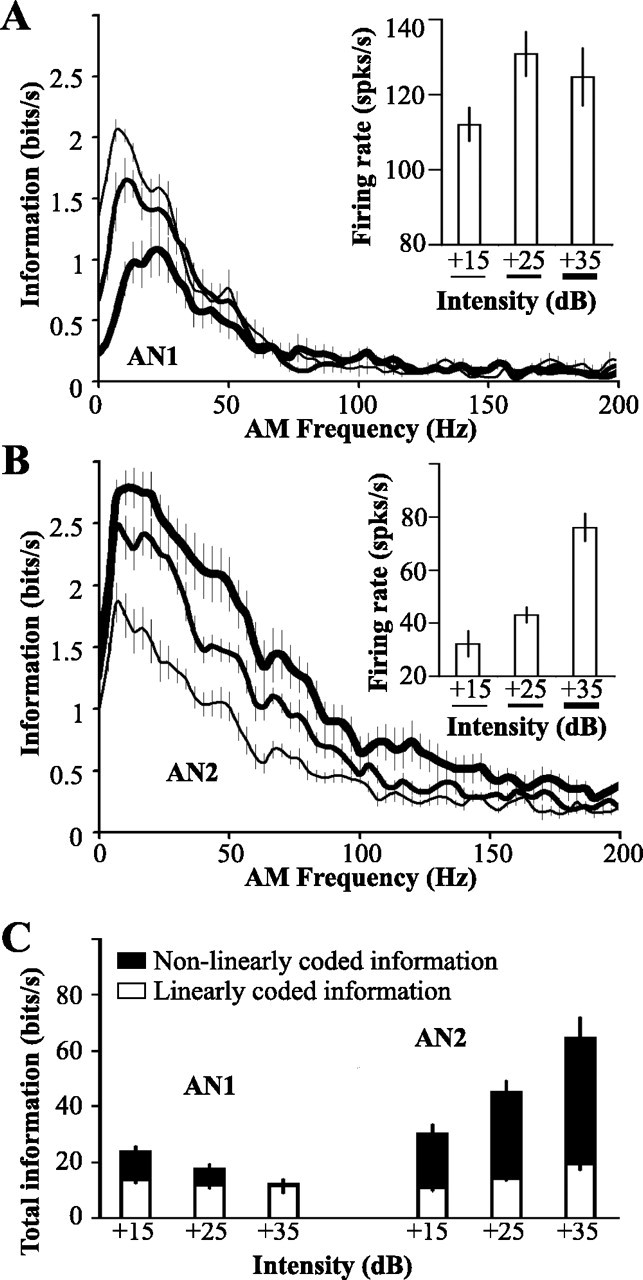
Temporal coding by AN1 and AN2. RAM stimuli were presented with mean intensities 15, 25, or 35 dB above threshold, with CF of 4.5 kHz for AN1 and 30 kHz for AN2. Mean ± SD threshold of AN1, 46.1 ± 4.2 dB SPL; threshold of AN2, 53.2 ± 5.1 dB SPL. A, Mean ± SE information transfer rate of AN1, n = 7; inset shows mean firing rate as a function of stimulus intensity. B, Mean ± SE information transfer rates of AN2, n = 8; inset as in A. C, Mean ± SE total information content of AN1 and AN2 spike trains (areas under the curves in A and B). Open portions of bars show information content accounted for by a linear model of coding; filled portions represent the degree of nonlinear coding (see Materials and Methods). Total information was calculated by summing information rates only for those AM frequencies at which information rate differed significantly from zero, as assessed by jackknife resampling (Efron and Tibshirani, 1993).
For AN2, peak information transfer rate occurs at AM frequencies between 7.9 ± 1.9 and 11.9 ± 1.5 Hz and decreases gradually with increasing AM frequency (Fig. 1B). With increasing intensity, both the height and breadth of the information transfer function increases (peak, from 1.9 ± 0.2 to 2.9 ± 0.1 bits/s; ANOVA; p = 0.004; half-width, from 46.3 ± 1.7 to 64 ± 6.8 Hz; ANOVA; p = 0.01). Thus, stimulus intensity affects coding accuracy of AN1 and AN2 differently. For AN1, total information decreases with increasing intensity, whereas it increases for AN2 (ANOVA; for AN1, p = 0.04; for AN2, p = 0.002) (Fig. 1C).
These information transfer rates were calculated making no assumptions about the nature of the neural code (see Materials and Methods). We also calculated information rates based on a linear model. The difference between total information and that accounted for by a linear model represents the amount of nonlinear coding (Fig. 1C). AN1 and AN2 differ in the amount of nonlinear coding. For AN2, linearly coded information accounts for less than one-third of the total information content, whereas more than one-half of the information content of AN1 can be accounted for by a linear code (ANOVA; neuron effect; p < 0.0001).
Contralateral inhibition and coding in the ANs
ON1 provides contralateral inhibition to AN1 and AN2, thereby enhancing bilateral contrast for both cricket-like and bat-like stimuli. Previous work showed that ON1 accounts for all measurable contralateral inhibition of the ANs (Faulkes and Pollack, 2000). To assess the influence of contralateral inhibition on temporal coding by the ANs, we recorded simultaneously from AN1 and AN2 and from the ON1 that inhibits them. Because the excitatory input to the ANs and to ON1 originates in opposite ears, we could control independently excitation and contralateral inhibition of the ANs using dichotic stimulation (Fig. 2A).
Figure 2.
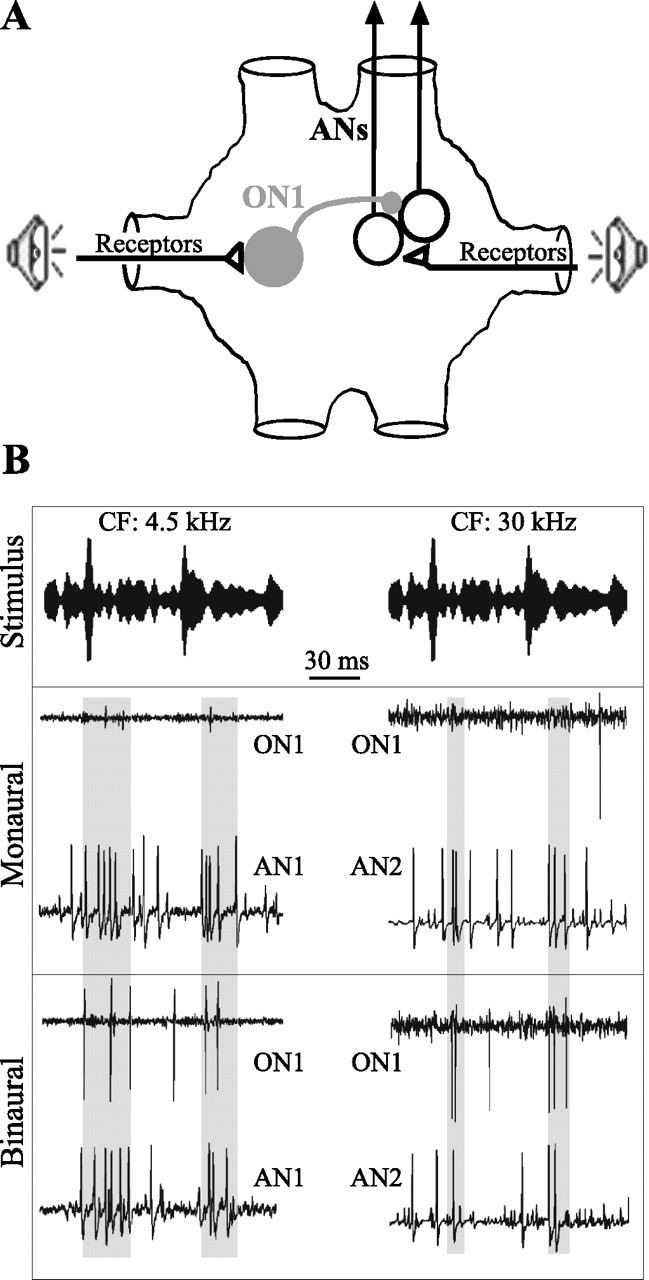
Dichotic stimulation and responses of AN1, AN2, and ON1. A, Schematic drawing of the connections between receptors, AN1 and AN2 (denoted here as ANs), and ON1. All three interneurons exist as mirror image pairs; only the recorded neurons are shown. B, Excerpts of the responses of AN1, AN2, and ON1 to RAM stimuli during monaural and binaural stimulation. Responses to 4.5 and 30 kHz are from different experiments. The shaded areas highlight increased spiking of ON1, and decreased spiking of the ANs, for binaural stimulation.
The effects of contralateral inhibition on the ANs are illustrated in Figure 2. Binaural stimulation, and the resulting activation of ON1, results in decreased firing rate in the ANs relative to that during monaural stimulation. This is particularly obvious, in the excerpts shown, after the two conspicuous increases in stimulus amplitude (shaded areas).
As we reported previously (Marsat and Pollack, 2004), ON1 codes a narrow range of AM rates when stimulated with cricket-like CF, and a broader range for ultrasound stimuli. A similar difference in coding of stimuli with these two CFs, but represented by distinct neurons, is apparent in the responses of AN1 and AN2. Coding of 4.5 kHz stimuli by AN1 (whether stimuli were monaural or binaural) spans a similar range of AM frequencies as are coded by ON1 for the same CF (Fig. 3A). Similarly, coding of 30 kHz stimuli by AN2 and by ON1 extends to higher AM frequencies, although the information transfer curve of ON1 is broader than that of AN2 (Fig. 3B). Thus, in a manner similar to the CF-specific coding of ON1, coding of bat-like CF, by AN2, is broader than coding of cricket-like CF, by AN1 (AN1 half-width, 38.1 ± 4.9, vs AN2, 68.5 ± 9.5 Hz; paired t test; p < 0.0001).
Figure 3.

Temporal coding and the effect of contralateral inhibition. Stimuli were presented dichotically. AN-ipsilateral stimuli were either 4.5 kHz and 65 dB SPL (for experiments on AN1) or 30 kHz and 80 dB SPL (for AN2 recordings). ON1-ipsilateral stimuli, if present, had the same carrier frequency as the AN-ipsilateral stimulus, and sound level was 8 dB higher to mimic free-field stimulation from the ON1-ipsilateral side. A, B, Mean ± SE information transfer functions (n = 13) of AN1 (A), AN2 (B), and ON1 are shown for monaural (labeled I; denoting stimulation from the AN-ipsilateral ear only) and binaural stimuli (I+C; both the AN-ipsilateral and the AN-contralateral ear are stimulated). During monaural stimulation, ON1 fired at similar rate as during silence (<8 spks/s) and did not code the stimulus (data not shown). Inset, Mean firing rates. C, Differences between information transfer curves for monaural and binaural stimulation.
The effects of contralateral inhibition on information transfer rates of the ANs reflect these CF-related differences in coding. Contralateral inhibition decreases coding accuracy of AN1 most severely for AM frequencies <40 Hz (Fig. 3A,C). This is attributable, of course, to the poor coding of higher AM frequencies by AN1, leaving little room for additional decrease in information transfer rate. The decrease in coding accuracy of AN2 extends up to 70 Hz (Fig. 3B,C). Thus contralateral inhibition produces a larger decrease in information content at high AM frequencies for AN2 than for AN1 (ANOVA; p = 0.02; Tukey test; p < 0.05 for AM frequencies between 43 and 80 Hz). Contralateral inhibition also decreased mean firing rate in AN1 and AN2, by 18 and 22%, respectively.
Spiking pattern and inhibitory influence of ON1 on the ANs
Contralateral inhibition might depend only on the mean firing rate of ON1. Alternatively, the precise timing of ON1 spikes relative to excitatory input to the ANs might affect its inhibitory impact. We examined these possibilities by controlling separately the temporal patterns of stimuli at the two ears.
Contralateral inhibition resulting from ON1-ipsilateral stimulation with a constant tone had no effect on coding accuracy of AN-ipsilateral RAM stimuli for either AN1 or AN2, although it did reduce their mean firing rates (Fig. 4A). Although the ON1-ipsilateral stimulus had constant amplitude, the spike train of ON1 might, in principle, still reflect the temporal pattern of the stimulus presented to the AN-ipsilateral ear, as a result of temporally patterned inhibition from the AN-ipsilateral ON1. In fact, however, there was no statistically significant coding of the AN-ipsilateral RAM stimulus by ON1 (p > 0.05; jackknife resampling) (Efron and Tibshirani, 1993), perhaps because the higher ON1-ipsilateral stimulus level (see Materials and Methods) masked any effects of temporally patterned inhibition. Firing rate of ON1 was similar for RAM and constant amplitude stimuli [4.5 kHz RAM, 52.4 ± 5.3 spikes (spks)/s, vs tones, 51.8 ± 5.1 spks/s; paired t test; p = 0.8; 30 kHz RAM, 43.9 ± 2.7 spks/s, vs tones, 40.1 ± 2.3 spks/s; p = 0.04], suggesting that the lack of effect on coding by the ANs was attributable specifically to disturbance of the normal temporal relationship between excitatory and inhibitory inputs. We tested this hypothesis by presenting different RAM stimuli (but with identical bandwidth and SD) to the two ears. Under these stimulus conditions, ON1 codes the ON1-ipsilateral AM envelope with accuracy similar to that shown in Figure 3 (data not shown). As for contralateral stimulation with constant tones, contralateral stimulation with a different RAM stimulus caused a decrease in firing rate of the ANs but had no effect on their temporal coding (Fig. 4B).
Figure 4.

Temporal pattern of contralateral inhibition and information transfer rates. In each panel, mean ± SE information transfer curves (n = 9) are shown for monaural presentation of a RAM stimulus (I; thick black lines) and for binaural stimulation with the same RAM stimulus (I+C; thin black lines). The gray lines are the transfer functions for binaural stimulation with the following stimuli presented to the ON1-ipsilateral ear: a constant tone with same CF as the AN-ipsilateral RAM stimulus (I+CTO) (A); a RAM stimulus with different AM envelope, but identical bandwidth, SD, and CF as the AN-ipsilateral stimulus (I+CENV)(B); a RAM stimulus with the same AM envelope as the AN-ipsilateral stimulus but with different carrier frequency (I+CCF) (C). Because the mean firing of ON1 differs for stimuli with the same mean intensity relative to threshold but different CF (Marsat and Pollack, 2004), we adjusted the intensity of the ON1-ipsilateral stimulus so that firing rate was similar to that for I+C stimulation. Points that are indicated by filled circles (I+C) or open triangles (I+CCF) differ significantly from the corresponding points for monaural stimulation (I; ANOVA followed by Tukey; p < 0.05). Firing rates, shown in insets, were lower for all binaural conditions compared with the corresponding monaural one (ANOVA followed by Tukey; p < 0.05).
These findings suggest that ON1 s differential temporal coding of low-frequency and ultrasound stimuli may fine-tune the temporal structure of contralateral inhibition so as to match the different temporal coding properties of AN1 and AN2. We explored this possibility by presenting RAM stimuli with identical amplitude envelopes, but different CFs, to the two ears. When the AN-ipsilateral ear is stimulated with ultrasound and the ON1-ipsilateral ear with cricket-like CF, information transfer in AN2 is decreased only for the narrow range of AM frequencies that are well coded by ON1 (Fig. 4C, bottom), rather than over a broad range, as occurs for ON1-ipsilateral ultrasound stimuli. Unlike the situation described previously, in which a floor effect explained the restricted range over which coding by AN1 was affected (Fig. 3A,C), here the limited range of effectiveness is attributable to the temporal pattern of contralateral inhibition.
In contrast, the CF of the contralateral stimulus has only a minor effect on the decrease in coding of a low-CF RAM by AN1 (Fig. 4C, top). This is not surprising given that, even for ultrasound stimuli, the coding of ON1 includes the range of low-AM frequencies that are well coded by AN1 (Fig. 3).
We summarize the effects of contralateral inhibition on the responses of the ANs in Figure 5. The decrease in the information content of AN1 was greatest when the stimuli to the two ears had the same amplitude envelope. This decrease did not differ, however, for 4.5 and 30 kHz contralateral stimuli (Fig. 5A). Similarly, the decrease in firing rate was greatest (∼18%) for contralateral stimuli with the same pattern, independently of the CF of the contralateral stimulus (Fig. 5B). For AN2, both the temporal pattern and the carrier frequency of the contralateral stimulus affect the decrease in information transfer rate. Interestingly, the decrease in the firing rate of AN2 (lower by ∼22%) was independent of both the pattern and the CF of the contralateral stimulus.
Figure 5.

Summary of effects of contralateral stimulation. A, Mean difference ± SE in total information between responses to monaural and binaural stimulation. Total information for monaural stimulation shown in parentheses. B, Mean ± SE percentage decrease in mean firing rates for binaural stimulation compared with monaural stimulation. Firing rates for monaural stimulation shown in parentheses. Asterisks indicate significant differences from the I+C condition (black bars); ANOVA followed by Tukey's test; p < 0.05. Notation for stimulus conditions (legend) as in Figures 3 and 4.
We also examined the importance of the timing of contralateral inhibition by comparing the moment-to-moment variations in firing rates of ON1 and the ANs. We recorded simultaneously from ON1 and the ANs for both monaural stimulation (of the ear driving the ANs) and for binaural stimulation. For a pair of binaural/monaural responses, the spike trains were transformed to instantaneous firing rates [inverse of interspike intervals (ISIs)]. We computed the difference in instantaneous firing rate of the ANs between the two stimulus conditions (binaural-monaural). This new variable reflects the effect of contralateral inhibition (and noise). We generated a similar variable for ON1, reflecting its stimulus-driven spiking. An example of the relationship between these two variables is shown in Figure 6A. We calculated the coherence between the two variables, a measure of their temporal correlation, as described in Materials and Methods.
Figure 6.

Coherence between variations in instantaneous firing rates of ON1 and ANs. A, Instantaneous firing rate of ON1 and AN2 (for excerpts shown in Fig. 2 B) during monaural and binaural stimulation (left). The difference in instantaneous firing rate between response to binaural and monaural stimulation is shown on the right. B, Coherence of firing rate differences (as shown in A, right) between ON1 and AN1 (top) and ON1 and AN2 (bottom). ON1-ipsilateral stimuli had CF of either 4.5 kHz (black lines) or 30 kHz (gray lines); AN1- and AN2-ipsilateral stimuli were 4.5 and 30 kHz, respectively. Curves are means ± SE; n = 9.
For low-CF ON1-ipsilateral stimuli, changes in firing rate of ON1 and of the ANs are coherent only at low modulation frequencies (Fig. 6B). The coherence is maximal for modulation frequencies of ∼16 Hz. For ultrasonic ON1-ipsilateral stimuli, modulations in firing rate of ON1 and of the ANs are coherent over a wider range of modulation frequencies (Fig. 6B). This analysis confirms that contralateral inhibition affects the temporal structure of responses of the ANs only for modulation rates that are well coded by ON1.
Inhibition and high-frequency firing in AN2
Evasive behavior is triggered by high firing rate (>190 Hz) in AN2 (Nolen and Hoy, 1984). We examined the ISI distribution of the response of AN2 to evaluate the impact of contralateral inhibition specifically on periods of high-frequency firing. Ultrasound avoidance occurs with short latency (Nolen and Hoy, 1986) but also may persist for several seconds (Pollack and El-Feghaly, 1993). Accordingly, we examined separately the ISI distribution shortly after sound onset (0-1 s) (Fig. 7A) and during the sustained portion of the response (1-14 s) (Fig. 7B). For monaural stimulation with a 30 kHz RAM stimulus, short ISIs (<5 ms) are frequent during both time periods. In the sustained portion of the response, after adaptation is established (Samson and Pollack, 2002), AN2 spikes occur in bursts of high-frequency firing separated by more sparsely spaced spikes, as indicated by the bimodal distribution of ISIs typical of bursting neurons (Fig. 7B).
Figure 7.

Effects of contralateral inhibition on ISI distribution of AN2 responses. Histograms show the mean number of ISIs per second; bin width, 1 ms. A, B, Mean ± SE ISI distributions (n = 9) for the initial portion of the response (0-1 s after sound onset) and the adapted portion (1-14 s), respectively. Insets, Percentage of ISIs <5 ms. We indicate with a dotted line the 5 ms mark. Stimulus notation as for Figures 3 and 4.
Although the CF of contralateral stimulation has no effect on the decrease in the mean firing rate of AN2 (Fig. 5), it has a profound effect on its ISI distribution. In the presence of 30-kHz-driven contralateral inhibition, the initial ISI distribution of AN2 has fewer ISIs between 1 and 5 ms but more between 12 and 14 ms (ANOVA and Tukey test; p < 0.05); thus, contralateral inhibition decreases the proportion of short ISIs (p < 0.05; ANOVA, followed by Tukey test) (Fig. 7A, inset). This change in the ISI distribution occurs only when the ON1-ipsilateral ear is stimulated with ultrasound. When the contralateral inhibition is driven by 4.5 kHz stimuli, the proportion of ISIs shorter than 5 ms is similar to that for monaural stimulation (p > 0.05). A similar influence of the CF-specific inhibition of ON1 is seen during the adapted portion of the response. Only contralateral inhibition driven by 30 kHz stimuli decreases the proportion of short ISIs (p < 0.05) (Fig. 7B, inset).
Discussion
AN1 and AN2, which are tuned to the CFs of cricket songs and bat sounds, respectively, have temporal coding properties that are matched to the structures of these signals. We showed previously (Marsat and Pollack, 2004) that the temporal coding properties of ON1 differ for cricket-like and bat-like CFs, and in the present study, we show that this has functional consequences. The correspondence between coding by ON1 and by the ascending neurons results in more effective suppression of information transmission. Faulkes and Pollack (2000) also studied the effects of the timing of contralateral inhibition on responses of AN1. Using single brief sound pulses, they found that contralateral inhibition did not affect first-spike latency of AN1. However, it is clear from their data (their Fig. 4A) that the temporal organization of succeeding spikes was severely affected. The matched coding properties of ON1 and the ANs also result in greater decrease in firing rate of the ascending neurons. For AN1, this is apparent in its mean firing rate, and for AN2, in the frequency of short interspike intervals.
Contralateral inhibition affects ascending information about cricket song
Activity of AN1 (and to a lesser extent, of AN2) is important for both recognition and localization of cricket songs. The roles of these neurons in localization have been demonstrated by hyperpolarizing them while crickets performed phonotaxis toward song models. Hyperpolarizing AN1 on one side caused crickets to orient toward the other side independent of the location of the sound source, showing that the direction of orientation is influenced by bilateral comparison of activity in the AN1 pair. Hyperpolarization of AN2 led to similar, although less pronounced, deviations toward the other side (Schildberger and Hörner, 1988). Song recognition in crickets is based mainly on stimulus temporal pattern (Pollack, 1998), and AN1 is the main source of afferent input to temporal-pattern-filtering circuits in the brain (Schildberger, 1984). Its selective coding of temporal pattern implies that these brain circuits will receive accurate information about stimulus structure only for a limited range of AM rates, similar to those that occur in cricket song.
Contralateral inhibition degrades temporal coding by AN1 and thus will result in a bilateral difference in the quality of information about temporal pattern coded by the AN1 pair. Stable et al. (1989) showed that crickets orient toward the side where the temporal pattern of the attractive stimulus is best represented by the spike trains of the ANs, rather than simply to the side where mean firing rate is highest. This suggests that the degradation of temporal coding that we describe will affect orientation.
The pathways by which ascending activity affects phonotaxis toward cricket song are not clear. Previous studies suggested that phonotaxis direction might be determined by comparing the outputs of bilaterally paired recognition circuits in the brain (Pollack, 1986; Stable et al., 1989). Although this functional intertwining of recognition and localization seems cumbersome, it might allow crickets to track individual songs in a complex acoustical environment (for additional discussion, see von Helversen and von Helversen, 1995). More recent work, however, shows that the motor drive for phonotaxis involves reflex-like circuitry that is not directly routed through recognizers in the brain (Hedwig and Poulet, 2004). Recognition circuits may nevertheless influence orientation through descending modulation of local circuitry, and this descending influence might be affected by bilateral differences in information content of the ANs.
Precise contralateral inhibition and localization of bat sounds
Both AN2 and ON1 (when stimulated with ultrasound) code relatively broad ranges of AM frequencies. Furthermore, they both encode ultrasound stimuli in a primarily nonlinear manner (for ON1, see Marsat and Pollack, 2004), unlike the responses to cricket-like CF of AN1 and ON1, in which nonlinear coding is less pronounced. This similarity of their coding properties allows ON1 to provide temporally matched contralateral inhibition to AN2. As for AN1 (see above), information transfer was suppressed maximally when the temporal pattern of contralateral inhibitory input to AN2 matched the response pattern of AN2. The initiation of negative phonotaxis is not temporal-pattern selective, but sustained responses to ultrasound do vary with stimulus temporal pattern (Pollack and El-Feghaly, 1993); thus the temporal information in the spike train of AN2 might affect ultrasound-elicited behavior.
The key feature of the response of AN2 for triggering bat avoidance is high instantaneous firing rate (Nolen and Hoy, 1984). We show that contralateral inhibition selectively affects high-frequency firing in AN2, but only when the response of ON1 matches the temporal pattern of that of AN2. Contralateral inhibition is therefore expected to enhance the bilateral difference in the responses of AN2 specifically during periods of high instantaneous firing rate.
Precisely timed contralateral inhibition is important for directional processing in other systems. In locusts, the response of an identified interneuron switches from nearly complete suppression to nearly maximal excitation with a shift in binaural stimulus timing of as little as 2 ms (Rheinlaender and Mörchen, 1979). In the gerbil medial superior olive as well, sensitivity to interaural timing difference is shaped by temporally precise inhibition (Brand et al., 2002; Grothe, 2003). Similarly, sensitivity to interaural intensity difference in the lateral superior olive and inferior colliculus of bats depends on the latency and duration of contralateral inhibition (Park et al., 1996; Park, 1998; Oswald et al., 1999; Irvine et al., 2001).
The distinct coding properties of ON1 for cricket-like and bat-like stimuli, which we described previously (Marsat and Pollack, 2004), are also seen at the level of the ANs with which ON1 interacts. We show that contralateral inhibition is most effective when the responses of ON1 and of its targets are temporally matched. Thus, the response properties of ON1 allow this single neuron to effectively enhance binaural contrast for two distinct, behaviorally relevant, stimuli.
Footnotes
This work was supported by the Canadian Institutes for Health Research and the Natural Sciences and Engineering Research Council of Canada. We thank Dr. R. Krahe for comments on this manuscript.
Correspondence should be addressed to Dr. Gerald Pollack, Department of Biology, McGill University, 1205 Doctor Penfield Avenue, Montreal, Quebec, Canada H3A1B1. E-mail: gerald.pollack@mcgill.ca.
Copyright © 2005 Society for Neuroscience 0270-6474/05/256137-08$15.00/0
References
- Balakrishnan R, Pollack GS (1996) Recognition of courtship song in the field cricket, Teleogryllus oceanicus Anim Behav 51: 353-366. [Google Scholar]
- Borst A, Theunissen FE (1999) Information theory and neural coding. Nat Neurosci 2: 947-957. [DOI] [PubMed] [Google Scholar]
- Brand A, Behrend O, Marquardt T, McAlpine D, Grothe B (2002) Precise inhibition is essential for microsecond interaural time difference coding. Nature 417: 543-547. [DOI] [PubMed] [Google Scholar]
- Cariani PA (2004) Temporal codes and computations for sensory representation and scene analysis. IEEE Trans Neural Netw 15: 1100-1111. [DOI] [PubMed] [Google Scholar]
- Carr CE (1993) Processing of temporal information in the brain. Annu Rev Neurosci 16: 223-243. [DOI] [PubMed] [Google Scholar]
- Clague H, Theunissen F, Miller JP (1997) Effects of adaptation on neural coding by primary sensory interneurons in the cricket cercal system. J Neurophysiol 77: 207-220. [DOI] [PubMed] [Google Scholar]
- Efron B, Tibshirani RJ (1993) An introduction to the bootstrap. New York: Chapman.
- Faulkes Z, Pollack GS (2000) Effects of inhibitory timing on contrast enhancement in auditory circuits in crickets (Teleogryllus oceanicus). J Neurophysiol 84: 1247-1255. [DOI] [PubMed] [Google Scholar]
- Filippi P (1999) Acoustics: basic physics, theory, and methods. San Diego: Academic.
- Fricker D, Miles R (2001) Interneurons, spike timing, and perception. Neuron 32: 771-774. [DOI] [PubMed] [Google Scholar]
- Grothe B (2003) New roles for synaptic inhibition in sound localization. Nat Rev Neurosci 4: 540-550. [DOI] [PubMed] [Google Scholar]
- Hedwig B, Poulet JFA (2004) Complex auditory behaviour emerges from simple reactive steering. Nature 430: 781-785. [DOI] [PubMed] [Google Scholar]
- Hennig RM, Weber T (1997) Filtering of temporal parameters of the calling song by cricket females of two closely related species—a behavioral analysis. J Comp Physiol [A] 180: 621-630. [Google Scholar]
- Irvine DRF, Park VN, McCormick L (2001) Mechanisms underlying the sensitivity of neurons in the lateral superior olive to interaural intensity differences. J Neurophysiol 86: 2647-2666. [DOI] [PubMed] [Google Scholar]
- Lestienne R (2001) Spike timing, synchronization and information processing on the sensory side of the central nervous system. Prog Neurobiol 65: 545-591. [DOI] [PubMed] [Google Scholar]
- Machens CK, Stemmler MB, Prinz P, Krahe R, Ronacher B, Herz AVM (2001) Representation of acoustic communication signals by insect auditory receptor neurons. J Neurosci 21: 3215-3227. [DOI] [PMC free article] [PubMed] [Google Scholar]
- Marsat G, Pollack GS (2004) Differential temporal coding of rhythmically diverse acoustic signals by a single interneuron. J Neurophysiol 92: 939-948. [DOI] [PubMed] [Google Scholar]
- Michelsen A, Löhe G (1995) Tuned directionality in cricket ears. Nature 375: 639. [Google Scholar]
- Miller LA, Surlykke A (2001) How some insects detect and avoid being eaten by bats: tactics and countertactics of prey and predator. Bioscience 51: 570-581. [Google Scholar]
- Moiseff A, Hoy RR (1983) Sensitivity to ultrasound in an identified auditory interneuron in the cricket: a possible neural link to phonotactic behavior. J Comp Physiol [A] 131: 113-120. [Google Scholar]
- Nagarajan SS, Cheung SW, Bedenbaugh P, Beitel RE, Schreiner CE, Merzenich MM (2002) Representation of spectral and temporal envelope of twitter vocalizations in common marmoset primary auditory cortex. J Neurophysiol 87: 1723-1737. [DOI] [PubMed] [Google Scholar]
- Nocke H (1972) Physiological aspects of sound communication in crickets (Gryllus campestris). J Comp Physiol [A] 80: 141-162. [Google Scholar]
- Nolen TG, Hoy RR (1984) Initiation of behavior by single neurons: the role of behavioral context. Science 226: 992-994. [DOI] [PubMed] [Google Scholar]
- Nolen TG, Hoy RR (1986) Phonotaxis in flying crickets. I. Attraction to the calling song and avoidance of bat-like ultrasound are discrete behaviors. J Comp Physiol [A] 159: 423-439. [DOI] [PubMed] [Google Scholar]
- Oertel D (1999) The role of timing in the brain stem auditory nuclei of vertebrates. Annu Rev Physiol 61: 497-519. [DOI] [PubMed] [Google Scholar]
- Oswald JP, Klug A, Park TJ (1999) Interaural intensity difference processing in auditory midbrain neurons: effects of a transient early inhibitory input. J Neurosci 19: 1149-1163. [DOI] [PMC free article] [PubMed] [Google Scholar]
- Park TJ (1998) IID sensitivity differs between two principal centers in the interaural intensity difference pathway—the LSO and the IC. J Neurophysiol 79: 2416-2431. [DOI] [PubMed] [Google Scholar]
- Park TJ, Grothe B, Pollak GD, Schuller G, Koch U (1996) Neural delays shape selectivity to interaural intensity differences in the lateral superior olive. J Neurosci 16: 6554-6566. [DOI] [PMC free article] [PubMed] [Google Scholar]
- Pollack GS (1986) Discrimination of calling song models by the cricket Teleogryllus oceanicus: the influence of sound direction on neural encoding of the stimulus temporal pattern and on phonotactic behavior. J Comp Physiol [A] 158: 549-562. [Google Scholar]
- Pollack GS (1998) Neural processing of acoustic signals. In: Comparative hearing: insects (Hoy RR, Popper AN, Fay RR, eds), pp 139-196. New York: Springer.
- Pollack GS, El-Feghaly E (1993) Calling song recognition in the cricket Teleogryllus oceanicus: comparison of the effects of stimulus intensity and sound spectrum on selectivity for temporal pattern. J Comp Physiol [A] 171: 759-765. [Google Scholar]
- Rheinlaender J, Mörchen A (1979) Time-intensity trading in locust auditory interneurons. Nature 281: 672-674. [Google Scholar]
- Rieke F, Bodnar DA, Bialek W (1995) Naturalistic stimuli increase the rate and efficiency of information transmission by primary auditory afferents. Proc R Soc Lond B Biol Sci 262: 259-265. [DOI] [PubMed] [Google Scholar]
- Rieke F, Warland D, de Ruyter van Steveninck R, Bialek W (1997) Spikes: exploring the neural code. Cambridge, MA: MIT.
- Roddey JC, Girish B, Miller JP (2000) Assessing the performance of neural encoding models in the presence of noise. J Comput Neurosci 8: 95-112. [DOI] [PubMed] [Google Scholar]
- Samson A-H, Pollack GS (2002) Encoding of sound localization cues by an identified auditory interneuron: effects of stimulus temporal pattern. J Neurophysiol 88: 2322-2328. [DOI] [PubMed] [Google Scholar]
- Schildberger K (1984) Temporal selectivity of identified auditory neurons in the cricket brain. J Comp Physiol [A] 155: 171-185. [Google Scholar]
- Schildberger K, Hörner M (1988) The function of auditory neurons in cricket phonotaxis. I. Effect of hyperpolarization of identified neurons on sound localization. J Comp Physiol [A] 163: 621-631. [Google Scholar]
- Stable J, Wendler G, Scharstein H (1989) Cricket phonotaxis: localization depends on recognition of the calling song pattern. J Comp Physiol [A] 165: 165-178. [Google Scholar]
- Strausfeld NJ, Seyan HS, Wholers D, Bacon JP (1983) Lucifer yellow histology. In: Functional neuroanatomy (Strausfeld NJ, ed), pp 132-155. Berlin: Springer.
- Theunissen F, Roddey JC, Stufflebeam S, Clague H, Miller JP (1996) Information theoretic analysis of dynamical encoding by four identified primary sensory interneurons in the cricket cercal system. J Neurophysiol 75: 1345-1364. [DOI] [PubMed] [Google Scholar]
- Theunissen FE, Sen K, Doupe AJ (2000) Spectral-temporal receptive fields of nonlinear auditory neurons obtained using natural sounds. J Neurosci 20: 2315-2331. [DOI] [PMC free article] [PubMed] [Google Scholar]
- von Helversen D, von Helversen O (1995) Acoustic pattern recognition and orientation in orthopteran insects: parallel or serial processing? J Comp Physiol [A] 177: 767-774. [Google Scholar]
- Wohlers DW, Huber F (1982) Processing of sound signals by six types of neurons in the prothoracic ganglion of the cricket Gryllus campestris J Comp Physiol [A] 146: 161-174. [Google Scholar]
- Zar JH (1999) Biostatistical analysis, Ed 4. Upper Saddle River, NJ: Prentice Hall.