Abstract
This study reports simulations of recent physiological results from the gerbil medial superior olive (MSO) that reveal that blocking glycinergic inhibition can shift the tuning for the interaural time difference (ITD) of the cell (Brand et al., 2002). Our simulations indicate that the model proposed in the study by Brand et al. (2002) requires precisely timed, short-duration inhibition with temporal accuracy exceeding that described in the auditory system. An alternative model is proposed that incorporates two anatomic observations in the MSO: (1) the axon arises from the dendrite that receives ipsilateral inputs; and (2) inhibitory synapses are located primarily on the soma in adult animals. When the inhibitory currents are activated or blocked, the model cell successfully simulates experimentally observed shifts in the best ITD. The asymmetrical cell structure allows an imbalance between the ipsilateral and contralateral excitatory inputs and shifts the ITD curve such that the best ITD is not at zero. Fine adjustment of the best ITD is achieved by the interplay of somatic sodium currents and synaptic inhibitory currents. The shift of the best ITD in the model is limited to ∼0.2 ms, which is behaviorally significant with respect to ITDs encountered in perceptual tasks. The model suggests a mechanism for dynamically “fine-tuning” the ITD sensitivity of MSO cells by the opponency between depolarizing sodium currents and hyperpolarizing inhibitory currents.
Keywords: interaural time differences, medial superior olive, inhibition, asymmetrical cell morphology, binaural hearing, neural modeling
Introduction
Interaural time difference (ITD) is the primary cue for localizing low-frequency sounds in the horizontal plane (Wightman and Kistler, 1992). Jeffress (1948) hypothesized that ITD information is carried by an array of coincidence detectors, each of which discharges maximally when the external ITD is equal to the internal delay difference of the cell.
Neural mechanisms of coincidence detection have been studied and confirmed in avian nucleus laminaris (NL) neurons (Joseph and Hyson, 1993; Reyes et al., 1996) and mammalian medial superior olive (MSO) neurons (Goldberg and Brown, 1969; Yin and Chan, 1990; Spitzer and Semple, 1995; Brand et al., 2002). However, anatomical evidence of the delay-line structure is less clearly demonstrated in the mammalian system (Smith et al., 1993; Beckius et al., 1999) than in the avian system (Young and Rubel, 1983; Carr and Konishi, 1990; Overholt et al., 1992).
McAlpine and Grothe (2003) hypothesized that inhibitory synaptic inputs can systematically shift the best ITD (i.e., the ITD at which an MSO cell discharges maximally) and thus that the best ITD can be manipulated independently of the physical delayline structure. Their hypothesis is based on the experimental observation in vivo that blocking glycinergic inhibition shifts the rate-ITD curve in MSO cells of gerbils (Brand et al., 2002). To interpret the experimental results, Brand et al. (2002) proposed a model that includes a precisely timed inhibition with a short duration (leading excitation by 0.2 ms; τ = 0.1 ms for the synaptic conductance). However, the observed time constant of the glycinergic inhibitory synapses in the MSO is much longer than 0.1 ms [e.g., 2 ms (Smith et al., 2000)]. Furthermore, no experimental studies have investigated the precision of the relative timing of excitatory and inhibitory inputs to the MSO in response to acoustic stimuli.
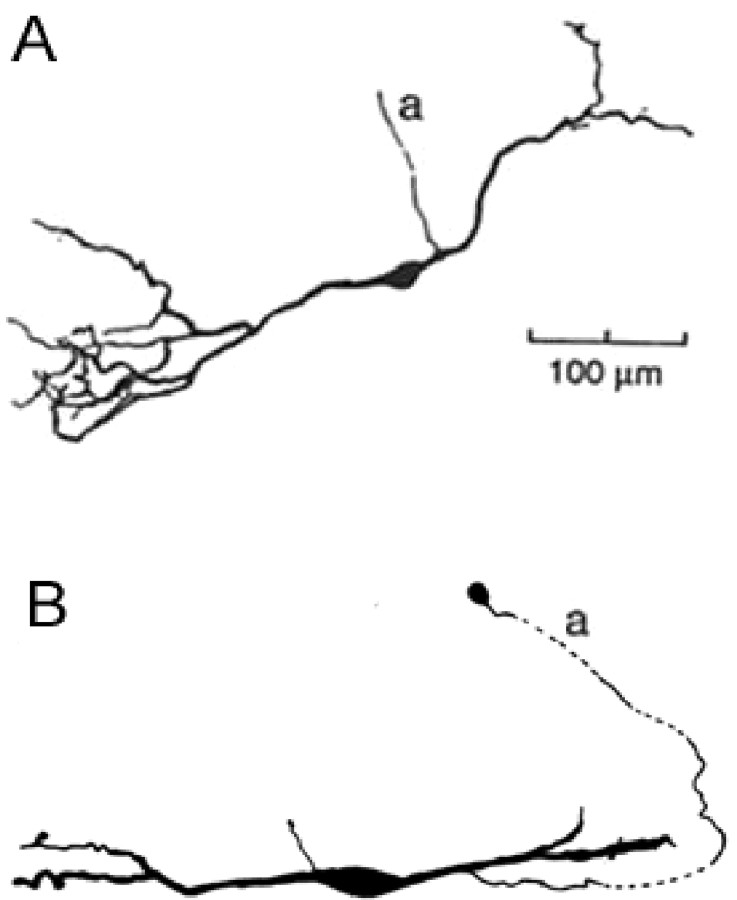
Here, we present an alternative explanation for the data of Brand et al. (2002). This model incorporates a morphological feature of MSO: the axons of some principal MSO neurons arise from the dendrites instead of the soma [cat (LaVilla, 1898; Kiss and Majorossy, 1983), gerbil (N. Golding, personal communication), guinea pig (Smith, 1995), mouse (Ramón y Cajal, 1909)] (see Fig. 1). Figure 1 illustrates this asymmetry in sample MSO cells from guinea pig and gerbil. Brew (1998) first suggested that the asymmetry may cause different delays between two interdendritic excitatory inputs en route to the axon; however, no studies have explored whether the asymmetry could affect the interaction between excitation and inhibition. We postulated that the observed shift of the ITD curves attributable to blocking inhibition might be associated with the effective asymmetry of excitatory and inhibitory inputs because of the relative locations of the axon and of the inhibitory synapses. To examine our hypothesis, we used a multicompartment model to study the interaction of excitation, inhibition, and ionic currents on this asymmetrical structure. This model simulated the shift of the ITD function by inhibition with a time constant comparable to available data. The model results suggest a potential mechanism for dynamic “finetuning” of ITD sensitivity at the single neuron level, which has implications for our understanding of auditory spatial attention.
Figure 1.
The asymmetrical cell structure with an axon (a) emerging from the ipsilaterally innervated dendrite. A, A cell from a guinea pig MSO [reproduced from Smith (1995) with permission]. B, A cell from a gerbil MSO (Golding, unpublished observation) (scale bar not shown). Both cells have an axon emerging from the ipsilaterally innervated dendrite.
Materials and Methods
Simulations presented here were generated by two types of neural models: a point-cell model that was insensitive to spatial distribution of synapses and a bipolar-cell model that incorporated asymmetric morphology (Fig. 1), dendritic glutaminergic excitation, somatic glycinergic inhibition, and somatic sodium channels. We simulated both models in the NEURON environment (Hines and Carnevale, 1997, 2000). The bipolar model is the focus of this study and is presented in detail in the following section. Both the point- and bipolar-cell models received input discharges from model afferent fibers. A simplified input model was used to generate these phase-locked discharge events according to the rate function of a nonstationary Poisson process that mathematically described the time-varying discharge properties of bushy cells in the anteroventral cochlear nucleus (AVCN) and of cells in the medial nucleus of the trapezoid body (MNTB).
Input model. The input model consisted of two periodic rate functions of Poisson-like processes: one described the characteristics of bilateral excitatory inputs from the AVCN to the MSO, and the other described the characteristics of contralateral inhibitory inputs from the MNTB to the MSO. Each run of the program involved multiple independent instances for one rate function. Each instance represented a discharge train for one excitatory or inhibitory input fiber, which innervated one excitatory or inhibitory synapse. The same input model was used for both cell models explored here.
A rate function had three main parameters: the period T of the input stimulus, the average input rate Rave, and the input vector strength rin. The parameters Rave and rin independently controlled the rate and the temporal aspects of input discharge trains. For tonal stimuli, the period T in milliseconds is the inverse of the tone frequency fin in Hertz (T = 1000/fin). Input discharges were phase-locked to the input frequency fin, and the tightness of the phase-locking was controlled by rin. The average input rate Rave was the average number of input discharges per second, which was less than or equal to fin.
Because we postulated that each input fiber had no more than one discharge per input period, it was more efficient to specify the location of a discharge in the period than to specify the occurrence of a discharge at each simulation time step. Generating periodic discharge trains involved two steps. (1) For each input period, an action potential was generated for each fiber with probability p, where p = min(Rave/fin,1). Usually, Rave was less than fin so that no discharge occurred in some cycles (p < 1). Thus, Rave controlled the probability p and the average input rate. (2) For any given input frequency fin, the next discharge time Ti was determined relative to the start time of the current period ti, where ti = i × T. The discharge time Ti was drawn from a Gaussian distribution, Ti ∼ N(T/2, T/(2 × F)), where T was the period of the input stimulus in milliseconds, and F was a constant that determined the strength of phase-locking. The associated vector strength r was given by r = exp(-π2/(2F2)), independent of input frequency fin. Additionally, if Ti > T or Ti < 0, the input model constrained Ti to be within the current period by replacing Ti with its circular residue T′i (i.e., T′i = TimodT if Ti > T, or T′i = Timod T + T if Ti < 0). This method prevented the occurrence of multiple discharges in a single period while maintaining the shape and area of the rate density function.
In both excitatory and inhibitory input trains, a 0.5 ms absolute refractory period was imposed after each input discharge and eliminated subsequent discharge times within the refractory period. As the input frequency increased, or the discharge distribution for periodic inputs approached a uniform function, the number of input discharges eliminated by refractory periods became significant; thus, Rave was the upper bound of the actual average input rate.
Finally, the input model assumed that excitatory and inhibitory input discharge trains had the same frequency fin under the assumption that the model cell was innervated by AVCN bushy cells and cells from MNTB, which have discharges that are phase-locked to the tone frequency fin.
Simulations of rate-ITD responses. The rate-ITD responses for the first part of the study were generated using the point-MSO model described by Brand et al. (2002) with fin = 500 Hz; simulations for the second part of the study were generated using the bipolar MSO model with fin ranging from 250 to 1000 Hz. The ITDs used to test these models were actually interstimulus time differences, defined as the time difference between the arrivals at the cell of two periodic excitatory input trains, one to each dendrite of the bipolar cell. The contralateral inhibition and contralateral excitation arrived at the same time statistically in the default setup. In some tests, the spike times of contralateral inhibitory inputs were artificially advanced or delayed to simulate the leading or lagging inhibition relative to the contralateral excitation. The discharge count in response to each ITD was measured at the center of the soma for the point model and at the center of the axon for the bipolar model, collected within the simulation time window of 100 ms for the point model and of 1000 ms for the bipolar model, and averaged over 10 trials. Only the average rates are presented in the results below.
All simulations in this study used the backward Euler integration method in NEURON with a fixed numerical time step of 25 μs. The accuracy of the integration was estimated with smaller time steps in some simulations, and the shapes of rate-ITD curves were not affected.
Point-MSO model. The point-MSO model was identical to the MSO model of Brand et al. (2002); it had a single-compartment structure with ionic channels based on those described for AVCN cells (Rothman et al., 1993; Brughera et al., 1996). In the model of Brand et al. (2002), bilateral excitatory inputs (2 × 24 fibers) and contralateral inhibitory inputs (24 fibers) are all derived from tonal responses of an auditory nerve model (Carney, 1993). For simplicity, we used an input rate function with a limited number of parameters to generate input discharge trains as described in the input model. The synaptic inputs to the point model were implemented exactly as for the bipolar model, as described below, except that they were not distributed spatially along a model structure.
Bipolar MSO model. The bipolar MSO model cell had a multicompartment structure that comprised one active soma, one active axon, and two passive dendrites, one of which was innervated ipsilaterally and the other contralaterally. The axon was connected with the dendrite ipsilaterally innervated (45 μm from the soma), based on the drawings of MSO cells and their axons in the study by Smith (1995). The geometrical specifications of the model are provided in Table 1.
Table 1.
Geometry and membrane properties of the bipolar cell model
|
Geometry and electrotonic properties |
| Soma {diameter, 20 μm; length, 40 μm; nseg = 1; λDC = 354 μm; Δ Xa = 0.11; Rsb = 19.9 MΩ} |
| Axon {diameter, 2 μm; length, 400 μm; nseg = 51; λDC = 112 μm; Δ Xa = 0.07; Rab = 71.3 MΩ} |
| Dendrite {diameter, 3 μm; length, 200 μm; nseg = 20; λDC = 137 μm; Δ Xa = 0.07; Rdb = 43.2 MΩ} Ri = 200 ohm · cm; Cm = 1 μF/cm2; τm = 0.5 ms; Rinputb = 10.5 MΩ |
| Ion channels |
| Soma {GNa = 0.1 S/cm2; GL = 0.002 S/cm2; ENa = 55 mV; ELc = −66.28 mV} |
| Axon {GNa = 0.3 S/cm2; GLTK = 0.03 S/cm2; GHTK = 0.02 S/cm2; Gh = 0.0015 S/cm2; GL = 0.002 S/cm2; ENa = 55 mV; Ek = −70 mV; Eh = −43 mV; ELc = −68.86 mV} |
| Dendrite {GL = 0.002 S/cm2; EL = −65 mV} |
The electrotonic length of each segment is calculated as  .
.
Rs, Ra, and Rd were the membrane resistance of each section; the input resistance at the soma was approximated by Rinput = 1/(2/Rd + 1/Rs), and Ra is not counted.
EL was adjusted to maintain Vrest = −65 mV; temperature, 38°C. The detection threshold for AP was −10 mV. nseg, Number of segments.
Synapses and ionic channels. Ten excitatory synapses were distributed evenly along the proximal half-section of each dendrite. Ten inhibitory synapses that received contralateral inputs were located on the soma (Clark, 1969; Kuwabara and Zook, 1992; Grothe and Sanes, 1993; Kapfer et al., 2002). Each input discharge triggered an excitatory or inhibitory synaptic conductance change. The synaptic conductance g{e,i}(t) was simulated as a linear combination of two exponentials with the peak conductance Ge or Gi at time tp such that
 |
where the normalization factor was g(tp) = exp(-tp/τ{e,i}) - exp(-tp/τrise), and the time of the peak was
 |
with τ{e,i} > τrise. In both the point and bipolar models, τe = 0.1 ms for all excitatory synapses. In the point model, τi varied from 0.1 to 1 ms; in the bipolar model, τi = 2 ms. When τ{e,i} = 0.1 ms, to avoid a zero denominator in tp, τrise = 0.0999 ms for excitatory or inhibitory synapses; otherwise τrise = 0.1 ms. The reversal potentials for excitatory and inhibitory synapses were Ee = 0 mV and Ei = -70 mV, respectively.
Specified ionic channels were inserted into the axon to generate action potentials: fast sodium INa, low-threshold potassium ILTK, highthreshold potassium IHTK, hyperpolarization-activated inward current Ih, and leakage channel IL. The kinetics of all channels in the bipolar model were based on the recent models of type II cells in the AVCN (Rothman and Manis, 2003). The soma had only sodium channels, which were turned on or off to study their influence on the ITD sensitivity during the simulation.
The peak conductances Ge and Gi of synapses, the average input rate Rave, and the input vector strength rin were the main parameters used to adjust the performance of the model cell, and their values are provided in the corresponding results below. Parameters that specify the peak conductance of ionic channels used for the bipolar model are listed in Table 1.
Linear cable properties. We measured cable properties of the model cell to ensure the numerical accuracy of the simulations and used them to estimate the amount of delay and attenuation of synaptic potentials traveling along a cable-like structure. We applied a linear cable theory (Rall and Rinzel, 1973) to define the following terms using model parameters in Table 1: (1) steadystate space constant
 |
(μm); (2) membrane time constant τm = Cm/(1000 × GL) (ms); (3) electrotonic length of a cylinder
 |
(4) input resistance at the origin of a semi-infinite cylinder
 |
(MΩ) and (5) input resistance at the origin of a finite cylinder with a sealed end Rin = R∞ coth(L) (MΩ). The calculations of R∞ and Rin were only applied to the dendrites and the axon. The time constant τm, the space constant λDC, and the input resistance Rin for each section of the model are provided in Table 1.
Additional simulations. We also used the point model to study the time scale of the effective inhibition observed in the lateral superior olive (LSO), which receives ipsilateral excitation from the AVCN and contralateral inhibition from the MNTB. Contralateral excitation is less frequently observed in the LSO (Cant and Casseday, 1986; Kuwabara and Zook, 1992; Wu and Kelly, 1994). We simulated responses in the experiment of Joris and Yin (1995), in which pulse trains with an interpulse interval of 10 ms were delivered to two ears, and the onset time of one stimulus was advanced or delayed to change the timing between excitation and inhibition in the LSO. In the simulation, we assumed that one acoustic pulse triggered one ipsilateral EPSP and one contralateral IPSP in the LSO. Because of the lack of knowledge of membrane properties of the MSO and the LSO, we used the same point-cell model but excluded contralateral excitatory inputs in this simulation. Each input fiber generated 100 input pulses with interpulse intervals of 10 ms, and the number of model cell discharges was measured.
For the bipolar model, the asymmetric cell structure imposed a traveltime difference between contralateral and ipsilateral inputs to the axon. We characterized this time difference in the model using two different approaches. First, we measured computationally the compound EPSP in response to unilateral synaptic inputs (fin = 500 Hz) at the origin of the axon. The purpose of this calculation was to compare the net delay and attenuation of the ipsilateral and contralateral synaptic potentials arriving at two dendrites. Because the synaptic potential could be suprathreshold for this test, action potentials were generated occasionally, which distorted the shape of the underlying synaptic potential. To compare the relative shape of synaptic potentials, we blocked the sodium, potassium, and inward current channels on the axon by setting their conductance to zero for this test. The compound EPSP was recorded over a 200 ms time window and folded into one input period (T = 2 ms) to estimate the average EPSP.
Second, we explored the delay difference between two dendritic inputs based on the theory of signal delay in a passive cable (Agmon-Snir and Segev, 1993; Zador et al., 1995; Rall and Agmon-Snir, 1998; Koch, 1999). We chose this theory because it provides a closed-form solution to the transfer delay of a signal (Agmon-Snir and Segev, 1993), which can be directly applied to the bipolar model.
The definitions and properties applied in our analysis are summarized briefly here. The reference time t̂ of a signal is defined as the centroid of the signal (in either current or voltage). The transfer delay is the difference between the reference time of a current signal injected at location y and the reference time of a voltage signal measured at location x:
 |
The propagation delay is the difference between the reference times of two voltage signals at locations y and x:
 |
Note that Py→x is dependent on Dy→x as well as the local delay at location yDy→y. Furthermore, it has been shown (Agmon-Snir and Segev, 1993; Zador et al., 1995) that the transfer delay is symmetric between opposite directions (i.e., Dy→x = Dx→y) and that the propagation delay is additive in the direction a signal travels (i.e., Py→k→x = Py→k + Pk→x).
In addition, Agmon-Snir and Segev (1993, their Eq. 15) showed that the transfer delay on a dendrite can be expressed analytically with the boundary condition of an equivalent “soma” at the origin, which lumps the rest of the structure together:
 |
1 |
In Equation 1, Dy→x is in units of τd, L is the electrotonic length of the dendrite, X and Y are the electrotonic distances of x and y (i.e., x and y normalized by λDC of the dendrite) for 0 ≤ X ≤ Y ≤ L;
 |
where ρ∞ and ϵ are the two factors that describe the relationship in membrane properties between the “equivalent” soma and the dendrite, specifically
 |
and R′s is the resistance of the equivalent soma at the origin.
Using Equation 1, we estimated the transfer delay difference (ΔTD) between two dendritic inputs under different membrane conditions, as characterized by ρ∞ and ϵ. The axon was placed on the ipsilaterally innervated dendrite at a distance x from the soma. Because there was only one input on each dendrite, ΔTD could be calculated straightforwardly with the aid of some assumptions. For simplicity, we assumed that the injection sites of synaptic currents to the two dendrites were at equal distances from the soma (y1 = y2 = y), that the two dendrites were identical electrotonically, that the soma at the origin was isopotential with zero propagation delay (P0→0 = 0), and that the axon with its high input resistance had negligible influence on signal propagation along the dendrites. Based on the definitions and properties of signal delays, we calculated the ΔTD between two excitatory inputs to the axon as follows.
If the distance of dendritic inputs to the soma was longer than that of the axon to the soma (y ≥ x):
 |
2 |
If the distance of dendritic inputs to the soma was shorter than that of the axon to the soma (y ≤ x):
 |
3 |
ΔTD was a function of the distance of the axon to the soma (x) in Equation 2 and a function of the distance of the injection site to the soma (y) in Equation 3. Transfer delays and local delays in Equations 2 and 3 were then calculated using Equation 1, with the boundary resistance of the equivalent soma described as
 |
Because Equations 2 and 3 are equivalent if x and y are interchanged, only the result of ΔTD as a function of the distance of the axon from the soma (Eq. 2) is shown in Results.
Results
Point-MSO model: temporal precision of inhibition is required
In this section, we extend the analysis of the model of Brand et al. (2002) using the same cell model and similar inputs. The results in the model of Brand et al. (2002) suggest that a precisely timed synaptic inhibition shifts the peak of the ITD function, a mechanism that demands a short-duration inhibition.
Figure 2 shows the extent of the shift of the ITD function with inhibition relative to that without inhibition for different τi values for the inhibitory synapses (Fig. 2A) and different lead times of inhibition with respect to excitation on the contralateral side (Fig. 2B). In this test, fin = 500 Hz, Rave = 150 Hz for bilateral excitation and contralateral inhibition, rin = 0.926 for excitation, and rin = 1.0 for inhibition. In Figure 2A, the peak of the ITD function indicates that inhibition with τi = 0.1 ms was most effective in moving the peak activity to ipsilateral delays. Inhibition of relatively long duration, such as that of τi = 1 ms, only suppressed the rate-ITD response, whereas the peak of the ITD curve did not shift. For the simulations, the value of Gi was adjusted for longer τi to preserve discharge rates. In addition, shortduration inhibition (τi = 0.1 ms) worked only if it arrived at times closely adjacent to and ahead of excitation. Figure 2B shows that the inhibition with lead times ≤0.2 ms most effectively shifted the best ITD to the contralateral-leading side. When inhibition lagged contralateral excitation, the best ITD shifted to the ipsilateral-leading side. As the timing between excitation and inhibition increased, the ITD sensitivity around zero ITD was less affected by inhibition, such that the peak ITD shifted back to the center. The maximum shift of the ITD function by the point model was ∼0.2 ms, which was constrained by the time scale of the excitation and inhibition (τe = τi = 0.1 ms) and by the timing of the inhibition.
Figure 2.
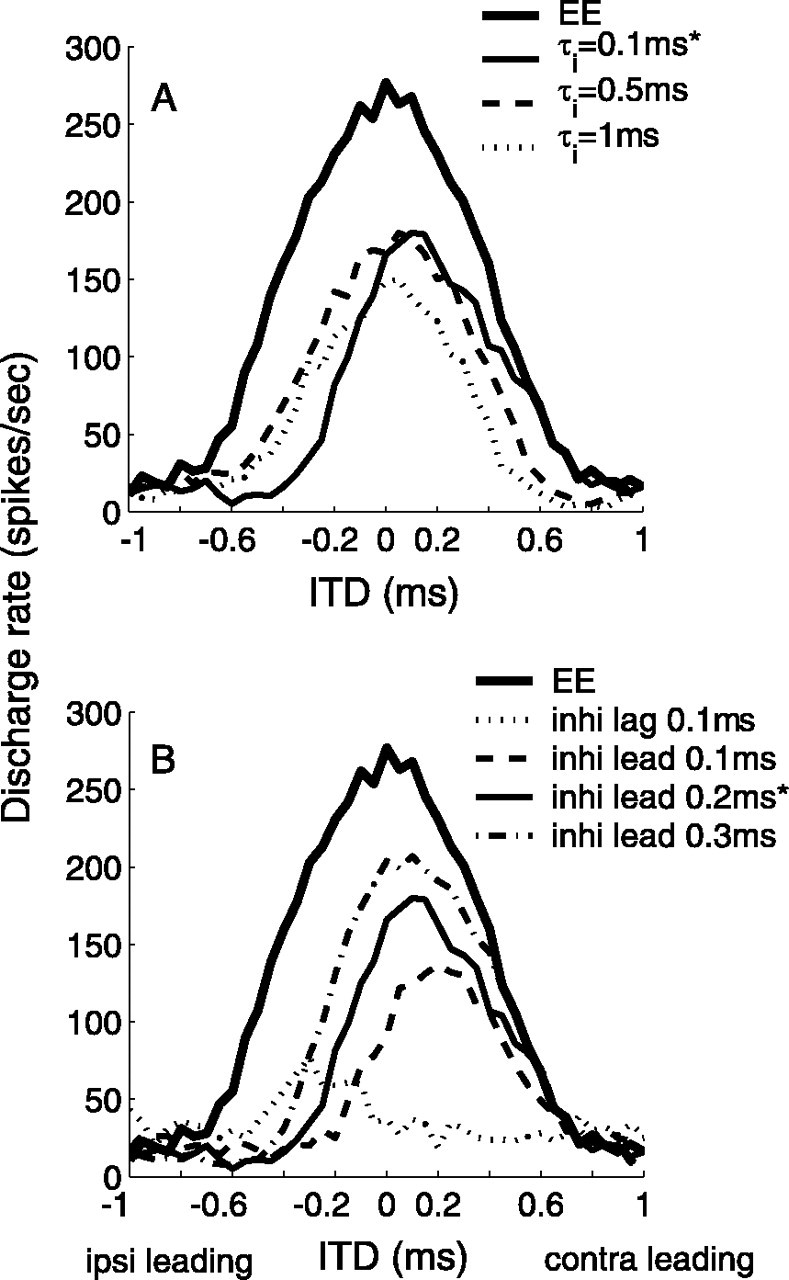
Effects of temporal precision of inhibition in the point model. A, Effects of the time constant τi of inhibition. The peak position of the ITD function is greatly influenced by the brief (τi = 0.1 ms), but not by the relatively long, inhibition. Parameter values are Ge = 2 nS for excitation and Gi = 10, 2, and 2 nS for inhibition with τi = 0.1, 0.5, and 1 ms, respectively. Inhibition leads excitation by 0.2 ms. B, Effects of relative timing of inhibition. The shift of the ITD function is more prominent when inhibition leads excitation by ∼0.1 ms. Parameter values are Ge = 2 nS, Gi = 10 nS, and τi = 0.1 ms. Parameters marked with asterisks are those used in the model of Brand et al. (2002). ipsi, Ipsilateral; contra, contralateral.
The best ITD (τbest) shifted from the time of coincident excitations (ITD = 0) to a different ITD (ITD =Δτbest), because the increase in the summation of excitation at an ITD of 0 over that at an ITD of Δτbest was reduced by the suppressive effect of inhibition. Inhibition shortly preceding contralateral excitation coincided with both excitations more at ITD = 0 than at ITD =Δτbest. To suppress the summation of excitation differentially between ITD = 0 and ITD = Δτbest, inhibition also had to be transient with respect to Δτbest. If inhibition was constant between ITD = 0 and ITD = Δτbest, the maximum response would remain at ITD = 0. Thus, inhibitions of longer duration were not able to shift τbest.
The model of Brand et al. (2002) uses fast inhibitory effects, τi = 0.1 ms, which is much shorter than that of IPSCs observed in MSO neurons of mammals (Smith et al., 2000). Inhibition with a time constant in the observed range in our test could not achieve the same result as their model.
It is possible that the IPSPs in the slice preparation have longer durations than in vivo. Indeed, indirect evidence of shortduration inhibitory effects lasting ∼1 ms in response to transient pulse stimuli in the LSO have been reported by Joris and Yin (1995), shorter than in in vitro experiments (Wu and Kelly, 1992). To examine the effective time scale of inhibition, we measured the discharge probability of the point model as a function of the arrival time difference between an EPSP and an IPSP. The strengths of excitatory and inhibitory synapses were adjusted such that excitatory inputs could fully evoke an action potential and the discharge was suppressed when inhibition coincided with excitation.
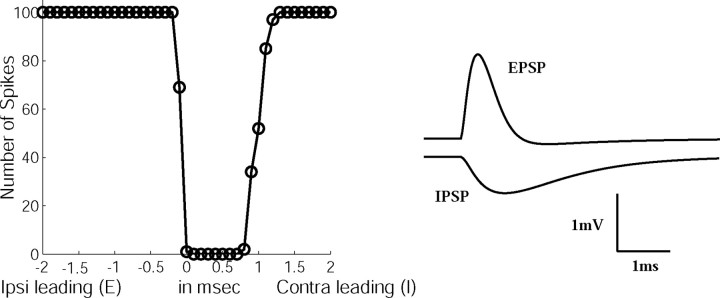
The LSO simulation showed that the time window of effective inhibition could be shorter than the duration of the IPSP. Figure 3 shows that the suppression of the response by inhibition lasted ∼1 ms, although it was generated by an inhibition with τi = 2 ms. In Figure 3 (right), shapes of the unitary IPSP and EPSP are plotted. It is clear that the model neuron was sensitive to a transient temporal onset disparity between excitation and inhibition that was shorter than the duration of the inhibition. The disparity in duration and the temporal waveform between EPSP and IPSP also resulted in different slopes of release from inhibition, similar to that in experimental observations (Wu and Kelly, 1992; Joris and Yin, 1995). Thus, LSO responses to pulse stimuli do not require the existence of inhibition with a duration as short as τi = 0.1 ms.
Figure 3.
Simulation of the pulse response in the LSO. Parameter values are Ge = 4 nS and Gi = 7 nS; rin = 1 for both excitation and inhibition, τe = 0.1 ms for excitation, and τi = 2 ms for inhibition. One hundred pulses were delivered by each input fiber with interpulse intervals of 10 ms. On the right, shapes of the unitary EPSP and IPSP are illustrated. ipsi, Ipsilateral; contra, contralateral.
The point model results (Fig. 2B) also indicate that a shortduration inhibition (τi = 0.1 ms) shifted τbest only when it led excitation by up to 0.2 ms. This result implies that temporal jitter in the arrival time of inhibition in this model would weaken its role in shifting the ITD function to an exact location. Increasing τi in the synaptic conductance function (Gi) delays the time of the peak and can increase the limit on the lead time of inhibition. However, inhibition with longer τi inevitably lost the power to shift the ITD function (Fig. 2A), especially at high frequencies. Because physiological experiments have not reported synaptic inhibition with temporal precision such as that required by the model of Brand et al. (2002), alternative explanations of the data are desirable.
Bipolar MSO model: interaction of inhibition and sodium channels
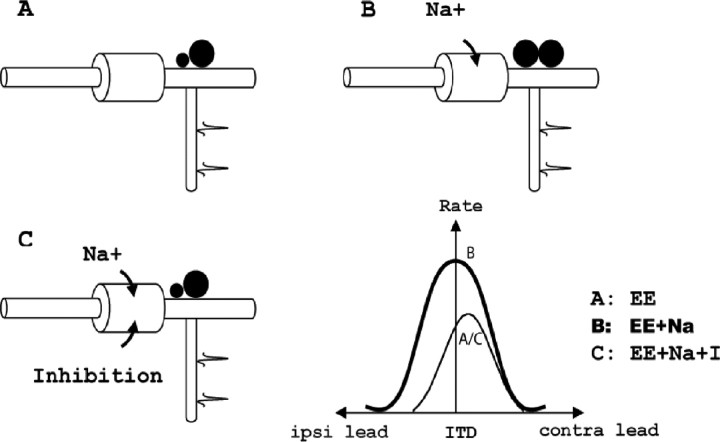
The conceptual scheme of the bipolar model is shown in Figure 4, which illustrates the asymmetrical placement of the axon and the hypothetical mechanism for the shift in the ITD function attributable to inhibition. Assuming that the action potential is initiated at the axon hillock, we made three hypotheses. First, if the soma were purely passive and received no inhibition, the contralateral excitation would be more attenuated than the ipsilateral excitation, because the contralateral input has a longer path to the axon hillock. This difference between the passive attenuations would cause the peak of the ITD curve to shift toward the contralateral-leading side, even if the excitatory inputs arrived with zero ITD at the dendrites of the MSO cell (Fig. 4A, EE). Our second hypothesis was based on the fact that blocking inhibition centers ITD tuning in the in vivo data (Brand et al., 2002). We hypothesized that a depolarizing mechanism on the soma that overcomes the shunting effect of the passive membrane may underlie the symmetric ITD curve that is observed after blocking inhibition. We proposed that active sodium currents provide this depolarizing mechanism (Fig. 4B, EE+Na). Third, we hypothesized that inhibitory inputs to the soma counteract the depolarizing force and move the peak of the ITD curve toward the contralateral-leading side (Fig. 4C, EE+Na+I). We chose the sodium (Na+) current as a candidate for the depolarizing force because its temporal profile is similar to and its polarity is opposite to that of the glycinergic inhibitory currents at the soma.
Figure 4.
Illustration of the mechanisms involved in the bipolar model. Three soma membrane conditions that were studied were a simple RC circuit (EE) (A), the RC circuit with active sodium channels (EE+Na) (B), and the RC circuit with active sodium channels and with inhibitory synapses (EE+Na+I) (C). Zero ITD corresponds to zero arrival delay between the two excitatory inputs. ipsi, Ipsilateral; contra, contralateral.
Membrane potentials
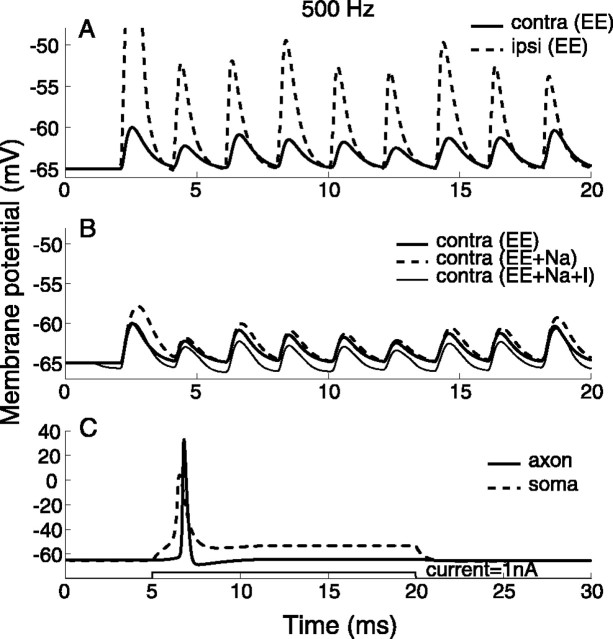
In this model, the electrical properties of the soma differed for the three conditions in which the model operated. Figure 5 shows sample traces of model responses to the same input patterns for different model configurations. The membrane potentials were measured at the origin of the axon in Figure 5, A and B. In Figure 5A, EPSPs of contralateral inputs have smaller amplitudes and delayed peak times than EPSPs of ipsilateral inputs, because of the asymmetric structure. The membrane of the soma was passive in this test. In Figure 5B, membrane potentials of identical contralateral inputs are compared for the three conditions to demonstrate the opponency between sodium currents and inhibitory currents (τi = 2 ms). The activation of sodium channels increased the depolarization of the membrane (EE+Na), whereas the inhibition hyperpolarized the membrane (EE+Na+I). Note that the amplification of EPSPs by sodium channels is voltage dependent; in contrast, the suppression of EPSPs by synaptic inhibition is less dependent on the membrane potential. These differences were less noticeable in simulations with bilateral inputs, which often resulted in suprathreshold EPSPs.
Figure 5.
Membrane potentials in response to 500 Hz inputs (A, B) and current injection (C). A, Contralateral (contra) EPSPs have smaller amplitudes and delayed peak times with respect to ipsilateral (ipsi) EPSPs in the passive membrane condition. B, The membrane is depolarized by active sodium currents and hyperpolarized by inhibitory currents at the soma in response to contralateral inputs at three membrane conditions. Parameter values for inputs are in Table 2. C, Somatic and axonal action potentials have different shapes and thresholds to current injection. A sustained current with an amplitude of 1.0 nA and a duration of 20 ms was injected into the soma. The peak conductance of sodium channels GNa were 0.1 S/cm2 on the soma and 0.3 S/cm2 on the axon.
The response of the model to a somatic current injection is shown in Figure 5C. The potentials were measured at the center of the soma and of the axon. Only one onset discharge was elicited by a sustained current attributable to subthreshold activity of the low-threshold potassium channels ILTK (Smith, 1995; Rothman and Manis, 2003). Blocking ILTK yielded multiple discharges (data not shown). On the soma, the deactivation of sodium channels prevented repetitive discharges to sustained currents, and accumulating charges on the membrane raised the potential. Because the axon had a higher density of sodium channels, the amplitude of an action potential was higher and the threshold of an action potential was lower at the axon than at the soma. Because the soma membrane did not contain any outward potassium currents, the width of an action potential was broader at the soma.
Rate-ITD functions
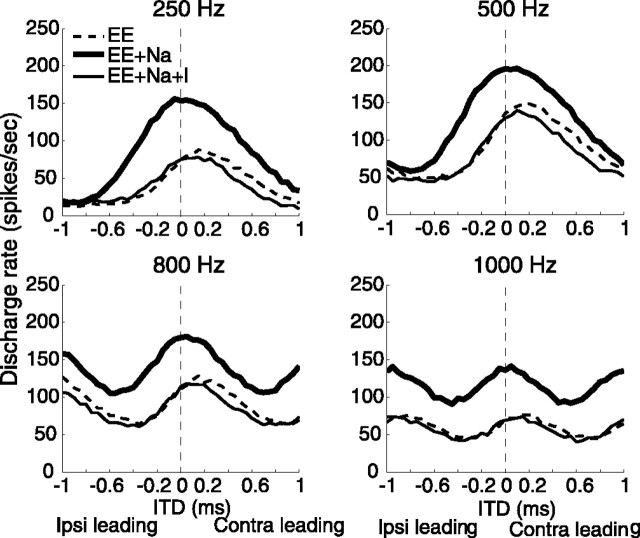
In Figure 6, the rate-ITD responses of the bipolar model in three conditions are shown for four frequencies. The peak conductance of each synapse Ge and Gi, the average input rate Rave, and the input vector strength rin for each frequency are listed in Table 2. These results demonstrate that the mechanism for shifting the ITD function with inhibition (EE+Na+I) relative to that without inhibition (EE+Na) is effective over a range of input frequencies.
Figure 6.
Rate-ITD responses at four frequencies. The three rate-ITD functions in each panel are results of the model with three configurations of the soma: passive (EE), with active sodium channels (EE+Na), and with both active sodium channels and inhibition (EE+Na+I). Parameters for excitation and inhibition at each frequency are listed in Table 2. ipsi, Ipsilateral; contra, contralateral.
Table 2.
Input parameters in simulations of the rate-ITD functions by the bipolar model
|
|
Excitation |
Inhibition (contralateral) |
||||||||
|---|---|---|---|---|---|---|---|---|---|---|
|
fin (Hz) |
Ge (nS) |
rin |
Rave (Hz) |
Gi |
rin |
Rave (Hz) |
||||
| 250 | 8 | 0.988 | 140 | 6 | 0.952 | 140 | ||||
| 500 | 11 | 0.988 | 240 | 6 | 0.952 | 240 | ||||
| 800 | 16 | 0.988 | 240 | 8 | 0.952 | 240 | ||||
| 1000 |
16 |
0.988 |
240 |
8 |
0.952 |
240 |
||||
The inhibitory synaptic conductance in these simulations had a time constant τi = 2 ms, which accumulated over cycles, and contained limited timing information for fin ≥ 500 Hz despite the highly phase-locked afferent inputs. In Figure 7A, the shift of the ITD function for 500 Hz is compared for inhibition with highly synchronized inputs and with randomly timed inputs. The lack of effect of synchronization shows that the mechanism used in the bipolar model does not require accurate arrival times for inhibition. In contrast, for the point model, inhibition with the same time constant (τi = 2 ms) did not shift the ITD function, nor did the shorter-duration inhibition (τi = 0.1 ms) when it did not arrive just before contralateral excitation. MSO cells receive ipsilateral inhibitory inputs from the lateral nucleus of the trapezoid body (LNTB) (Cant and Hyson, 1992; Kuwabara and Zook, 1992) as well as from the MNTB. It is not clear at present whether inputs from the LNTB exhibit temporal accuracy similar to those from the MNTB. Nevertheless, because the mechanism in the bipolar model for shifting the ITD curve does not depend on the detailed timing or duration of the inhibition, the effects of inhibitory inputs from the LNTB or from any other source could resemble those of inputs from the MNTB. In the model of Brand et al. (2002), LNTB inputs are omitted.
Figure 7.
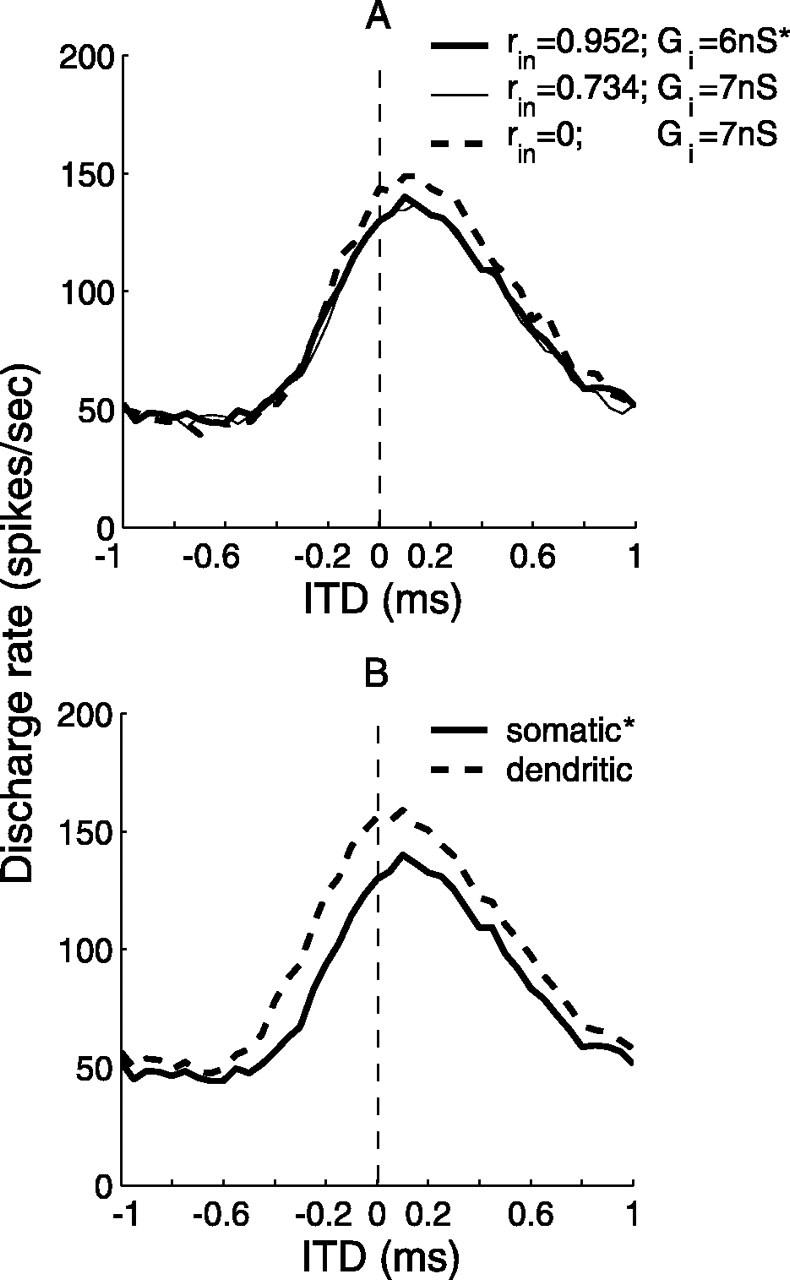
Temporal and spatial effects of inhibition in the bipolar model. A, Both synchronized and random inhibitory inputs shifted the ITD function. The asterisks mark parameter values used for 500 Hz inputs in Figure 6. The average input rate Rave was 240 Hz for inhibition in all three conditions. B, Somatic inhibition was more effective than dendritic inhibition in shifting the peak of the ITD function. Dendritic inhibition was distributed evenly along the proximal section of the contralaterally innervated dendrite. Input parameters are listed in Table 2 (for 500 Hz inputs).
We also tested the influence of the distribution of inhibitory synapses on the shift of the ITD function. Figure 7B compares the ITD functions of two model cells, one with somatic inhibition and the other with dendritic inhibition collocated with contralateral excitation. Results show that the magnitude of the shift was slightly larger for somatic inhibition than for dendritic inhibition of the same strength. Somatic inhibition “on the path” to contralateral excitation can interact with sodium currents more directly and reduce currents flowing from the contralateral dendrite to the axon more effectively (Koch, 1999). This result presents a possible functional explanation for the observation of Kapfer et al. (2002) that the locations of inhibitory synapses on MSO cells shift toward the soma during development.
Opponency between sodium channels and inhibition
In comparison to the point-neuron model with short-duration inhibition (Brand et al., 2002), the active components that shift the ITD function in the bipolar model include inhibition and ionic currents on the soma. The point model with short-duration inhibition controlled the lateral position of the best ITD, positive or negative, by leading or lagging inhibition on one side relative to excitation, and the magnitude of the shift was determined by the strength of inhibition. For the bipolar model, the direction and size of the shift of the best ITD was produced by completely different mechanisms from those in the point-neuron model. Figure 8 illustrates the “push-pull” influence on the ITD function of the sodium current and inhibition. Increasing the density of sodium channels gradually pushed ITD tuning toward zero ITD, as shown in Fig. 8A. In contrast, increased inhibition in the presence of sodium channels pulled the ITD tuning back to contralateral leads, as shown in Fig. 8B. Because the sodium current and inhibitory current were opponents, they did not modulate the ITD tuning independently. The activation of sodium channels alone moved the ITD function toward ipsilateral leads, but longduration inhibition balanced the sodium channel activity to shift the best ITD back toward contralateral leads. Moreover, the shift of the ITD function by inhibition was bounded by the offset of the best ITD in the EE condition, and increasing the sodium density did not push the best ITD to the ipsilateral-leading side. The shift of the ITD function in the bipolar model relies on the asymmetry of the cell structure, which creates the disparity in the temporal shapes of EPSPs by the passive membrane (Fig. 5A, EE). To displace the best ITD to the ipsilateral-leading side by the same mechanism would have required an axon located on the dendrite that receives contralateral inputs. Best ITDs favoring the ipsilateral-leading side are not frequently observed in the MSO (Yin and Chan, 1990; Spitzer and Semple, 1995), and asymmetrical axons are typically observed on the dendrite that receives ipsilateral inputs (Smith, 1995) (Golding, personal communication).
Figure 8.
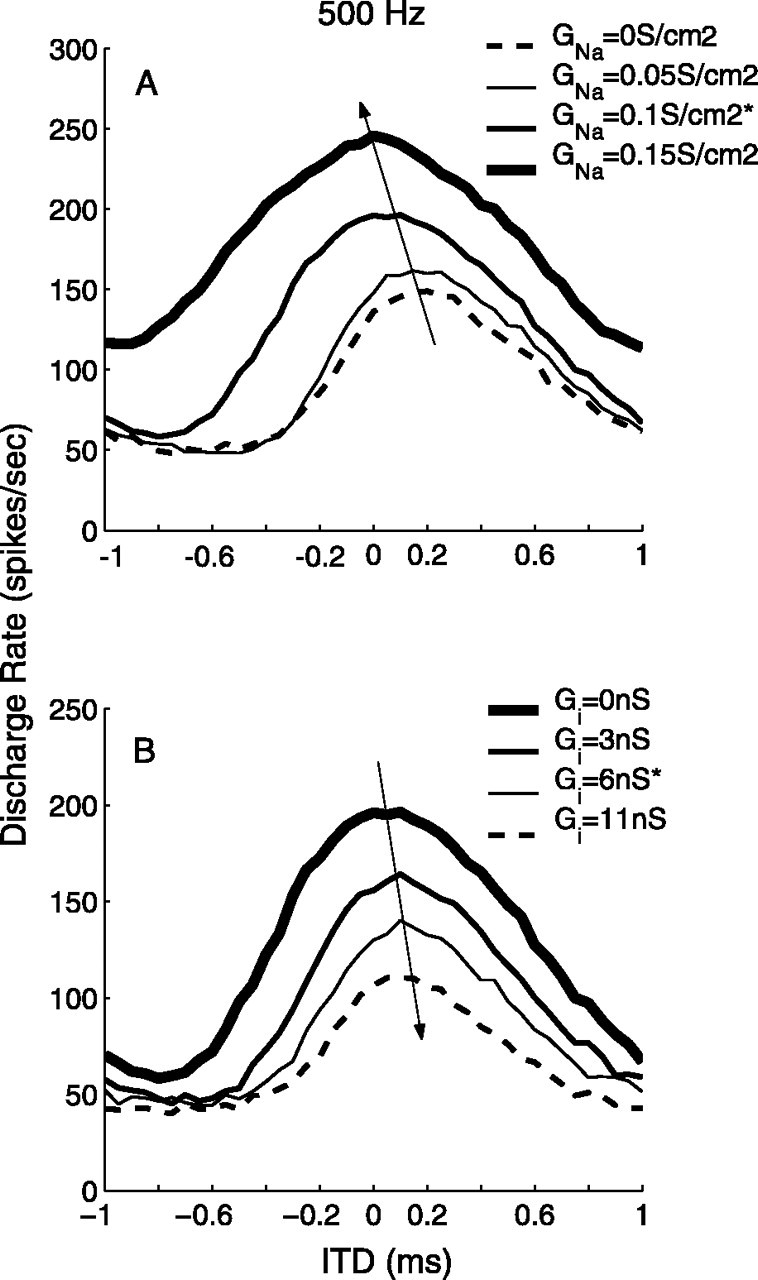
Opponent effects of sodium channels and inhibition on rate-ITD tuning. A, The increase of Na+ channel density (GNa) moved the ITD function toward ipsilateral leading in the EE+Na condition. B, The increase of the strength of inhibition moved the ITD function toward contralateral leading in the EE+Na+I condition; Gi on the soma was 0.1 S/cm2 for these curves. Other input parameter values are listed in Table 2 (for 500 Hz). The asterisks mark values of GNa and Gi used for 500 Hz inputs in Figure 6.
Bounds of the shifts
Because the best ITD in the EE condition [i.e., the model with only passive attenuation (Fig. 5A)] bounded the maximal shift of the best ITD by the inhibition in the bipolar model, the limitation in size of the ITD shift is a prominent question. The position of the axon was varied from the soma to the midpoint of the ipsilaterally innervated dendrite to answer this question, because, intuitively, a more distal axon might be expected to enlarge the ITD shift.
First, we measured computationally at the origin of the axon the average compound EPSPs generated by either contralateral or ipsilateral inputs, while the active ion channels were turned off on the axon. Results are shown in Figure 9. Moving the axon toward the distal end of the ipsilaterally innervated dendrite attenuated the contralateral EPSP and delayed its peak (Fig. 9A). On the other hand, the strength of the ipsilateral EPSP was nonmonotonically related to the location of the axon (Fig. 9B); the maximum EPSP occurred when the axon was placed within the distribution of synapses. (Excitatory synapses covered the proximal half-section of each dendrite.) Moreover, the peak time of the ipsilateral EPSP came earlier as its amplitude increased. The dependence of the ipsilateral EPSP size on the location of the axon and the distribution of the synapses indicated that moving the axon distally did not result in a larger shift of the peak ITD in the EE condition for the current model. As described by Smith (1995), the location of the axon in 14 of 15 principal MSO cells is reported to be within 45 μm of the cell body. We chose a value of 45 μm for the model simulations shown in Figures 5, 6, 7, 8 and 10, 11, 12. These results also show that the maximum difference in peak times between the two EPSPs was ∼0.2 ms, similar to the shift of the peak ITD in the passive membrane condition (EE), which resulted from the delay of the peak of the contralateral EPSP and the advance of the peak of the ipsilateral EPSP in Figure 9.
Figure 9.
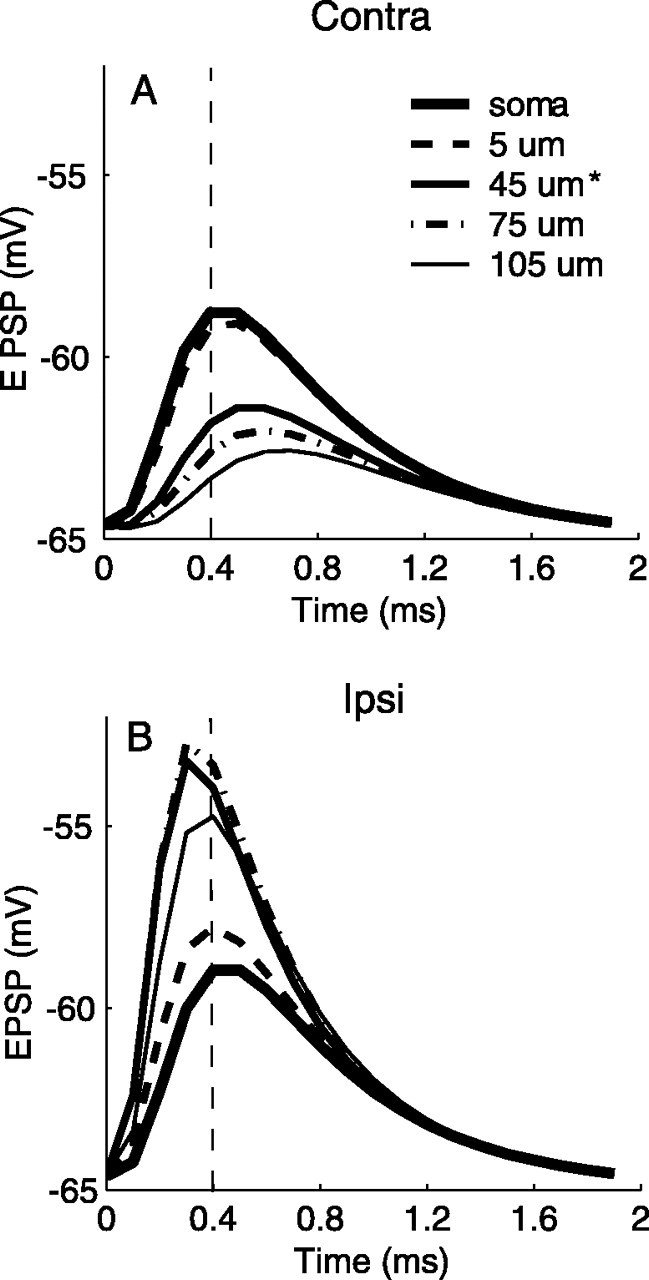
Effects of the location of the axon on the shape of the EPSP. Increasing the distance of the axon from the soma causes attenuation of the contralateral (Contra) EPSP (A) and amplification of the ipsilateral (Ipsi) EPSP (B), which is maximal for the 75 μm location. The vertical dashed lines indicate the peak position of the EPSP when the axon was at the center of the soma. Input parameter values are listed in Table 2 (for 500-Hz). The asterisks mark the location of the axon used in the simulations shown in Figures 5, 6, 7, 8 and 10, 11, 12.
Figure 10.
 |
as shown. The asterisk marks parameters used by the bipolar model with 500 Hz inputs.
Figure 11.
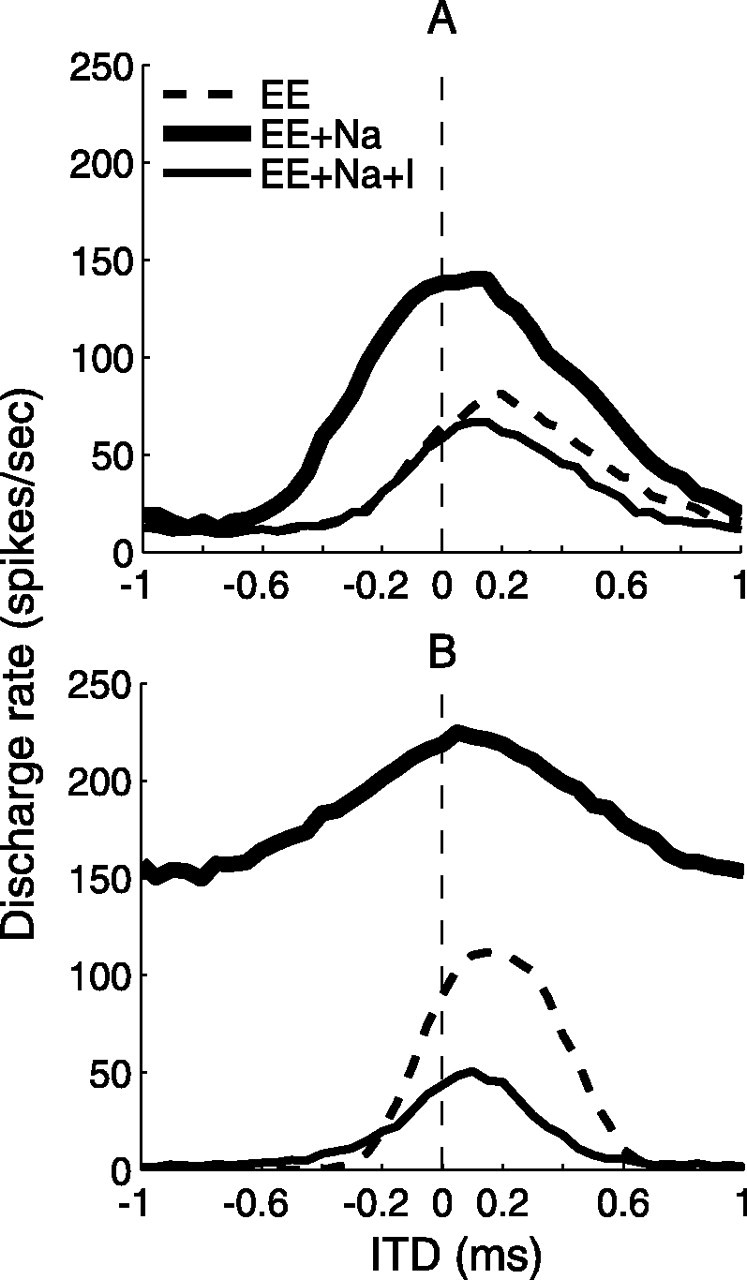
The effect of excitation level on the shift of the peak ITD. A, Overall response rates were reduced when the strength of excitation was decreased (Ge = 9 nS) compared with that in Figure 6 for 500 Hz inputs, but activations of sodium currents (GNa = 0.1 S/cm2) and inhibition (Gi = 6 nS) still shifted the peak ITD. B, The disparity in bilateral levels of excitation (Ge = 30 nS for the contralateral, Ge = 6 nS for the ipsilateral) did not affect the peak ITD in the EE condition. Here, Gi = 15 nS and GNa on the soma was 0.07 S/cm2. Other input parameter values are listed in Table 2 (for 500 Hz).
Figure 12.
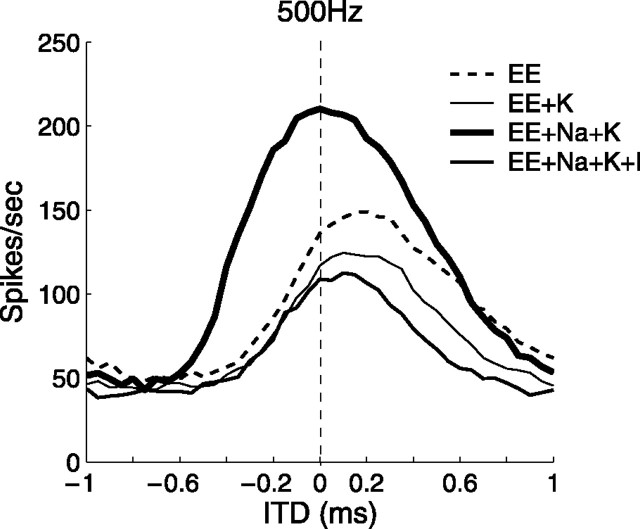
The effect of somatic potassium channels on the shift of the peak ITD. Activation of potassium currents reduced responses but did not affect the position of the peak ITD (EE+K). Increasing the strength of sodium currents moved the peak ITD to the ipsilateral-leading side (EE+Na+K); increasing inhibition (Gi = 11 nS) moved the peak ITD to the contralateral-leading side (EE+Na+K+I). Identical ionic channels were used for the soma and the axon membrane, with the exception of the density of sodium channels; GNa was 0.2 S/cm2 on the soma and 0.3 S/cm2 on the axon.
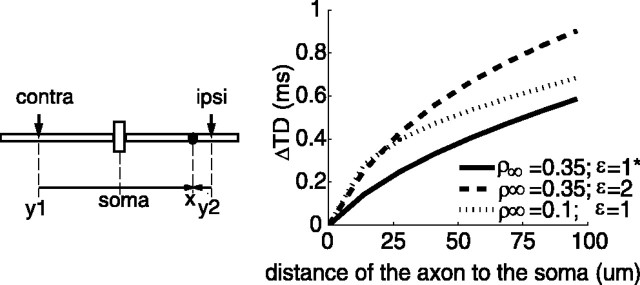
Second, we explored the effect of electrical properties of the membrane on the delay difference between contralateral and ipsilateral inputs. Only one excitatory input was placed on each dendrite to simplify the analysis. The transfer delay difference (ΔTD) analyzed at the location of the axon is described in Equations 2 and 3 (see Materials and Methods).
Figure 10 shows the result of ΔTD as a function of the distance from the axon to the soma (Eq. 2) under different membrane conditions, as characterized by
 |
The result shows that ΔTD increased as the axon was moved distally from the soma. Furthermore, the decrease of ρ∞ or the increase of ϵ for a given axon location generated a larger ΔTD.It is clear that ΔTD, directly related to the peak ITD, was affected jointly by the properties of the soma and dendrites. This analysis suggested means to increase the peak ITD shift in the passive membrane condition (EE) (e.g., reducing the soma size to decrease Rs or decreasing the dendrite diameter to increase R∞ produced a larger ΔTD). Varying the value of ϵ implied different cytoplasmic properties between the soma and dendrites. These parameter effects were studied in modeling exercises.
The increase of ΔTD with the distance of the axon to the soma in Figure 10 conflicted with the simulation results in Figure 9. The discrepancy resulted from the simplification in the delay analysis we applied: each dendrite had one distal input in the analysis (Eq. 2) instead of distributed ones as in the computational model. For inputs closer to the soma, ΔTD was actually determined by the location of the input (Eq. 3). For distributed inputs, the study of ΔTD between two compound potentials arriving at the axon would have to take into account not only transfer delays but also transfer impedances of individual inputs (Zador et al., 1995; Koch, 1999). The latter determines the contribution of a single input to the received signal. Therefore, the result in Figure 10 merely indicates the effect of membrane electrical properties on the relative size of ΔTD.
It is possible that the asymmetrical cell structure we explored was only one of several factors that could introduce a delay difference between ipsilateral and contralateral inputs. In the bipolar model, the two dendrites had identical electrical properties and spatial segregations of excitatory synapses. However, the length and branching patterns of dendrites vary considerably among cells in the MSO and NL (Smith and Rubel, 1979; Henkel and Brunso-Bechtold, 1990; Smith, 1995). A transfer delay difference could be generated simply by a disparity in the location of excitation on the two dendrites relative to the axon. It can be speculated that the bilateral difference in dendrite cytology, the spatial locations of excitatory synapses, and the ionic channel distributions might enable a virtual asymmetric system, regardless of the actual cell shape. The more complicated ITD computations that would result from such a system shall be explored as more detailed physiological measurements become available.
Effects of excitation level
In general, discharge rates of cells in the auditory nerve and in the AVCN increase monotonically with sound level (Kiang, 1965; Joris et al., 1994). It is reasonable to speculate that in the MSO the strength of synaptic excitation coming directly from the AVCN increases with level as well. Theoretically, the average strength of EPSPs grows proportionally to the product of the peak conductance of a synapse (Ge), the number of input fibers, and the average input rate of each fiber (Rave). For simplicity, we used Ge to explore changes in the excitatory drive as the sound level varied at each ear. We tested the robustness of the three-step mechanism proposed in this study to variations in excitation level (Fig. 11).
In Figure 11A, the strength of excitation (Ge = 9 nS) was 20% smaller than that in Figure 6 for 500 Hz inputs (Ge = 11 nS). The results show that the ITD functions in this case exhibited similar patterns of shifts by activations of sodium currents and inhibition. Compared with Figure 6 for 500 Hz inputs, the decrease of Ge reduced the overall discharge rates in Figure 11A, especially the trough rates, resulting in narrower response curves to ITDs. The values of Gi and Ge were the same as those in Figure 6 for 500 Hz inputs. When the strength of excitation was increased above Ge = 11 nS (data not shown), the overall rates increased, and the patterns of shifts in the ITD functions still remained.
Although the model had identical parameters for excitation on the two dendrites, the ipsilateral EPSPs were much larger than the contralateral ones because of the difference in their path lengths (Fig. 9). The strength of ipsilateral EPSPs as a result determined the discharge rate at each ITD. This observation raised the question of whether stronger contralateral EPSPs, which could result from interaural level differences, would diminish the shift of the peak ITD in the passive membrane condition and thereby nullify the role of inhibition and sodium currents. In Figure 11B, the strength of contralateral excitation was increased and the strength of ipsilateral excitation was decreased (Ge = 30 nS for contralateral; Ge = 6 nS for ipsilateral) such that the contralateral and ipsilateral compound EPSP measured at the axon had the same amplitude (data not shown). The shifts in the ITD curves of Figure 11B indicate that the mechanism proposed here is not affected by amplitude differences between bilateral excitations.
Moreover, the amount of the shift in Figure 11 (EE) was insensitive to the level of excitation. The analysis of the transfer delay difference in Figure 10 provided a possible explanation; the delay difference only depended on the structure and not the shape of the input signal (Agmon-Snir and Segev, 1993). In a passive membrane with closely distributed inputs, the peak time of a compound EPSP, which is a sublinear (Agmon-Snir et al., 1998) summation of EPSPs with various shapes, can potentially vary with sound level, although this was not observed in our simulations.
Because the position of the peak ITD under the influence of inhibition and sodium currents depended on their strengths (Fig. 8), the model could have level-dependent ITD curves in Figure 11 if arbitrary level-dependent inhibition and sodium current activities had been used. Hence, simulations here without the knowledge of these dependencies cannot exclude the possibility that changes in sound level will influence the ITD sensitivity of this model.
Somatic potassium channels
The somatic membrane of the bipolar model did not include outward potassium channels. Both low-threshold (ILTK) and high-threshold (IHTK) potassium channels, however, are present in the MSO and the NL (Smith, 1995; Grigg et al., 2000). To test the robustness of the model, we added potassium channels and a hyperpolarization-activated inward current (Ih) to the soma with identical parameters to those on the axon. The density of sodium channels on the soma was increased to offset these potassium currents. Figure 12 shows rate-ITD functions with potassium channels on the soma and with the three other membrane conditions presented above. The activation of potassium channels (EE+K) decreased the overall discharge rates, but the peak ITD remained the same as in the passive condition (EE). Furthermore, sodium currents still centered the peak ITD (EE+Na+K), and inhibition moved the peak back toward the contralateral-leading side (EE+Na+K+I). Potassium currents and synaptic inhibition, both of which hyperpolarized the membrane, exhibited similar functional roles in balancing sodium currents on the soma. We concluded that the direction of the peak ITD variation by active currents (EE+Na and EE+Na+I) depends mainly on the total volume and the dynamics of anionic and cationic flows across the somatic membrane. The exact complement of such currents requires additional theoretical and experimental exploration and confirmation.
Discussion
The present study focuses on whether coincidence detection in an MSO cell can be influenced by its asymmetric morphology. The role of cell morphology on ITD sensitivity was first computationally explored in the NL by Agmon-Snir et al. (1998). Most modeling studies have simplified MSO cells to point-neuron models, which ignore cell morphology. Point models necessitate strong and potentially unrealistic requirements on the timing and duration of inhibition to replicate (Fig. 2) the in vivo data of Brand et al. (2002). Our alternative model (Fig. 4) included the asymmetrical structure of the cell and the interactions of excitation and inhibition within this structure and simulated the in vivo data using realistic model parameters (Fig. 6). In this model, active sodium currents and synaptic inhibitory currents were opponent forces that shifted the ITD function in opposite directions (Fig. 8). These mechanisms would also allow dynamic descending and/or ascending control over ITD-sensitive cells in the MSO.
Time constant of synaptic inhibition
The point model relies on a short-duration inhibition (τi = 0.1 ms, similar to excitation) to produce the observed shift in the ITD curve (Brand et al., 2002). However, for postsynaptic currents, the observed value of τi is ∼2 ms and τe is ∼1 ms, as estimated from voltage-clamp measurements in the MSO (Smith et al., 2000) (adjusted to 37°C; Q10 = 2.1). For postsynaptic potentials, the observed duration of the IPSP is also on the order of milliseconds and is longer than that of the EPSP (Sanes, 1990; Smith, 1995).
Of course, in vivo neurons may have more precise synaptic responses through presynaptic and/or postsynaptic mechanisms than the slice preparation. However, the time window suggested for the effective inhibition (1 ms) in in vivo experiments (Joris and Yin, 1995) is not equal to the duration of the IPSP (Fig. 3). More direct evidence concerning the time course of the inhibitory currents from in vivo experiments in the adult MSO is needed.
Finally, even if short-duration inhibition in the MSO exists, the model of Brand et al. (2002) also requires precise timing between inhibitory projections from the MNTB and excitatory projections from AVCN bushy cells contralaterally onto each MSO cell (Fig. 2B). Experiments are required to determine this timing relationship between contralateral excitation and inhibition.
Asymmetrical cell structure
The potential for the asymmetrical axon of MSO cells to contribute passively to ITD tuning was first raised by Brew (1998). Our studies on the propagation of EPSPs indicate that the passive properties of the cell body and the location of the axon indeed affected delays and attenuations of the two excitatory inputs (Fig. 9). As a result, the best ITD attributable to the passive system was not zero ITD for the asymmetric cell (Fig. 6, EE). However, the passive model of the asymmetric cell can only explain the peak-ITD shift by the transfer delay difference between excitations and is thus not adequate to explain the observed responses of MSO cells after blocking inhibition. The opponency between sodium currents and inhibitory currents added active components to the passive system, such that the best ITD of the asymmetric model was not fixed (Fig. 8). The modulatory effects of the two active agents also relied on the asymmetric structure. Contralateral excitation was more sensitive to the somatic channel and inhibitory activities than was the ipsilateral excitation, which led to the directional variation of the best ITD.
The asymmetrical structure of the MSO cell assumed here has been observed in some but not all MSO cells (LaVilla, 1898; Ramón y Cajal, 1909; Kiss and Majorossy, 1983; Smith, 1995) (Golding, personal communication). MSO cells with elongated cell bodies and bipolar dendritic arrangement are categorized as the principal cells providing the neural basis for ITD sensitivity (Schwartz, 1977). In these cells, the axon location varies from cell to cell, arising from the ipsilaterally innervated dendrite or from different locations along the elongated soma (Ramón y Cajal, 1909; Smith, 1995) (Golding, personal communication). As mentioned above, asymmetric axon location is just one potential factor in the ITD tuning of cells; more subtle asymmetries include differences in dendritic length, shape, and cytology and differences in the distributions of synapses and ionic channels. Functional roles are as yet unknown for the nonprincipal cells in the MSO, which exhibit different morphologies and/or membrane properties than principal cells (Smith, 1995).
Dynamic tuning of an MSO cell
In the bipolar model presented here, the push-pull effect of the active sodium currents and synaptic inhibition suggests that an MSO cell may dynamically vary its ITD tuning through the regulation of channel and synaptic activities. The best ITD of a cell (τbest) thus combines the excitation-based (τbest,E), the inhibitionbased (τbest,I), and the channel-based (τchannel) best ITD.
The bipolar model features sodium channels, which can be varied in their effectiveness (τNa) by neural modulators (Cantrell and Catterall, 2001), and tonic inhibition. Thus, this model allows dynamic local, feedforward, or feedback control over basic ITD coding units, an unexplored and testable hypothesis. The shifts that are possible in the ITD curve, τbest,I between 0.1 and 0.2 ms, are behaviorally significant for mammals that use ITDs to localize low-frequency sounds. The model results also can simulate the information processing by a coincidence-detector network in response to time-varying signals in a complex environment. It is conceivable, but not yet tested empirically, that coincidence detectors with tunable best ITDs could dynamically vary the pattern of population activity and the neural representation of external cues.
Relationship to other models
Compartmental models have been used to study coincidence detection of NL cells in the avian brain (Agmon-Snir et al., 1998; Simon et al., 1999; Grau-Serrat et al., 2003). These models, which have symmetric cell structures, thoroughly explore the influences of spatial segregation of synapses and frequency-dependent dendritic length on the ITD sensitivity of cells. Because similar systematic variation of dendritic length has not been shown in the MSO, the ITD sensitivities in the bipolar model were adjusted by varying synaptic strength (Figs. 6, 11).
Batra et al. (1997) proposed a schematic model to interpret the measured dependence of the interaural phase (ϕbest) on the input frequency (fin) in the superior olivary complex (SOC). Their model uses contralateral inhibition to manipulate the sensitivity to coincidence between excitations, assumes that the probability of a neural discharge is proportional to the linear summation of input discharges, and does not contain postsynaptic neural factors. Their model can generate a complex pattern of ϕbest as observed in the SOC, but only for specific model manipulations of timing and strength relationships between excitation and inhibition. In our models, however, the effectiveness of the timing of inhibition appears to be related to the duration of inhibition. For example, in the point model, a restricted timing of the brief inhibition was required to manipulate the peak ITD (Fig. 2B); in the bipolar model, the shift of the peak ITD by the tonic inhibition was insensitive to the timing of inhibitory inputs (Fig. 7A).
Population best ITDs
In the mammalian brainstem, the best ITDs of low-characteristic frequency (CF) cells are more scattered and larger than those of high-CF cells (McAlpine et al., 2001; Brand et al., 2002; Joris et al., 2003; Hancock and Delgutte, 2004). Recently, McAlpine and Grothe (2003) argued that the best ITDs in their observations tend to have constant best phase (BP) across different CFs in the MSO; specifically, they postulate BP = τbest × CF = 1/8 cycle. They hypothesize that the constant BP distribution can be formed by regulation of inhibitory synaptic strength during development, a simpler solution than growth of specific axonal lengths bilaterally for afferent cells.
One difficulty with this hypothesis is that the size of the observed shift in the ITD curve attributable to inhibition (as much as 0.2 ms), compatible with the mechanisms proposed to date, does not achieve the large best ITDs that are observed at low CFs. For example, the mean and the SD of τbest for cells with CF = 100 Hz are 0.7 and 0.4 ms, respectively, as described by McAlpine et al. (2001); both are larger than the maximal shift of τbest by inhibition in the models discussed here. Hence, if there is a CF-dependent distribution of τbest, it must be essentially attributable to the contributions of excitation-based mechanisms, such as a delay-line structure or mismatching CFs of input fibers (Schroeder, 1977; Shamma et al., 1989; Joris et al., 2003), or attributable to mechanisms that have not yet been proposed.
In summary, this study provides an explanatory model for the shift of the best ITD in MSO neurons attributable to blocking of inhibition. This model combines multiple neural elements, each of which is testable. For instance, the pharmacological blockade and modulation of channel conductance can be tested for their effects on the excitability of neurons and their ITD sensitivity. Physiological studies of these elements in the MSO will inevitably enrich our understanding of the neural mechanisms for sensitivity to ITD and will provide tests of many assumptions that are made routinely in psychoacoustical studies of ITD sensitivity.
Footnotes
This work was supported by National Institutes of Health Grants DC00100 and DC01641. We thank Dr. Nace Golding for providing us with reconstructions of MSO cells from gerbil and Dr. Philip H. Smith for providing histological material from the MSO of guinea pig.
Correspondence should be addressed to Dr. H. Steven Colburn, Department of Biomedical Engineering, Center for Hearing Research, Boston University, Boston, MA 02215. E-mail: colburn@bu.edu.
Copyright © 2005 Society for Neuroscience 0270-6474/05/253046-12$15.00/0
References
- Agmon-Snir H, Segev I (1993) Signal delay and input synchronization in passive dendritic structures. J Neurophysiol 70 : 2066-2085. [DOI] [PubMed] [Google Scholar]
- Agmon-Snir H, Carr CE, Rinzel J (1998) The role of dendrites in auditory coincidence detection. Nature 393 : 268-272. [DOI] [PubMed] [Google Scholar]
- Beckius GE, Batra R, Oliver DL (1999) Axons from anteroventral cochlear nucleus that terminate in medial superior olive of cat: observations related to delay lines. J Neurosci 19 : 3146-3161. [DOI] [PMC free article] [PubMed] [Google Scholar]
- Brand A, Behrend O, Marquardt T, McAlpine D, Grothe B (2002) Precise inhibition is essential for microsecond interaural time difference coding. Nature 417:543 -547. [DOI] [PubMed] [Google Scholar]
- Brew H (1998) Modeling of interaural time difference detection by neurons of mammalian superior olivary nucleus. Assoc Res Otolaryngol 25:680 . [Google Scholar]
- Brughera AR, Stutman ER, Carney LH, Colburn HS (1996) A model with excitation and inhibition for cells in the medial superior oliver. Audit Neurosci 2:219 -233. [Google Scholar]
- Cant N, Hyson R (1992) Projections from the lateral nucleus of the trapezoid body to the medial superior olivary nucleus in the gerbil. Hear Res 58:26 -34. [DOI] [PubMed] [Google Scholar]
- Cant NB, Casseday JH (1986) Projections from the anteroventral cochlear nucleus to the lateral and medial superior olivary nuclei. J Comp Neurol 247:457 -476. [DOI] [PubMed] [Google Scholar]
- Cantrell A, Catterall W (2001) Neuromodulation of Na+ channels: an unexpected form of cellular plasticity. Nat Rev Neurosci 2:397 -407. [DOI] [PubMed] [Google Scholar]
- Carney LH (1993) A model for the responses of low-frequency auditorynerve fibers in cat. J Acoust Soc Am 93 : 401-417. [DOI] [PubMed] [Google Scholar]
- Carr CE, Konishi M (1990) A circuit for detection of interaural time differences in the brain stem of the barn owl. J Neurosci 10:3227 -3246. [DOI] [PMC free article] [PubMed] [Google Scholar]
- Clark GM (1969) The ultrastructure of nerve endings in the medial superior olive of the cat. Brain Res 14 : 293-305. [DOI] [PubMed] [Google Scholar]
- Goldberg J, Brown P (1969) Response of binaural neurons of dog superior olivary complex to dichotic tonal stimuli: some physiological mechanisms of sound localization. J Neurophysiol 32 : 613-636. [DOI] [PubMed] [Google Scholar]
- Grau-Serrat V, Carr CE, Simon JZ (2003) Modeling coincidence detection in nucleus laminaris. Biol Cybern 89 : 388-396. [DOI] [PMC free article] [PubMed] [Google Scholar]
- Grigg JJ, Brew HM, Tempel BL (2000) Differential expression of voltagegated potassium channel genes in auditory nuclei of the mouse brainstem. Hear Res 140:77 -90. [DOI] [PubMed] [Google Scholar]
- Grothe B, Sanes D (1993) Bilateral inhibition by glycinergic afferents in the medial superior olive. J Neurophysiol 69:1192 -1196. [DOI] [PubMed] [Google Scholar]
- Hancock KE, Delgutte B (2004) A physiologically based model of interaural time difference discrimination. J Neurosci 24 : 7110-7117. [DOI] [PMC free article] [PubMed] [Google Scholar]
- Henkel CK, Brunso-Bechtold JK (1990) Dendritic morphology and development in the ferret medial superior olivary nucleus.J Comp Neurol 294:377 -388. [DOI] [PubMed] [Google Scholar]
- Hines ML, Carnevale NT (1997) The NEURON simulation environment. Neural Comput 9:1179 -1209. [DOI] [PubMed] [Google Scholar]
- Hines ML, Carnevale NT (2000) Expanding NEURON′s repertoire of mechanisms with NMODL. Neural Comput 12 : 995-1007. [DOI] [PubMed] [Google Scholar]
- Jeffress L (1948) A place theory of sound localization. J Comp Physiol Psychol 41:35 -39. [DOI] [PubMed] [Google Scholar]
- Joris PX, Yin T (1995) Envelope coding in the lateral superior olive. I. Sensitivity to interaural time differences. J Neurophysiol 73:1043 -1062. [DOI] [PubMed] [Google Scholar]
- Joris PX, Carney LH, Smith PH, Yin TC (1994) Enhancement of neural synchronization in the anteroventral cochlear nucleus. I. Responses to tones at the characteristic frequency. J Neurophysiol 71:1022 -1036. [DOI] [PubMed] [Google Scholar]
- Joris PX, van der Heijden M, Louage D, van de Sande B, van Kerckhoven C (2003) Dependence of binaural and cochlear “best delays” on characteristic frequency. In: Auditory signal processing: physiology, psychoacoustics, and models (Pressnitzer D, de Cheveingné A, McAdams S, Collet L, eds), pp396 -402. New York: Springer.
- Joseph AW, Hyson RL (1993) Coincidence detection by binaural neurons in the chick brain stem. J Neurophysiol 69 : 1197-1211. [DOI] [PubMed] [Google Scholar]
- Kapfer C, Seidl A, Schweizer H, Grothe B (2002) Experience-dependent refinement of inhibitory inputs to auditory coincidence-detector neurons. Nat Neurosci 5 : 247-253. [DOI] [PubMed] [Google Scholar]
- Kiang NY (1965) Discharge patterns of single fibers in the cat's auditory nerve. Cambridge, MA: MIT.
- Kiss A, Majorossy K (1983) Neuron morphology and synaptic architecture in the medial superior olivary nucleus. Light and electron microscope studies in the cat. Exp Brain Res 52 : 315-327. [DOI] [PubMed] [Google Scholar]
- Koch C (1999) Biophysics of computation: information processing in single neurons. New York: Oxford UP.
- Kuwabara N, Zook JM (1992) Projections to the medial superior olive from the medial and lateral nuclei of the trapezoid body in rodents and bats. J Comp Neurol 324:522 -538. [DOI] [PubMed] [Google Scholar]
- LaVilla I (1898) Algunos detalles concernietes a la oliva superior y focos acusticos. Rev Trimest Micrograf 3 : 75-83. [Google Scholar]
- McAlpine D, Grothe B (2003) Sound localization and delay lines—do mammals fit the model? Trends Neurosci 26 : 347-350. [DOI] [PubMed] [Google Scholar]
- McAlpine D, Jiang D, Palmer A (2001) A neural code for low-frequency sound localization in mammals. Nat Neurosci 4 : 396-401. [DOI] [PubMed] [Google Scholar]
- Overholt EM, Rubel EW, Hyson RL (1992) A circuit for coding interaural time differences in the chick brainstem. J Neurosci 12:1698 -1708. [DOI] [PMC free article] [PubMed] [Google Scholar]
- Rall W, Agmon-Snir H (1998) Cable theory for dendritic neurons. In: Methods in neuronal modeling: from ions to networks (Koch C, Segev I, eds), pp 27-92. Cambridge, MA: MIT.
- Rall W, Rinzel J (1973) Branch input resistance and steady attenuation for input to one branch of a dendritic neuron model.Biophys J 13:648 -687. [DOI] [PMC free article] [PubMed] [Google Scholar]
- Ramón y Cajal S (1909) Histologie du système nerveux de l'homme et des vertébrés. Translated by L. Azoulay. Paris: Maloine.
- Reyes AD, Rubel EW, Spain WJ (1996) In vitro analysis of optimal stimuli for phase-locking and time-delayed modulation of firing in avian nucleus laminaris neurons. J Neurosci 16 : 993-1007. [DOI] [PMC free article] [PubMed] [Google Scholar]
- Rothman J, Manis P (2003) The roles potassium currents play in regulating the electrical activity of ventral cochlear nucleus neurons. J Neurophysiol 89:3097 -3113. [DOI] [PubMed] [Google Scholar]
- Rothman J, Young E, Manis P (1993) Convergence of auditory nerve fibers onto bushy cells in the ventral cochlear nucleus: implications of a computational model. J Neurophysiol 70 : 2562-2583. [DOI] [PubMed] [Google Scholar]
- Sanes D (1990) An in vitro analysis of sound localization mechanisms in the gerbil lateral superior olive. J Neurosci 10:3494 -3506. [DOI] [PMC free article] [PubMed] [Google Scholar]
- Schroeder MR (1977) New viewpoints in binaural interaction. In: Psychophysics and physiology of hearing (Evans EF, Wilson JP, eds), pp 455-467. New York: Academic.
- Schwartz IR (1977) Dendritic arrangements in the cat medial superior olive. Neuroscience 2:81 -101. [DOI] [PubMed] [Google Scholar]
- Shamma SA, Shen NM, Gopalaswamy P (1989) Stereausis: binaural processing without neural delays. J Acoust Soc Am 86 : 989-1006. [DOI] [PubMed] [Google Scholar]
- Simon JZ, Carr CE, Shamma SA (1999) A dendritic model of coincidence detection in the avian brainstem. Neurocomputing 26-27 : 263-269. [Google Scholar]
- Smith A, Owens S, Forsythe I (2000) Characterisation of inhibitory and excitatory postsynaptic currents of the rat medial superior olive. J Physiol 529:681 -698. [DOI] [PMC free article] [PubMed] [Google Scholar]
- Smith DJ, Rubel EW (1979) Organization and development of brain stem auditory nuclei of the chicken: dendritic gradients in nucleus laminaris. J Comp Neurol 186:213 -239. [DOI] [PubMed] [Google Scholar]
- Smith PH (1995) Structural and functional differences distinguish principal from nonprincipal cells in the guinea pig MSO slice.J Neurophysiol 73:1653 -1667. [DOI] [PubMed] [Google Scholar]
- Smith PH, Joris PX, Yin TC (1993) Projections of physiologically characterized spherical bushy cell axons from the cochlear nucleus of the cat: evidence for delay lines to the medial superior olive.J Comp Neurol 331:245 -260. [DOI] [PubMed] [Google Scholar]
- Spitzer MW, Semple MN (1995) Neurons sensitive to interaural phase disparity in gerbil superior olive: diverse monaural and temporal response properties. J Neurophysiol 73 : 1668-1690. [DOI] [PubMed] [Google Scholar]
- Wightman FL, Kistler DJ (1992) The dominant role of low-frequency interaural time differences in sound localization. J Acoust Soc Am 91:1648 -1661. [DOI] [PubMed] [Google Scholar]
- Wu S, Kelly J (1992) Binaural interaction in the lateral superior olive: time difference sensitivity studied in mouse brain slice. J Neurophysiol 68:1151 -1159. [DOI] [PubMed] [Google Scholar]
- Wu SH, Kelly JB (1994) Physiological evidence for ipsilateral inhibition in the lateral superior olive: synaptic responses in mouse brain slice. Hear Res 73:57 -64. [DOI] [PubMed] [Google Scholar]
- Yin T, Chan J (1990) Interaural time sensitivity in medial superior olive of cat. J Neurophysiol 64 : 465-488. [DOI] [PubMed] [Google Scholar]
- Young SR, Rubel EW (1983) Frequency-specific projections of individual neurons in chick brainstem auditory nuclei. J Neurosci 3:1373 -1378. [DOI] [PMC free article] [PubMed] [Google Scholar]
- Zador AM, Agmon-Snir H, Segev I (1995) The morphoelectrotonic transform: a graphical approach to dendritic function.J Neurosci 15:1669 -1682. [DOI] [PMC free article] [PubMed] [Google Scholar]


