

Abstract
Dense-core granules (DCGs) are organelles found in specialized secretory cells, including neuroendocrine cells and neurons. Neuronal DCGs facilitate many critical processes, including the transport and secretion of proteins involved in learning, and yet their transport and exocytosis are poorly understood. We have used wide-field and total internal reflection fluorescence microscopy, in conjunction with transport theory, to visualize the transport and exocytosis of DCGs containing a tissue plasminogen activator-green fluorescent protein hybrid in cell bodies, neurites, and growth cones of developing hippocampal neurons and to quantify the roles that diffusion, directed motion, and immobility play in these processes. Our results demonstrate that shorter-ranged transport of DCGs near sites of exocytosis in hippocampal neurons and neuroendocrine cells differs markedly. Specifically, the immobile fraction of DCGs within growth cones and near the plasma membrane of hippocampal neurons is small and relatively unaltered by actin disruption, unlike in neuroendocrine cells. Moreover, transport of DCGs in these domains of hippocampal neurons is unusually heterogeneous, being significantly rapid and directed as well as slow and diffusive. Our results also demonstrate that exocytosis is preceded by substantial movement and heterogeneous transport; this movement may facilitate delivery of DCG cargo in hippocampal neurons, given the relatively low abundance of neuronal DCGs. In addition, the extensive mobility of DCGs in hippocampal neurons argues strongly against the hypothesis that cortical actin is a major barrier to membrane-proximal DCGs in these cells. Instead, our results suggest that extended release of DCG cargo from hippocampal neurons arises from heterogeneity in DCG mobility.
Keywords: regulated secretion, actin cortex, GFP, neuroendocrine, diffusion, imaging
Introduction
Dense-core granules (DCGs) are organelles found in cells specialized for secretion, such as neurons and neuroendocrine cells (Burgoyne and Morgan, 2003). These organelles support stimulus-dependent release of proteins involved in many critical biological processes, including neuronal survival and learning (Chen and Strickland, 1997; Baranes et al., 1998; Haubensak et al., 1998; Hartmann et al., 2001). DCGs bud as immature precursors from the trans-Golgi network, mature into DCGs, and then may undergo exocytosis in response to a stimulus after transport to the cell surface (Burgoyne and Morgan, 2003). Although much has been learned about DCG biogenesis, transport, and exocytosis, many of the underlying molecular events have yet to be elucidated.
DCG transport near the cell surface is a pivotal precursor of exocytosis and thus is the focus of considerable interest. To date, such transport has been studied primarily in neuroendocrine cells. In these cell types, many DCGs are immobile, and “short-ranged” transport of mobile DCGs near the plasma membrane and within growth cones is predominantly random and hindered severely (Burke et al., 1997; Oheim et al., 1998, 1999; Abney et al., 1999; Han et al., 1999b; Steyer and Almers, 1999; Johns et al., 2001; Desnos et al., 2003). It is not known whether these are general attributes of DCG transport in other cell types, particularly neurons (Beaumont, 2003).
Recently, the hindered, short-ranged mobility of DCGs in neuroendocrine cells was linked to important hypotheses about DCG exocytosis, stimulating interest in better elucidating transport mechanisms for DCGs. For example, one hypothesis is that cortical actin severely hinders membrane-proximal DCGs and thus must be partially and transiently cleared after stimulation to facilitate DCG exocytosis (Trifaro and Vitale, 1993; Steyer and Almers, 1999; Trifaro et al., 2000; Desnos et al., 2003). However, the validity of this hypothesis, like the generality of the neuroendocrine transport results, remains to be determined.
In contrast to neuroendocrine cells, the transport and exocytosis of DCGs in neurons are poorly understood (Bean et al., 1994; Beaumont, 2003; Burgoyne and Morgan, 2003). Thus, here we studied DCGs in developing hippocampal neurons and addressed the following questions: (1) How are DCGs transported over short distances near sites of exocytosis? (2) Is cortical actin a severe hindrance to DCG transport and exocytosis? and (3) What is the relationship between short-ranged transport and exocytosis? To address these questions, we expressed tissue plasminogen activator fused to enhanced green fluorescent protein (tPA-EGFP) in hippocampal neurons (Lochner et al., 1998), and we studied the transport and exocytosis of DCGs containing tPA-EGFP using wide-field fluorescence microscopy and total internal reflection fluorescence microscopy (TIRFM). We found that tPA-EGFP undergoes slow, limited release from growth cones of hippocampal neurons, similar to neuroendocrine cells. In contrast, we found that shorter-ranged transport of DCGs near sites of exocytosis differs markedly in hippocampal neurons and neuroendocrine cells. Specifically, unlike in neuroendocrine cells (Ng et al., 2002), the immobile fraction of DCGs within growth cones and near the plasma membrane of hippocampal neurons is small and is not significantly altered by actin disruption. Moreover, transport of mobile DCGs in these domains is unusually heterogeneous, being significantly rapid and directed as well as slow and diffusive. We also found that fusion is preceded by substantial movement and heterogeneous transport; this movement may facilitate delivery of DCG cargo in hippocampal neurons, given the relatively low abundance of neuronal DCGs. These results demonstrate that cortical actin is not a major barrier to DCG transport and exocytosis in hippocampal neurons. Rather, the results suggest that extended release of DCG cargo in hippocampal neurons arises from heterogeneity in mobility.
Materials and Methods
Cell culture
Hippocampal neurons from 18-d-old embryonic rats were cultured on 18-mm-diameter round glass #1 coverslips, as described previously (Goslin and Banker, 1998).
Transfection
Expression vectors for tPA-EGFP and proneuropeptide Y-EGFP (pNPY-EGFP), and their cyan (ECFP) and yellow (EYFP) variants, were constructed using standard subcloning techniques; expression vectors for prepro-orphanin Q (OFQ) hybrids were a generous gift from Dr. Richard Allen (Oregon Health Sciences University, Portland, OR). Vectors were introduced into hippocampal neurons using two techniques. In some cases, the relevant genes were packaged into a replication-deficient herpes simplex virus, and the virus was used to deliver the DNA into neurons (Ho, 1994). In other cases, lipid-based (N-[1-(2,3-dioleoyloxyl)propyl]-N, N, N-trimethylammoniummethyl sulfate or Lipofectamine 2000) transfection techniques were used (Kaech et al., 1996; Ohki et al., 2001).
Staining
Immunostaining and dye staining were used in various colocalization experiments. To compare the distributions of the endogenous DCG protein secretogranin II (SgII) (Rosa et al., 1985; Schwarzer et al., 1997; Farhadi et al., 2000) and tPA-EGFP in hippocampal neurons, neurons expressing tPA-EGFP were immunostained with anti-SgII antibodies, as described previously (Lochner et al., 1998); similarly, to compare the distributions of the acidic organelle marker LysoTracker Red (Molecular Probes, Eugene, OR) and tPA-EGFP, neurons expressing tPA-EGFP were incubated with 100 nm LysoTracker Red for ∼1 h. To determine the thickness of the actin cortex in hippocampal neurons and the degree of DCG colocalization with cytoskeletal constituents, microtubules in neurons expressing tPA-EGFP were labeled by immunostaining with a mouse anti-tubulin primary antibody (DM1A; Sigma, St. Louis, MO) and an Alexa Fluor 350-conjugated goat anti-mouse secondary antibody (Molecular Probes), and actin filaments were labeled by staining with Texas Red-conjugated phalloidin (Molecular Probes). FITC-conjugated phalloidin also was used in some experiments with untransfected cells.
Imaging
Wide-field imaging was used to study DCG distribution and dynamics throughout cells. Wide-field images of the distribution of DCGs in fixed cells were collected on either a Leica (Chantilly, VA) microscope under the control of MetaMorph software (Universal Imaging, Downington, PA) or an Olympus (Lake Success, NY) microscope under the control of DeltaVision software (Applied Precision, Issaquah, WA). Wide-field, time-lapse images of the dynamics of DCGs were collected on the Leica microscope.
TIRFM imaging was used to study DCG distribution and dynamics near the plasma membrane (Axelrod, 2003). TIRFM images of membrane-proximal DCGs were collected using a TIRFM system (Nikon, Melville, NY) under the control of MetaMorph software. This TIRFM system uses the “prismless TIR method” and a 1.45 numerical aperture objective. TIRFM selectively reveals membrane-proximal fluorescent molecules through use of evanescent excitation light that decays exponentially in intensity along the direction perpendicular to an interface as I(z) = I0e-z/d, where z is distance from the glass/liquid interface to which the cells adhere, and d is the evanescent field penetration depth (Axelrod, 2003). The exponentially decaying excitation light causes fluorophores to appear progressively dimmer as they move away from the interface (to larger z values). Moreover, fluorophores are virtually invisible when they are more than ∼3d from the interface. We calculated d to be ∼90 nm in our experiments, using a refractive index of 1.38 for the cell cytoplasm and a wavelength (λ) of 488 nm for the excitation light (Johns et al., 2001). This implies that DCGs visible in our TIRFM experiments were within ∼270 nm of the plasma membrane.
Methodology for mounting samples depended on the type of sample imaged: live or fixed. For live (time-lapse) imaging, coverslips containing hippocampal neurons were mounted in a chamber in Hanks-based imaging medium augmented with 10 mm HEPES and 0.6% glucose. The chamber was maintained at 26-32°C. For fixed imaging, coverslips containing neurons were mounted in elvanol and sealed to a slide with clear nail polish.
Methodology for acquiring images also depended on the type of sample imaged. Time-lapse images of DCG transport in living cells were generated by taking images of the same focal plane every 100-600 ms. Wide-field, time-lapse images were deblurred using a constrained iterative deconvolution algorithm (Scalettar et al., 1996) to improve image clarity and to facilitate tracking of DCGs. Most static images of distribution in fixed cells were generated by optically sectioning cells in 0.2 μm focal increments (Hiraoka et al., 1991; Scalettar et al., 1996); these images also were deblurred.
Release and cytoskeletal disruption assays
Regulated secretion of tPA-EGFP induced by depolarization with high (50-58 mm) KCl was assayed by imaging hippocampal neurons in a chamber with a loosely affixed top coverslip that facilitated exchange of the imaging medium. First, cells were imaged in a low-KCl medium using wide-field microscopy. Next, the top coverslip was removed (while the chamber remained on the microscope), and the low-KCl medium was removed and replaced with high-KCl medium containing 2 mm CaCl2. Finally, cells were imaged at defined times after the addition of the high-KCl medium. In experiments designed to evaluate the calcium dependence of release, the high-KCl medium was modified by replacing Ca2+ with Mg2+, and 5 mm EGTA was added. DCG transport in the presence of actin filament or microtubule disruption induced by cytochalasin D or nocodazole was assayed similarly using TIRFM. First, cells were imaged in the absence of disrupter and then at defined times after the addition of 10 μm cytochalasin D or 30 μm nocodazole (Sigma).
Data analysis
Quantification of release. Loss of fluorescence induced by depolarization was determined by calculating and comparing fluorescence signals emitted by growth cones before and after the addition of high KCl. Fluorescence signals emitted by growth cones were calculated by generating a background-subtracted image and then outlining the growth cone and summing intensities inside the outlined area, using DeltaVision software or the public domain program ImageJ. These data were corrected for a small amount of bleaching by fitting the time course of the fluorescence before depolarization to a linearly decreasing function using Excel (Microsoft, Redmond, WA) and then using this function to correct predepolarization and postdepolarization data for the effects of bleaching.
Quantification of cortex thickness. We computed the approximate thickness of the actin cortex by viewing deblurred, optically sectioned, phalloidin-stained images in three dimensions using the Volume Viewer program in DeltaVision software. Specifically, three-dimensional images were rotated, and phalloidin intensities near the edge of the phalloidin stain were quantified and used to compute an average edge intensity for the phalloidin stain. The edges of the actin cortex were defined as the most distal points at which the phalloidin intensity exceeded the average edge intensity. The distance between these points was taken as the thickness of the actin cortex.
Quantification of colocalization. We determined the extent of colocalization between tPA-EGFP and antibody-tagged SgII by separately imaging the distribution of each type of protein in a fixed, dual-labeled cell; this was accomplished using standard filters that isolate the fluorescence from each labeled species. The individual grayscale images revealing the distribution of each labeled species were colored green or red to reflect the emission from the two labels and superimposed to produce dual-color images that reveal overlap in protein distribution. Using these dual-color images, we quantified the percentage of overlap between puncta containing tPA-EGFP and puncta containing SgII by counting yellow puncta in one optical section in a subregion of a cell and normalizing the number of yellow puncta by the total number of green and yellow puncta in that subregion. In quantifying overlap, we neglected a slight (<0.1 μm) lack of registration in the center positions of overlapping puncta, because wavelength-dependent image shifts are known to cause such slight registration problems in multicolor images (Hiraoka et al., 1991; Scalettar et al., 1996). Other colocalization data were analyzed similarly. Colocalization with LysoTracker Red was analyzed similarly, but in living cells. This is because we found that LysoTracker Red did not fix well in hippocampal neurons, consistent with information provided by Molecular Probes. Because organelles in living cells can move during, and between, successive exposures, we took short exposures, briefly lowered the temperature to slow motion, and analyzed colocalization in subregions of cells in which the organelles were not moving very rapidly.
Tracking. In TIRFM images, DCGs were tracked laterally in two dimensions (x, y) using ImageJ. For all tracked DCGs, the average signal exceeded the average signal in associated surrounding annuli by more than threefold; this ensured that tracked DCGs were clearly distinguishable from background noise. DCGs were tracked by eye in background-subtracted movies. Typically, this involved surrounding a DCG in a given frame with a circle of diameter ∼0.7 μm and calculating the center of mass of the fluorescence distribution in the circle using ImageJ. In some cases, a noncircular region was used, because a DCG would move significantly during an exposure and thus would appear noncircular in shape. Tracking of a DCG in successive frames was continued as long as the DCG could be identified unambiguously. The (x, y) coordinates of the centers of mass of DCGs were tabulated as a function of frame number (time) and converted into trajectories, as described previously (Abney et al., 1999). In wide-field images, DCGs were tracked using DeltaVision software, as described previously (Abney et al., 1999).
In TIRFM images, DCGs also can be tracked in the axial (z) direction by exploiting the variation in DCG brightness with distance from the interface. Specifically, DCG distance from the interface can be found from the relationship z = -dln(I/I0) (Axelrod, 2003). Here, I was computed as the total DCG fluorescence in a surrounding 0.7 μm circle (or noncircular region when appropriate). I0 (fluorescence at z = 0) was computed using one of two methods. First, when we quantified axial transport rates, we computed I0 using the brightest DCG in the movie, which was assumed to be located at z = 0. This procedure neglects DCG-to-DCG variation in intrinsic brightness. This approximation will not affect calculations of changes in z positions (and thus axial transport rates or the shape of three-dimensional trajectories), but it will affect calculations of absolute z positions (Axelrod, 2003). Second, when we quantified z positions of fusing DCGs and generated their three-dimensional trajectories, we computed I0 for each individual DCG from a bright image captured slightly before we observed the intensity increases associated with the onset of protein release.
To visualize prefusion transport in three dimensions, we generated three-dimensional trajectories of fusing DCGs. To this end, (x, y, z) coordinates of DCGs were loaded into Mathematica (Wolfram Research, Champaign, IL), which generated an array of three-dimensional vectors connecting the coordinates. Three-dimensional trajectories were obtained by plotting these vectors.
Quantification of speeds and diffusion coefficients. Lateral DCG motion was characterized quantitatively by computing the mean-squared displacement, 〈r2〉, of DCGs as a function of time, t, and fitting to a model that describes “diffusive” and “directed” motion as follows (Saxton and Jacobson, 1997; Abney et al., 1999):
 |
1 |
where r is displacement, D is the diffusion coefficient, and v is speed; the brackets 〈〉 denote averaging, which was performed for individual DCGs using a “single-particle tracking” algorithm that is well suited to determining whether the dynamics are diffusive or directed (or neither) when motion is monitored for only a finite time (Abney et al., 1999). In Equation 1, diffusive motion produces a linear relationship between 〈r2〉 and t, whereas directed motion produces a linear relationship between 〈r2〉1/2 and t. D and v were computed from fits to Equation 1, as described previously (Abney et al., 1999).
We also characterized axial DCG motion quantitatively using fits to Equation 1. However, because z diffusion is one-dimensional, the “4” in Equation 1 was replaced with a “2.” In some cases, the fits of axial motion to Equation 1 over relatively long time scales were good, like they typically were for lateral motion. However, in many cases, the fits of axial motion to Equation 1 over relatively long time scales were not good. For this reason, we also used “instantaneous” speed, vinst, to characterize axial mobility, similar to previous uses of instantaneous diffusion coefficients (Johns et al., 2001; Ng et al., 2003). Instantaneous speed was computed as vinst =Δz/Δt, where Δz = zi + 1- zi and Δt = ti + 1- ti.
DCGs were characterized as effectively laterally immobile if their associated diffusion coefficients were very small (D < 5.0 × 10⁻¹² cm2/s = 5.0 × 10⁻⁴ μm2/s). This approach was adopted to facilitate direct comparison with immobility data obtained from studies of pheochromocytoma (PC12) cells (Burke et al., 1997).
Results
tPA fluorescent proteins localize to DCGs in hippocampal neurons
Green, cyan, and yellow hybrids of tPA, pNPY, and OFQ localize to DCGs in neuroendocrine cells (Lochner et al., 1998; Abney et al., 1999; Taraska et al., 2003). Morphological and colocalization data both indicate that these hybrids also localize to DCGs in hippocampal neurons. In fluorescence images, the puncta containing the hybrids are diffraction-limited spots with a full-width at half-maximum of ∼250 nm, consistent with results obtained from electron microscopy studies of DCGs (Chuang et al., 1999).
Three types of colocalization data indicate that the hybrids localize to DCGs in hippocampal neurons. First, hybrids of tPA, pNPY, and OFQ colocalize extensively in neurons. Figure 1A shows a subregion of a process of a 2 d in vitro (DIV) hippocampal neuron expressing tPA-ECFP and pNPY-EYFP. The image shows extensive colocalization of the two hybrids; quantification in this cell revealed that colocalization was ∼88% (n = 189 puncta). Colocalization between tPA-EYFP and OFQ-ECFP was similar (data not shown). Second, hybrids of tPA colocalize with the endogenous DCG protein SgII. Figure 1B shows a subregion of a process of a 7 DIV hippocampal neuron expressing tPA-EGFP that was immunostained for endogenous SgII. In this image, 100% of organelles containing tPA-EGFP also stain for SgII, and some organelles stain only for SgII; on average, 83 ± 4% of organelles containing tPA-EGFP also stain for endogenous SgII in hippocampal neurons (n = 3 cells; 167 puncta). Third, tPA-EGFP colocalizes with a marker for acidic organelles. Figure 1C shows a subregion of the soma of an 8 DIV hippocampal neuron expressing tPA-EGFP that was stained with LysoTracker Red. In this image, 100% of organelles containing tPA-EGFP also contain LysoTracker Red, and some organelles contain only LysoTracker Red; on average, 95 ± 6% of organelles containing tPA-EGFP also contain LysoTracker Red (n = 3 cells; 92 puncta). In colocalization experiments, the size and morphology of the non-colocalizing and colocalizing puncta containing tPA hybrids were indistinguishable.
Figure 1.

Deblurred images of part of a process of a fixed hippocampal neuron expressing tPA-ECFP (red) and pNPY-EYFP (green) (A), part of a process of a fixed hippocampal neuron expressing tPA-EGFP (green) and immunostained for endogenous SgII (red) (B), and part of the soma of a living hippocampal neuron expressing tPA-EGFP (green) and stained with Lyso-Tracker Red (red) (C) are shown. Areas of overlap appear yellow. We analyzed the immunostained images and assumed that all green, yellow, and red spots are DCGs; this indicates that ∼34-73% of DCGs contain tPA-EGFP. Scale bars, 5 μm.
tPA hybrids undergo slow and limited release from growth cones of hippocampal neurons
To demonstrate regulated release of tPA hybrids from growth cones of hippocampal neurons, and to determine the kinetics and extent of release, we adopted standard assays and measured loss of fluorescence induced by depolarization with high KCl; demonstration of regulated release also indicates that the hybrids localize to DCGs (Burke et al., 1997; Lang et al., 1997). Figure 2A-D, shows a phase image of a growth cone of a 4 DIV hippocampal neuron expressing tPA-EGFP (A), fluorescence images of DCG distribution in the same growth cone before and after the addition of high KCl (B, C), and the time course of the total fluorescence emitted from the growth cone before and after the addition of high KCl (D). For this growth cone, depolarization-induced loss of fluorescence reached a plateau ∼7 min after the addition of 50 mm KCl and was ∼30%; the average loss of fluorescence ∼7 min after the addition of high KCl was 29 ± 4% (n = 3 cells). Moreover, we found a similar, 33 ± 4% (n = 3 cells), depolarization-induced decrease in fluorescence from growth cones of hippocampal neurons expressing tPA fused to ECFP. This latter result strongly suggests that our fluorescence loss reflects protein release and not pH effects, because the emission of ECFP is quite insensitive to pH (Llopis et al., 1998). Depolarization-induced loss of fluorescence from growth cones of PC12 cells is similar (Burke et al., 1997; Lochner et al., 1998).
Figure 2.

Phase (A) and wide-field fluorescence (B, C) images of a growth cone before (B) and 7 min after (C) stimulation with high KCl are shown. D, Temporal dependence of the fluorescence signal from the growth cone before and after stimulation, which occurs at the time point indicated by the arrow. Circles show raw data, and squares show data corrected for photobleaching. Scale bar, 5 μm.
We also studied the calcium dependence of the release of tPA hybrids using the buffers described in Materials and Methods, and we found that depolarization with high KCl evokes release only in the presence of external calcium (L. S. Honigman, W. F. Grant, S. K. Gessford, A. Hansen, M. A. Silverman, B. A. Scalettar, and J. E. Lochner, unpublished results). Dependence on external calcium is characteristic of regulated protein release from DCGs, further supporting targeting of tPA hybrids to DCGs (Hartmann et al., 2001).
DCGs colocalize with microtubules and actin filaments in hippocampal neurons
As a first step in identifying cytoskeletal DCG interactions, we collected images of neurons that were stained for DCGs, tubulin, and actin. Figure 3A shows a fluorescence image of a stained growth cone. This image demonstrates that some DCGs colocalize with microtubules (arrowheads), whereas others, such as those in filopodia and near the plasma membrane (arrows), colocalize with actin filaments.
Figure 3.
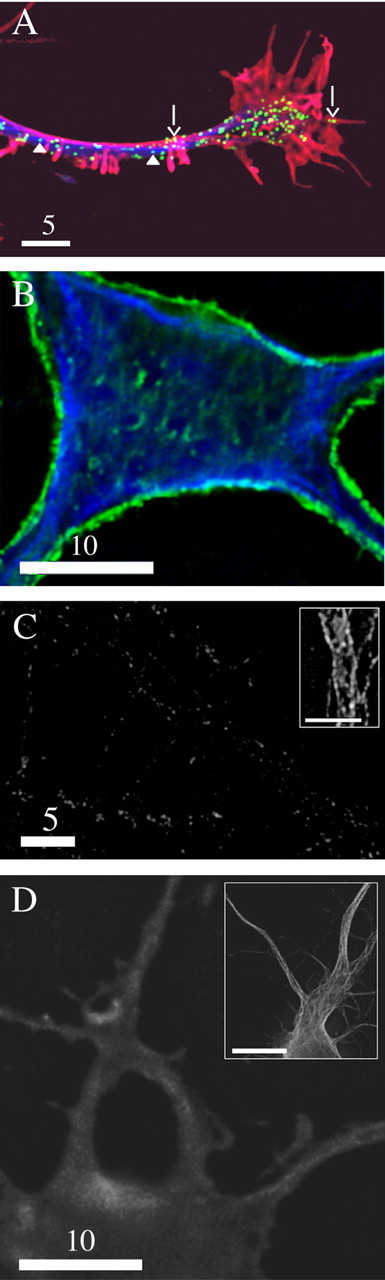
A, Deblurred fluorescence image of a growth cone and process of a neuron expressing tPA-EGFP (green) that was stained with anti-tubulin antibodies (blue) and Texas Red phalloidin (red). The arrowheads show DCGs that colocalize with microtubules, whereas the arrows show DCGs that colocalize with actin filaments. B, Deblurred fluorescence image of the soma of an untransfected neuron that was stained with anti-tubulin antibodies (blue) and FITC phalloidin (green). C, Deblurred fluorescence image of processes of a hippocampal neuron stained with Texas Red phalloidin showing that actin filaments are significantly disrupted by incubation with 10 μm cytochalasin D for ∼1 h. The inset shows stained, undisrupted actin filaments in part of a process on the same display scale. D, Deblurred fluorescence image of part of the soma and proximal processes of a hippocampal neuron stained with anti-tubulin antibodies showing that microtubules are significantly disrupted by incubation with 30 μm nocodazole for ∼1 h. The inset shows stained, undisrupted microtubules in the soma and proximal processes on the same display scale. Scale bars: A, C, 5 μm; B, D, 10 μm; C (inset), 5 μm; D (inset), 10 μm.
We also collected images of stained neurons to quantify the thickness of the actin cortex in hippocampal neurons and to determine drug incubation conditions that disrupt actin filaments and microtubules in hippocampal neurons. Figure 3B shows the actin cortex in the soma of a hippocampal neuron. The cortex also is visible in processes and growth cones; we measured its thickness in these subdomains and obtained similar results in all subdomains, 315 ± 153 nm (n = 5 cells), subject to the resolution limitations of optical microscopy. Figure 3, C and D, shows that the distributions of actin filaments and microtubules in hippocampal neurons are markedly disrupted by incubation with 10 μm cytochalasin D or 30 μm nocodazole for ∼1 h, respectively. In particular, Figure 3C shows residual actin staining in processes that is weak and punctate, as is characteristic of disrupted actin stained with phalloidin (Allison et al., 1998, 2000). Similarly, Figure 3D shows residual tubulin staining that is relatively diffuse, as is characteristic of disrupted microtubules stained with DM1A (Bustos et al., 2001). Thus, we used these drug incubations for cytoskeletal disruption experiments.
DCGs in growth cones of hippocampal neurons are predominantly mobile
We quantified the mobile and immobile fractions of DCGs in hippocampal neurons using two methods. First, we quantified loss of overlap in DCG positions as a function of time. Figure 4 shows a phase image of a growth cone of a 4 DIV hippocampal neuron (A) and associated time-lapse, wide-field fluorescence images of the distribution of DCGs containing tPA-EGFP in the growth cone (B-D). Here, green indicates DCG positions at an initial time, red indicates DCG positions at a specified later time, and yellow indicates overlap of green and red. Overlap in positions is lost substantially within ∼10-27 s, showing that most DCGs are mobile over a time scale of <27 s.
Figure 4.

Phase (A) and deblurred fluorescence (B-D) images showing that the distribution of DCGs containing tPA-EGFP in growth cones changes appreciably over the time scale of 10-27 s. In these images, green denotes DCG positions at a fixed initial time, red denotes DCG positions at the specified later time, and yellow denotes overlap of green and red (immobility). After 3 s, many DCGs still are yellow, indicating that they have not moved or that they occupy a position previously occupied by another DCG. In contrast, after 10 s most DCGs are not yellow, and after 27 s only a few DCGs are yellow. In these images, lack of DCG overlap arises from DCG motion and not from overall motion of the cell. This is clear from (1) the movies, (2) the fact that the overall outline of the cell did not shift, (3) the fact that DCG movement was not correlated, and (4) the fact that a few DCGs basically did not move. Similarly, lack of DCG overlap is not attributable to drift of the imaging apparatus. In both our wide-field and TIRFM movies, center-of-mass positions of a few immobile DCGs shifted significantly <0.1 μm during movie collection (∼45 s). This suggests that the lateral drift rate in movies is <0.1 μm/45 s. Drift in z was similarly negligible. Scale bar, 10 μm.
Significantly, there is some yellow remaining in Figure 4D. Some of this yellow reflects DCGs that are mobile but happen, by chance, to overlap after 27 s; this was verified by examining the associated movie. However, some yellow reflects DCGs that essentially are immobile. We quantified this immobile fraction by counting the yellow puncta in Figure 4D, verifying immobility using the movie, and normalizing the number of yellow puncta by the total number of puncta in the growth cone at one time point. Using this type of analysis, we found that 9% of the DCGs in the growth cone and 10% of the DCGs in the process in Figure 4 are immobile over a time scale of ∼27 s.
Second, to facilitate comparison with results obtained from PC12 cells, we calculated diffusion coefficients and classified a DCG as effectively immobile if its associated D < 5.0 × 10⁻¹² cm2/s. Tracking of 208 DCGs in growth cones of three representative cells revealed that 14 ± 3% belong to the immobile fraction, based on having D < 5.0 × 10⁻¹² cm2/s.
Short-ranged transport of DCGs in growth cones of hippocampal neurons is predominantly active
To study the mechanisms underlying short-ranged (on the order of several micrometers) transport of DCGs in hippocampal neurons near sites of exocytosis, we tracked DCGs in growth cones. Figure 5A shows trajectories of 15 DCGs in the growth cone in Figure 4 superimposed on an outline of the growth cone; an associated movie can be viewed as supplemental material (available at www.jneurosci.org). These trajectories were selected for display because they illustrate the spectrum of dynamic behaviors exhibited by DCGs in the absence of a stimulus to secrete.
Figure 5.

A, Trajectories of DCGs in the growth cone in Figure 4, superimposed on an outline of the growth cone. The starting DCG positions are labeled with a filled circle. Not all of the trajectories shown were generated simultaneously, and a few trajectories corresponding to different times were displaced slightly to avoid overlap. Scale bar, 5 μm. Representative plots of 〈r2〉1/2 versus t (B) and 〈r2〉 versus t (C) deduced from the DCG trajectories in A are shown. The letters next to the plots identify the trajectories from which the plots were derived. Some values were rescaled so that all plots could be displayed together conveniently. In B, values of 〈r2〉1/2 were multiplied by 2 for DCG h. In C, values of 〈r2〉 were multiplied by 5 and 2 for DCGs h and m, respectively.
DCGs a-f (Fig. 5A) provide examples of rapid, substantially directed motion in a growth cone. Rapid, directed motion also occurs in axons, dendrites, and the soma (data not shown).
DCGs g-m (Fig. 5A) provide examples of slow, substantially random motion in a growth cone. Random motion also occurs in axons, dendrites, and the soma (data not shown). In some cases, random motion appears to be diffusive, as demonstrated in Figure 5C.
DCGs n and o (Fig. 5A) provide examples of immobility in a growth cone. Immobility also occurs in axons, dendrites, and the soma (data not shown).
Figure 5, B and C, characterizes the dynamics of individual DCGs quantitatively, showing representative plots of 〈r2〉1/2 versus t (panel B) and 〈r2〉 versus t (panel C) that were derived from selected DCG trajectories shown in Figure 5A.
Figure 5B shows that DCGs c and d, which appear in Figure 5A to have undergone rapid and directed motion, generated trajectories that could be described quantitatively by the directed motion term v2t2 in Equation 1, implying that 〈r2〉1/2 was proportional to t. Speeds v computed from slopes of the 〈r2〉1/2 versus t plots were 0.25 μm/s for DCG c and 0.30 μm/s for DCG d. The average speed of DCGs undergoing directed motion in growth cones was 0.37 ± 0.23 μm/s.
Figure 5C shows that DCGs h and m, which appear in Figure 5A to have undergone slow and random motion, generated trajectories that could be described quantitatively by the diffusive motion term 4Dt in Equation 1, implying that 〈r2〉 was proportional to t. Diffusion coefficients D computed from slopes of the 〈r2〉 versus t plots were 4.6 × 10⁻¹¹ cm2/s for DCG h and 4.9 × 10⁻¹¹ cm2/s for DCG m.
Most of the trajectories were well fit by either the directed or diffusive motion terms of Equation 1. As expected, trajectories that were well fit by one term generally were poorly fit by the other term, as shown by the nonlinear curves in Figure 5, B and C.
Mobile DCGs in growth cones of PC12 cells almost exclusively undergo slow, diffusive motion (Burke et al., 1997; Abney et al., 1999; Han et al., 1999b; Ng et al., 2003). To determine whether this also is true for hippocampal neurons, we tracked 208 DCGs (n = 3 cells; three different preparations) in growth cones and computed the percentages of trajectories that were well fit by the directed and diffusive models. Using this approach, we found that 49 ± 7% of DCGs undergo fast, directed motion, 38 ± 6% undergo slow, diffusive motion, and the remaining ∼13% essentially are immobile, as noted above.
DCGs near the plasma membrane of hippocampal neurons are laterally mobile, undergoing diffusive and directed motion
It is possible that DCGs in hippocampal neurons are predominantly mobile but that membrane-proximal DCGs in hippocampal neurons are predominantly immobile, reflecting interaction with the actin cortex or the plasma membrane. To address this possibility, we selectively studied transport near the plasma membrane using TIRFM. The ability of this technique selectively to reveal membrane-proximal DCGs is illustrated in the comparison wide-field (A) and TIRFM (B) images of a soma and proximal processes in Figure 6.
Figure 6.

Comparison wide-field (A) and TIRFM (B) images of the soma and proximal processes of a hippocampal neuron expressing tPA-EGFP are shown. Fluorescence from deeper in the cell (e.g., from the trans-Golgi network) is visible only in the wide-field image. C, D, TIRFM images, analogous to those in Figure 4, showing that the distribution of membrane-proximal DCGs containing tPA-EGFP changes appreciably over the time scale of 27 s. Scale bar, 10 μm.
TIRFM images demonstrate that membrane-proximal DCGs also are predominantly mobile. Figure 6, C and D, shows TIRFM images of the distribution of DCGs containing tPA-EGFP in a 7 DIV hippocampal neuron. Again, overlap in positions is lost substantially within ∼27 s, showing that most membrane-proximal DCGs are laterally mobile over a time scale of <27 s.
To study the mechanisms underlying the transport of membrane-proximal DCGs in hippocampal neurons, we tracked the lateral movement of DCGs in TIRFM movies. Figure 7A shows (x, y) trajectories of nine membrane-proximal DCGs in the process of a 7 DIV hippocampal neuron superimposed on an outline of a subregion of the process. These trajectories suggest that membrane-proximal DCGs, like DCGs in growth cones, undergo diffusive and directed lateral motion and that some membrane-proximal DCGs are laterally immobile.
Figure 7.
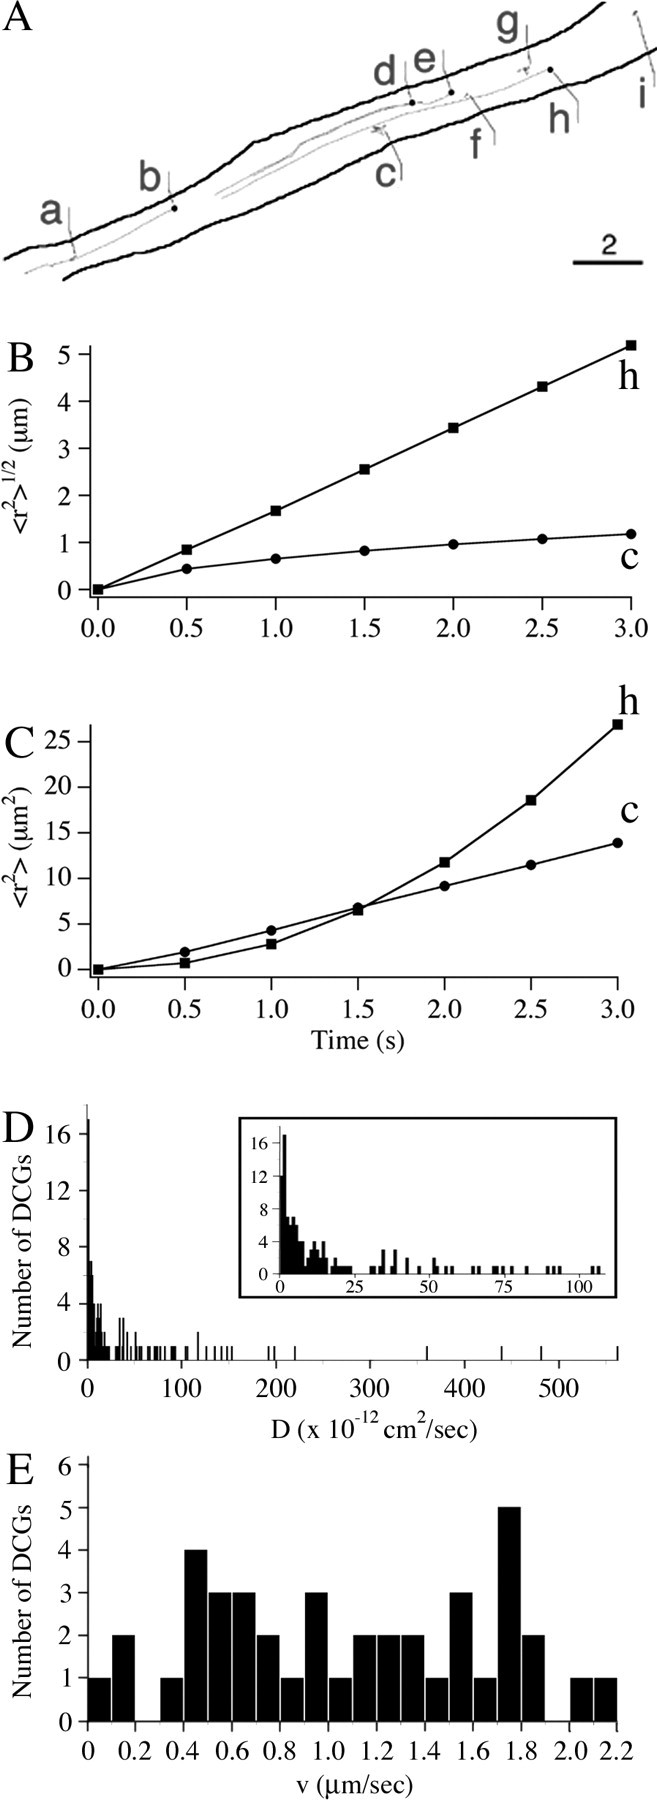
A, Trajectories of membrane-proximal DCGs in a process, superimposed on an outline of the process. The starting DCG positions are labeled with a filled circle. Not all of the trajectories shown were generated simultaneously. Scale bar, 2 μm. B, C, Representative plots, analogous to those in Figure 5, deduced from the DCG trajectories in A. Values of 〈r2〉1/2 and 〈r2〉 were multiplied by 10 and 1000 for DCG c. D, E, Histograms showing the distribution of diffusion coefficients and speeds obtained in TIRFM experiments. The inset in the diffusion histogram shows just the range covered by the PC12 cell diffusion histogram to facilitate comparison of these histograms over their domain of overlap (Ng et al., 2003).
Figure 7, B and C, characterizes the lateral dynamics of individual membrane-proximal DCGs quantitatively, showing representative plots of 〈r2〉1/2 versus t (panel B) and 〈r2〉 versus t (panel C) that were derived from selected DCG trajectories shown in Figure 7A. As in Figure 5, these plots demonstrate the existence of directed and diffusive motion. Speed v computed from the slope of the 〈r2〉1/2 versus t plots was 1.73 μm/s for DCG h; diffusion coefficient D computed from the slope of the 〈r2〉 versus t plots was 1.2 × 10⁻¹¹ cm2/s for DCG c.
Membrane-proximal DCGs in chromaffin cells undergo essentially no lateral motion (Oheim et al., 1998; Steyer and Almers, 1999; Johns et al., 2001). Visual examination of our movies, and the data presented in Figures 6 and 7, suggest that this is not the case for hippocampal neurons. To establish this more quantitatively, we tracked 223 DCGs (n = 3 cells; two different preparations) in TIRFM movies in the lateral direction and computed the percentages of mobile and immobile DCGs; in addition, we computed the percentages of mobile DCGs that undergo directed and diffusive motion. Using this approach, we found that 73 ± 19% of membrane-proximal DCGs are laterally mobile. Among mobile DCGs, 31 ± 9% undergo fast, directed motion with an average v of 1.1 ± 0.6 μm/s, 55 ± 5% undergo diffusive motion with an average D of 7.8 ± 2.7 × 10⁻¹¹ cm2/s, and 14 ± 6% undergo motion that yields a relatively poor fit to both mobility models.
To illustrate further the heterogeneity in DCG mobility in resting hippocampal neurons, and to compare further hippocampal neurons and neuroendocrine cells, we constructed histograms of speeds and diffusion coefficients. Figure 7, D and E, shows histograms of diffusion coefficients and speeds obtained from our TIRFM experiments. Both histograms are broad. The velocity histogram is very unusual, because it reflects the atypical presence of fast, directed motion of membrane-proximal DCGs. The diffusion histogram has some unusual, as well as some more typical, attributes (see Discussion).
DCGs near the plasma membrane of hippocampal neurons are axially mobile
Axial motion of DCGs also can be monitored using TIRFM. This motion is particularly important because it brings DCGs toward sites of exocytosis. Axial mobility is manifest in TIRFM movies as a flicker in DCG brightness arising from exposure of DCGs to different intensities of excitation light at different depths in the evanescent field. Our TIRFM movies reveal substantial flicker, suggesting substantial axial mobility of membrane-proximal DCGs in hippocampal neurons; a representative movie can be viewed as supplemental material (available at www.jneurosci.org).
Flicker might arise from something other than movement in and out of the evanescent field, such as pH-dependent changes in the fluorescence from DCGs containing tPA-EGFP. However, several lines of evidence suggest that this is not the case. First, and most importantly, there is no flicker in our wide-field movies. If something other than the exponential decay of the evanescent field were causing flicker, it should show up in our wide-field and TIRFM movies, and this is not the case. Second, if pH is the source of flicker, the pH changes involved are atypically large, rapid, and random. For example, we frequently observe approximately threefold increases in total DCG brightness on the time scale of ∼1 s, followed by a similar decrease in brightness. If attributed to pH, such changes in brightness require a large (∼2 U) increase in pH in 1 s (Llopis et al., 1998; Han et al., 1999a), followed by a similarly sized and timed decrease in pH. In contrast, if attributed to the evanescent field, such changes in brightness require only two oppositely directed ∼100 nm axial displacements each occurring in 1 s. In light of these facts, flicker in our TIRFM movies almost certainly arises from axial movement.
We quantified axial motion by fitting axial trajectories to the one-dimensional analog of Equation 1. However, over the time scale of several seconds, many axial trajectories were not well fit by the model underlying Equation 1, which assumes that motion is described by a single speed or diffusion coefficient. Thus, we used instantaneous speed to measure mobility over a shorter time interval (0.5 s), similar to previous work (Johns et al., 2001; Ng et al., 2003). Calculations of instantaneous speeds suggest that many membrane-proximal DCGs are axially mobile; 55 ± 11% of membrane-proximal DCGs achieved an instantaneous speed >0.1 μm/s at least once along their trajectory. In contrast, a smaller population of DCGs was relatively immobile; 16 ± 11% never achieved an instantaneous speed >0.05 μm/s at any point on their trajectory.
As a final measure of immobility, we quantified the percentage of membrane-proximal DCGs that is both laterally and axially immobile. For this analysis, we used D < 5.0 × 10⁻¹² cm2/s as our lateral immobility criterion and vinst < 0.05 μm/s (all points on the trajectory) as our axial immobility criterion. Based on these criteria, the immobile fraction is 13 ± 10%.
DCGs undergo substantial lateral and/or axial motion as a prelude to exocytosis
We also tracked fusing DCGs to determine the types of transport that precede exocytosis. Figure 8A shows an example of DCG exocytosis in a process of a hippocampal neuron visualized with TIRFM. Total DCG fluorescence first increased approximately threefold without spreading, indicating substantial prefusion axial motion or an increase in DCG pH as the fusion pore opens; fluorescence then spread, revealing fusion with the plasma membrane (Schmoranzer et al., 2000; Scalettar et al., 2002).
Figure 8.
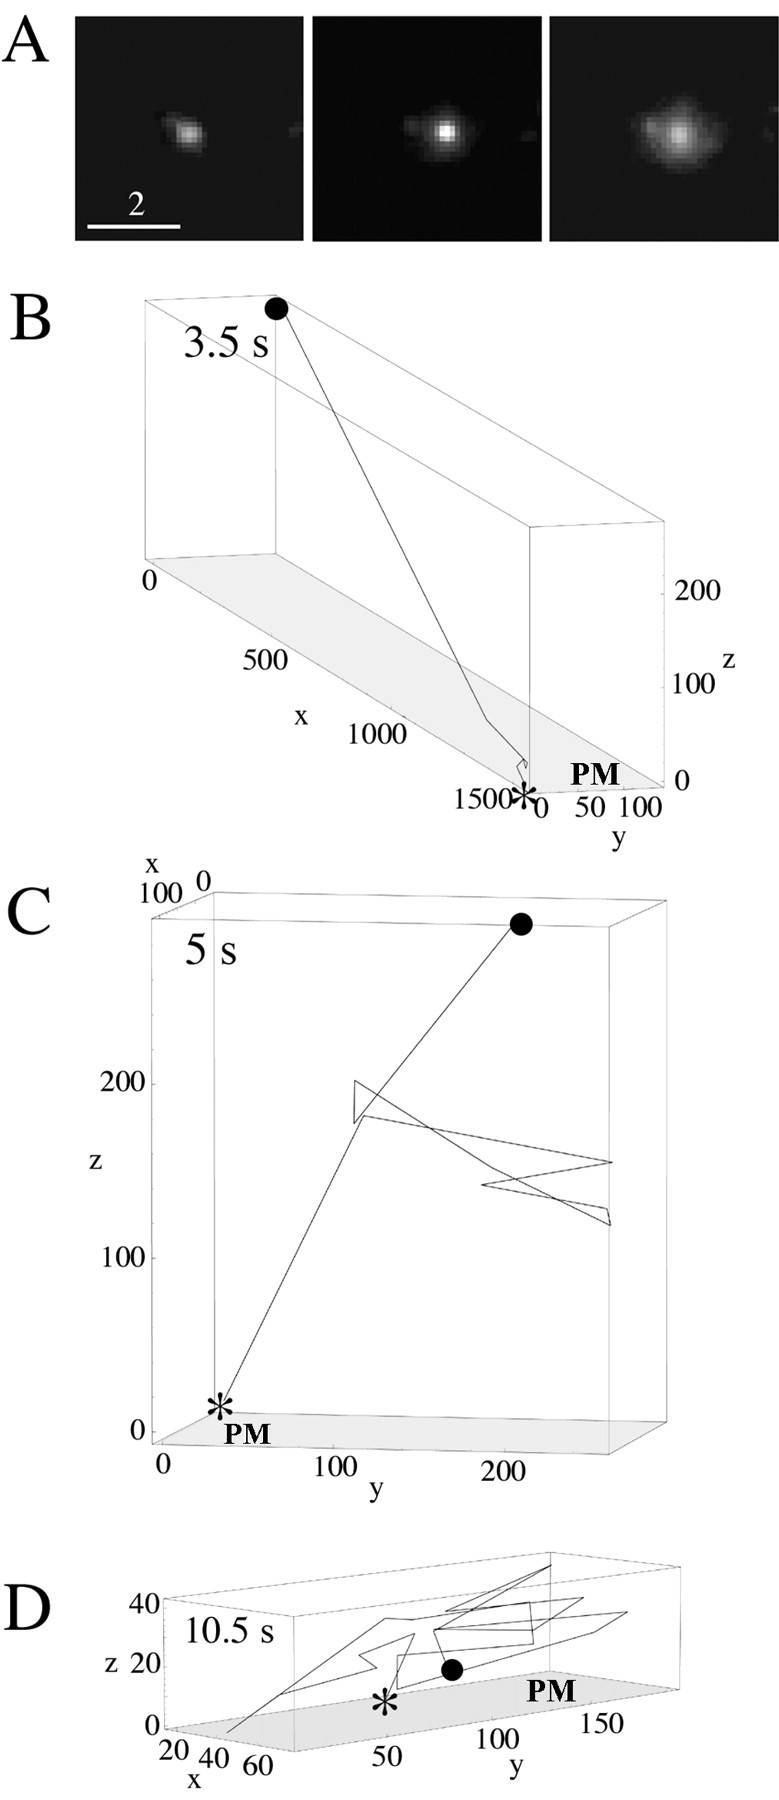
A, Exocytosis event in a process observed using TIRFM. As expected, the punctum at first brightens without spreading and then spreads in the images (left to right) as the DCG approaches the membrane and fuses. Scale bar, 2 μm. Three-dimensional trajectories of fusing DCGs showing the existence of prefusion movement that is substantially lateral (B), axial (C), and random (D) are shown. The numbers along the axes indicate distance in nanometers; the numbers in the top left corners indicate elapsed time. The starting DCG positions are labeled with a filled circle, exocytosis points are labeled with an asterisk, and the plasma membrane is labeled with the letters PM. We attributed brightening that occurs just before the apparent onset of fusion to axial movement and not to increases in DCG pH associated with the opening of a fusion pore, if the DCG was very dim before brightening and also moved laterally.
We found that DCGs usually move significantly immediately before fusing. To display the spectrum of transport processes that precede exocytosis, we generated z coordinates for DCGs by converting brightness into distance from the fluid/glass interface and then used (x, y, z) coordinates to generate three-dimensional, prefusion trajectories for fusing DCGs. Figure 8, B-D, shows three representative three-dimensional trajectories for fusing DCGs. These trajectories reveal significant prefusion motion in both the lateral and axial directions, and they show that prefusion trajectories come in many forms. For example, these trajectories can be nonrandom and directed predominantly in the lateral and/or axial direction, or they can be random.
Cytoskeletal disruption does not perturb the immobile fraction
To investigate cytoskeletal interactions with membraneproximal DCGs further, we collected TIRFM movies before and after incubation with cytochalasin D or nocodazole under conditions that are known to lead to actin filament and microtubule disruption in hippocampal neurons (Bradke and Dotti, 1999; Guillaud et al., 2003). We also confirmed disruption by staining and imaging the cytoskeleton after incubation with cytochalasin D or nocodazole (Fig. 3).
On average, incubation with 10 μm cytochalasin D or 30 μm nocodazole for ∼1 h altered the immobile fraction by <20% (n = 4 cells), suggesting that DCGs in hippocampal neurons are not immobilized by attachment to the cytoskeleton. This also is suggested by the fact that immobile DCGs tend to be the brightest DCGs, suggesting that their immobilization reflects attachment to the plasma membrane, rather than the cytoskeleton. In addition, incubation with cytochalasin D or nocodazole did not completely eliminate the fast-moving fraction. This suggests the presence of both actin-based and microtubule-based motors on DCGs in hippocampal neurons, similar to neuroendocrine cells (Desnos et al., 2003; Rudolf et al., 2003).
Discussion
The experiments described here were directed (1) at determining the mechanisms underlying short-ranged transport of DCGs in neurons near sites of exocytosis, (2) at comparing short-ranged transport in neurons and neuroendocrine cells, and (3) at relating the transport results for neurons to current ideas about DCG exocytosis.
In neurons, the link between distribution, short-ranged transport, and the kinetics of exocytosis has been well studied for synaptic vesicles, which are organelles that store and release classical neurotransmitters (Doussau and Augustine, 2000). Synaptic vesicles cluster near sites of exocytosis, such as presynaptic nerve termini, and their lateral mobility near these sites is very restricted, perhaps reflecting tethering to the actin cytoskeleton via synapsins (Hirokawa et al., 1989; Ceccaldi et al., 1995; Henkel et al., 1996; Kraszewski et al., 1996). These attributes help to ensure that synaptic vesicles are near release sites and thus undergo exocytosis rapidly.
Unlike synaptic vesicles, the link between distribution, short-ranged transport, and the kinetics of exocytosis for DCGs in neurons is not well understood. Distribution is understood best, and it is known that DCGs localize to sites of exocytosis, such as presynaptic termini, but that they do not cluster there (Doussau and Augustine, 2000). However, it is not known how DCGs are transported near sites of exocytosis in neurons or how short-ranged transport impacts exocytosis.
Attributes and implications of DCG mobility near sites of exocytosis in hippocampal neurons
To address unresolved issues surrounding mobility, we studied the transport of DCGs in hippocampal neurons at several sites of exocytosis: the plasma membrane of growth cones, neurites, and the soma. In these regions, DCGs undergo diffusive and directed transport, and mobilities vary over a broad range, differing by more than three orders of magnitude among DCGs that undergo diffusive motion and more than one order of magnitude among DCGs that undergo directed motion.
To address some aspects of DCG exocytosis from neurons, we also studied the time scale and extent of release of tPA-EGFP from growth cones. These studies were important because regulated protein release from hippocampal neurons has been the subject of limited study. Within our temporal resolution, we found that release has a relatively slow onset after stimulation with high KCl and extends over a relatively long time scale. Similar results have been obtained for the DCG protein brain-derived neurotrophic factor, in hippocampal neurons, after stimulation with high KCl or high-frequency electrical impulses (Hartmann et al., 2001; Gartner and Staiger, 2002).
We also studied DCG transport before exocytosis and found that prefusion movement again is significant in extent and heterogeneous. For example, some DCGs undergo directed, axial movement immediately before fusion, whereas others undergo directed, lateral movement immediately before fusion, whereas still others move randomly. These data suggest that mobile DCGs participate in exocytosis in hippocampal neurons. In this respect, hippocampal neurons are somewhat similar to differentiated PC12 cells, except that prefusion mobility in PC12 cells is purely slow and random (Han et al., 1999b; Ng et al., 2003). In contrast, in this respect, hippocampal neurons are very different from chromaffin cells and pancreatic β-cells, where immobile (docked) DCGs participate in exocytosis (Parsons et al., 1995; Steyer et al., 1997; Oheim et al., 1998; Ohara-Imaizumi et al., 2002).
Interestingly, these transport results explain the extended time scale of release of neuronal DCG proteins. Our data, and data obtained from PC12 cells, suggest that DCG exocytosis in differentiated cells in large part depletes DCGs that are hundreds of nanometers to micrometers from the plasma membrane (Burke et al., 1997; Han et al., 1999b; Ng et al., 2003). Given this, we calculated the time scale for mobile DCGs in hippocampal neurons to explore distances from ∼0.1-2 μm before exocytosis. This time scale can be calculated using our mobility data and the relationships 〈r2〉1/2 = (4Dt)1/2 and 〈r2〉1/2 = vt, where t is the time, 〈r2〉1/2 is the distance, D is the diffusion coefficient, and v is the speed (Berg, 1983). For DCGs undergoing diffusive and directed transport in hippocampal neurons, these time scales extend from ∼50 ms to ∼30 min and from ∼50 ms to ∼20 s, respectively. Thus, the extended time scale of regulated protein release from hippocampal neurons is a predicted consequence of the heterogeneous mobility reported here and short-ranged transport before exocytosis.
Cortical actin is not a major barrier to DCG transport and exocytosis in hippocampal neurons
The cytoplasmic face of the plasma membrane of eucaryotic cells, including hippocampal neurons, is surrounded by a mesh of actin filaments known as the actin cortex (Alberts et al., 2002; Furuyashiki et al., 2002). Here, we discuss what our data imply about interactions between the cortex and DCGs in hippocampal neurons.
We have used TIRFM movies to assay the effects of the actin cortex on DCGs in resting hippocampal neurons. In these movies, we clearly are visualizing DCGs that are extremely close to the membrane, because we can observe exocytosis (Fig. 8A). More importantly, in these movies, most visible DCGs are within ∼270 nm of the plasma membrane, and they thus reside within the ∼315 nm depth of the actin cortex. Given this, we expect to observe immobility of most DCGs in our TIRFM movies if the cortex tethers DCGs for long times or acts as a major barrier to DCGs (Steyer and Almers, 1999; Johns et al., 2001). In contrast, we expect to observe extensive motion that is somewhat slowed if the cortex acts primarily to increase viscosity (Luby-Phelps et al., 1987; Kao et al., 1993). Finally, we expect to observe transport that is at least partially rapid and directed if the cortex acts as a track for myosin-based motors (for review, see Langford, 2002).
Although the actin cortex traditionally has been viewed as a major barrier to DCGs in resting cells (Trifaro et al., 2000), our TIRFM data demonstrate that this is not the case for hippocampal neurons. Membrane-proximal DCGs in hippocampal neurons move readily to and from the plasma membrane (as demonstrated by their markedly flickering intensities in TIRFM movies), revealing that they readily penetrate the actin cortex. Mobility of membrane-proximal DCGs in hippocampal neurons could be facilitated by remodeling (depolymerization) or mobility of actin filaments, heterogeneity in the structure of the cortex, or the relatively small size of neuronal DCGs compared with chromaffin DCGs (Plattner et al., 1997; Chuang et al., 1999; Loerke et al., 2002). In contrast, with rare exceptions (Oheim et al., 1999), most TIRFM data suggest that the actin cortex is a major barrier to DCGs in chromaffin cells and PC12 cells, revealing that essentially all membrane-proximal DCGs in resting chromaffin cells and PC12 cells are nearly immobile (Oheim et al., 1998; Steyer and Almers, 1999; Johns et al., 2001; Tsuboi et al., 2001; Desnos et al., 2003).
Past TIRFM studies in neuroendocrine cells have failed to detect any significant population of membrane-proximal DCGs undergoing rapid, directed motion (Oheim et al., 1998, 1999; Han et al., 1999b; Steyer and Almers, 1999; Johns et al., 2001; Desnos et al., 2003). In contrast, we find a relatively large, fast-moving population in hippocampal neurons. Fast, directed motion of membrane-proximal DCGs in hippocampal neurons could be either actin filament and/or microtubule based; however, it is likely to be at least partially actin based, given the prevalence of actin beneath the plasma membrane, the persistence of some fast motion after extensive microtubule disruption, and the apparent presence of myosin-based motors on DCGs (at least in neuroendocrine cells) (Desnos et al., 2003; Rose et al., 2003).
DCG transport near sites of exocytosis differs markedly in neuroendocrine cells and hippocampal neurons
Two neuroendocrine systems have figured prominently in past studies of DCG transport. The first system is the growth cone of the PC12 cell, which is a site of slow and limited release of regulated secretory proteins (Burke et al., 1997; Abney et al., 1999; Han et al., 1999b). Here, we compare our data mostly with data obtained from PC12 cells, especially their growth cones.
Comparison reveals that there is a lot of fast, directed DCG motion in growth cones and near the plasma membrane of hippocampal neurons, whereas in PC12 cells, there is not (Burke et al., 1997; Abney et al., 1999; Han et al., 1999b; Ng et al., 2003). Thus, DCG transport in these domains of hippocampal neurons is characterized in part by a velocity histogram that has no analog in PC12 cells, underscoring a fundamental difference in DCG transport in these cell types.
Comparison also shows that there is slow, diffusive DCG motion in both hippocampal neurons and PC12 cells. Quantitative comparison of diffusion coefficients measured in these different cell types is complicated by the use of short- and longer-ranged diffusion coefficients in different studies (Desnos et al., 2003; Ng et al., 2003). With this caveat, diffusion histograms obtained for hippocampal neurons and PC12 cells share two interesting characteristics. Both histograms are broad, and neither histogram shows evidence of a separate “immobile” fraction (i.e., of a separate histogram peak at small D) (Ng et al., 2003). However, there also are significant differences in diffusion coefficients obtained for DCGs in hippocampal neurons and PC12 cells. For example, the TIRFM histogram for neurons includes much larger diffusion coefficients. Consistently, the average, longer-ranged lateral diffusion coefficient of membrane-proximal DCGs is ∼17-fold larger in hippocampal neurons than in PC12 cells (Desnos et al., 2003). Thus, despite some similarities, transport of DCGs in hippocampal neurons and PC12 cells differs both qualitatively and quantitatively.
Interestingly, the mean D of DCGs in PC12 cells depolarized with barium is increased fourfold relative to resting PC12 cells (Ng et al., 2002). Thus, in barium-stimulated PC12 cells, the average D is more like that in resting hippocampal neurons.
The second system is the chromaffin cell. In chromaffin cells, the great majority of membrane-proximal DCGs are laterally immobile, and axial mobility also is highly restricted (Oheim et al., 1998; Johns et al., 2001), unlike in hippocampal neurons. Moreover, in chromaffin cells, mobile membrane-proximal DCGs almost exclusively undergo very slow, random transport, unlike in hippocampal neurons.
Conclusions
We have demonstrated that short-ranged transport of DCGs near sites of exocytosis in growth cones, neurites, and the soma of hippocampal neurons is in large part fast and nonrandom and that DCG exocytosis is preceded by substantial lateral and axial movement. This movement may facilitate delivery of DCG cargo in hippocampal neurons, given the relatively low abundance of neuronal DCGs. We also have demonstrated that release of the regulated secretory protein tPA-EGFP from hippocampal neurons is slow and limited in extent and that the immobile (or very highly hindered) fraction of DCGs in growth cones and near the plasma membrane of hippocampal neurons is relatively small. This latter result demonstrates that cortical actin is not a major barrier to the transport and exocytosis of DCGs in hippocampal neurons, as postulated for neuroendocrine cells. Instead, our results suggest that extended release of DCG cargo in hippocampal neurons arises from a broad range of DCG mobilities.
Footnotes
This work was supported by National Institutes of Health Grants 1-R15-GM61539-01 (B.A.S.), MH66179 (Dr. Gary Banker, Oregon Health Sciences University, Portland, OR), 1-R15-NS40425-01 (J.E.L.), and 1-R15-NS048047-01 (M.A.S.). We thank the Banker laboratory for extensive support with the culture of hippocampal neurons. We also thank Dr. James Abney for a critical reading of this manuscript and Dr. Daniel Axelrod for many useful discussions. This paper is dedicated to the memory of Dr. Richard Scalettar.
Correspondence should be addressed to Dr. Bethe A. Scalettar, Department of Physics, Lewis and Clark College, Portland, OR 97219. E-mail: bethe@lclark.edu.
Copyright © 2005 Society for Neuroscience 0270-6474/05/253095-12$15.00/0
References
- Abney JR, Meliza CD, Cutler B, Kingma M, Lochner JE, Scalettar BA (1999) Real-time imaging of the dynamics of secretory granules in growth cones. Biophys J 77: 2887-2895. [DOI] [PMC free article] [PubMed] [Google Scholar]
- Alberts B, Johnson A, Lewis J, Raff M, Roberts K, Walter P (2002) Molecular biology of the cell. New York: Garland Science.
- Allison DW, Gelfand VI, Spector I, Craig AM (1998) Role of actin in anchoring postsynaptic receptors in cultured hippocampal neurons: differential attachment of NMDA versus AMPA receptors. J Neurosci 18: 2423-2436. [DOI] [PMC free article] [PubMed] [Google Scholar]
- Allison DW, Chervin AS, Gelfand VI, Craig AM (2000) Postsynaptic scaffolds of excitatory and inhibitory synapses in hippocampal neurons: maintenance of core components independent of actin filaments and microtubules. J Neurosci 20: 4545-4554. [DOI] [PMC free article] [PubMed] [Google Scholar]
- Axelrod D (2003) Total internal reflection fluorescence microscopy in cell biology. Methods Enzymol 361: 1-33. [DOI] [PubMed] [Google Scholar]
- Baranes D, Lederfein D, Huang YY, Chen M, Bailey CH, Kandel ER (1998) Tissue plasminogen activator contributes to the late phase of LTP and to synaptic growth in the hippocampal mossy fiber pathway. Neuron 21: 813-825. [DOI] [PubMed] [Google Scholar]
- Bean AJ, Zhang X, Hokfelt T (1994) Peptide secretion: what do we know? FASEB J 8: 630-638. [DOI] [PubMed] [Google Scholar]
- Beaumont V (2003) Visualizing membrane trafficking using total internal reflection fluorescence microscopy. Biochem Soc Trans 31: 819-823. [DOI] [PubMed] [Google Scholar]
- Berg H (1983) Random walks in biology. Princeton, NJ: Princeton UP.
- Bradke F, Dotti CG (1999) The role of local actin instability in axon formation. Science 283: 1931-1934. [DOI] [PubMed] [Google Scholar]
- Burgoyne RD, Morgan A (2003) Secretory granule exocytosis. Physiol Rev 83: 581-632. [DOI] [PubMed] [Google Scholar]
- Burke NV, Han W, Li D, Takimoto K, Watkins SC, Levitan ES (1997) Neuronal peptide release is limited by secretory granule mobility. Neuron 19: 1095-1102. [DOI] [PubMed] [Google Scholar]
- Bustos R, Kolen ER, Braiterman L, Baines AJ, Gorelick FS, Hubbard AL (2001) Synapsin I is expressed in epithelial cells: localization to a unique trans-Golgi compartment. J Cell Sci 114: 3695-3704. [DOI] [PubMed] [Google Scholar]
- Ceccaldi PE, Grohovaz F, Benfenati F, Chieregatti E, Greengard P, Valtorta F (1995) Dephosphorylated synapsin I anchors synaptic vesicles to actin cytoskeleton: an analysis by videomicroscopy. J Cell Biol 128: 905-912. [DOI] [PMC free article] [PubMed] [Google Scholar]
- Chen ZL, Strickland S (1997) Neuronal death in the hippocampus is promoted by plasmin-catalyzed degradation of laminin. Cell 91: 917-925. [DOI] [PubMed] [Google Scholar]
- Chuang JZ, Milner TA, Zhu M, Sung CH (1999) A 29 kDa intracellular chloride channel p64H1 is associated with large dense-core vesicles in rat hippocampal neurons. J Neurosci 19: 2919-2928. [DOI] [PMC free article] [PubMed] [Google Scholar]
- Desnos C, Schonn JS, Huet S, Tran VS, El-Amraoui A, Raposo G, Fanget I, Chapuis C, Menasche G, de Saint Basile G, Petit C, Cribier S, Henry JP, Darchen F (2003) Rab27A and its effector MyRIP link secretory granules to F-actin and control their motion towards release sites. J Cell Biol 163: 559-570. [DOI] [PMC free article] [PubMed] [Google Scholar]
- Doussau F, Augustine GJ (2000) The actin cytoskeleton and neurotransmitter release: an overview. Biochimie 82: 353-363. [DOI] [PubMed] [Google Scholar]
- Farhadi HF, Mowla SJ, Petrecca K, Morris SJ, Seidah NG, Murphy RA (2000) Neurotrophin-3 sorts to the constitutive secretory pathway of hippocampal neurons and is diverted to the regulated secretory pathway by coexpression with brain-derived neurotrophic factor. J Neurosci 20: 4059-4068. [DOI] [PMC free article] [PubMed] [Google Scholar]
- Furuyashiki T, Arakawa Y, Takemoto-Kimura S, Bito H, Narumiya S (2002) Multiple spatiotemporal modes of actin reorganization by NMDA receptors and voltage-gated Ca2+ channels. Proc Natl Acad Sci USA 99: 14458-14463. [DOI] [PMC free article] [PubMed] [Google Scholar]
- Gartner A, Staiger V (2002) Neurotrophin secretion from hippocampal neurons evoked by long-term-potentiation-inducing electrical stimulation patterns. Proc Natl Acad Sci USA 99: 6386-6391. [DOI] [PMC free article] [PubMed] [Google Scholar]
- Goslin K, Banker G (1998) Rat hippocampal neurons in low-density culture. In: Culturing nerve cells, Ed 2 (Banker G, Goslin K, eds), pp 339-370. Cambridge, MA: Massachusetts Institute of Technology.
- Guillaud L, Setou M, Hirokawa N (2003) KIF17 dynamics and regulation of NR2B trafficking in hippocampal neurons. J Neurosci 23: 131-140. [DOI] [PMC free article] [PubMed] [Google Scholar]
- Han W, Li D, Stout AK, Takimoto K, Levitan ES (1999a) Ca2+-induced deprotonation of peptide hormones inside secretory vesicles in preparation for release. J Neurosci 19: 900-905. [DOI] [PMC free article] [PubMed] [Google Scholar]
- Han W, Ng YK, Axelrod D, Levitan ES (1999b) Neuropeptide release by efficient recruitment of diffusing cytoplasmic secretory vesicles. Proc Natl Acad Sci USA 96: 14577-14582. [DOI] [PMC free article] [PubMed] [Google Scholar]
- Hartmann M, Heumann R, Lessmann V (2001) Synaptic secretion of BDNF after high-frequency stimulation of glutamatergic synapses. EMBO J 20: 5887-5897. [DOI] [PMC free article] [PubMed] [Google Scholar]
- Haubensak W, Narz F, Heumann R, Lessmann V (1998) BDNF-GFP containing secretory granules are localized in the vicinity of synaptic junctions of cultured cortical neurons. J Cell Sci 111: 1483-1493. [DOI] [PubMed] [Google Scholar]
- Henkel AW, Simpson LL, Ridge RM, Betz WJ (1996) Synaptic vesicle movements monitored by fluorescence recovery after photobleaching in nerve terminals stained with FM1-43. J Neurosci 16: 3960-3967. [DOI] [PMC free article] [PubMed] [Google Scholar]
- Hiraoka Y, Swedlow JR, Paddy MR, Agard DA, Sedat JW (1991) Three-dimensional multiple-wavelength fluorescence microscopy for the structural analysis of biological phenomena. Semin Cell Biol 2: 153-165. [PubMed] [Google Scholar]
- Hirokawa N, Sobue K, Kanda K, Harada A, Yorifuji H (1989) The cytoskeletal architecture of the presynaptic terminal and molecular structure of synapsin 1. J Cell Biol 108: 111-126. [DOI] [PMC free article] [PubMed] [Google Scholar]
- Ho DY (1994) Amplicon-based herpes simplex virus vectors. Methods Cell Biol 43: 191-210. [DOI] [PubMed] [Google Scholar]
- Johns LM, Levitan ES, Shelden EA, Holz RW, Axelrod D (2001) Restriction of secretory granule motion near the plasma membrane of chromaffin cells. J Cell Biol 153: 177-190. [DOI] [PMC free article] [PubMed] [Google Scholar]
- Kaech S, Kim JB, Cariola M, Ralston E (1996) Improved lipid-mediated gene transfer into primary cultures of hippocampal neurons. Brain Res Mol Brain Res 35: 344-348. [DOI] [PubMed] [Google Scholar]
- Kao HP, Abney JR, Verkman AS (1993) Determinants of the translational mobility of a small solute in cell cytoplasm. J Cell Biol 120: 175-184. [DOI] [PMC free article] [PubMed] [Google Scholar]
- Kraszewski K, Daniell L, Mundigl O, De Camilli P (1996) Mobility of synaptic vesicles in nerve endings monitored by recovery from photobleaching of synaptic vesicle-associated fluorescence. J Neurosci 16: 5905-5913. [DOI] [PMC free article] [PubMed] [Google Scholar]
- Lang T, Wacker I, Steyer J, Kaether C, Wunderlich I, Soldati T, Gerdes HH, Almers W (1997) Ca2+-triggered peptide secretion in single cells imaged with green fluorescent protein and evanescent-wave microscopy. Neuron 18: 857-863. [DOI] [PubMed] [Google Scholar]
- Langford GM (2002) Myosin-V, a versatile motor for short-range vesicle transport. Traffic 3: 859-865. [DOI] [PubMed] [Google Scholar]
- Llopis J, McCaffery JM, Miyawaki A, Farquhar MG, Tsien RY (1998) Measurement of cytosolic, mitochondrial, and Golgi pH in single living cells with green fluorescent proteins. Proc Natl Acad Sci USA 95: 6803-6808. [DOI] [PMC free article] [PubMed] [Google Scholar]
- Lochner JE, Kingma M, Kuhn S, Meliza CD, Cutler B, Scalettar BA (1998) Real-time imaging of the axonal transport of granules containing a tissue plasminogen activator/green fluorescent protein hybrid. Mol Biol Cell 9: 2463-2476. [DOI] [PMC free article] [PubMed] [Google Scholar]
- Loerke D, Stuhmer W, Oheim M (2002) Quantifying axial secretory-granule motion with variable-angle evanescent-field excitation. J Neurosci Methods 119: 65-73. [DOI] [PubMed] [Google Scholar]
- Luby-Phelps K, Castle PE, Taylor DL, Lanni F (1987) Hindered diffusion of inert tracer particles in the cytoplasm of mouse 3T3 cells. Proc Natl Acad Sci USA 84: 4910-4913. [DOI] [PMC free article] [PubMed] [Google Scholar]
- Ng YK, Lu X, Levitan ES (2002) Physical mobilization of secretory vesicles facilitates neuropeptide release by nerve growth factor-differentiated PC12 cells. J Physiol (Lond) 542: 395-402. [DOI] [PMC free article] [PubMed] [Google Scholar]
- Ng YK, Lu X, Gulacsi A, Han W, Saxton MJ, Levitan ES (2003) Unexpected mobility variation among individual secretory vesicles produces an apparent refractory neuropeptide pool. Biophys J 84: 4127-4134. [DOI] [PMC free article] [PubMed] [Google Scholar]
- Ohara-Imaizumi M, Nakamichi Y, Tanaka T, Ishida H, Nagamatsu S (2002) Imaging exocytosis of single insulin secretory granules with evanescent wave microscopy: distinct behavior of granule motion in biphasic insulin release. J Biol Chem 277: 3805-3808. [DOI] [PubMed] [Google Scholar]
- Oheim M, Loerke D, Stuhmer W, Chow RH (1998) The last few milliseconds in the life of a secretory granule. Docking, dynamics and fusion visualized by total internal reflection fluorescence microscopy (TIRFM). Eur Biophys J 27: 83-98. [DOI] [PubMed] [Google Scholar]
- Oheim M, Loerke D, Stuhmer W, Chow RH (1999) Multiple stimulation-dependent processes regulate the size of the releasable pool of vesicles. Eur Biophys J 28: 91-101. [DOI] [PubMed] [Google Scholar]
- Ohki EC, Tilkins ML, Ciccarone VC, Price PJ (2001) Improving the transfection efficiency of post-mitotic neurons. J Neurosci Methods 112: 95-99. [DOI] [PubMed] [Google Scholar]
- Parsons TD, Coorssen JR, Horstmann H, Almers W (1995) Docked granules, the exocytic burst, and the need for ATP hydrolysis in endocrine cells. Neuron 15: 1085-1096. [DOI] [PubMed] [Google Scholar]
- Plattner H, Artalejo AR, Neher E (1997) Ultrastructural organization of bovine chromaffin cell cortex-analysis by cryofixation and morphometry of aspects pertinent to exocytosis. J Cell Biol 139: 1709-1717. [DOI] [PMC free article] [PubMed] [Google Scholar]
- Rosa P, Hille A, Lee RW, Zanini A, De Camilli P, Huttner WB (1985) Secretogranins I and II: two tyrosine-sulfated secretory proteins common to a variety of cells secreting peptides by the regulated pathway. J Cell Biol 101: 1999-2011. [DOI] [PMC free article] [PubMed] [Google Scholar]
- Rose SD, Lejen T, Casaletti L, Larson RE, Pene TD, Trifaro JM (2003) Myosins II and V in chromaffin cells: myosin V is a chromaffin vesicle molecular motor involved in secretion. J Neurochem 85: 287-298. [DOI] [PubMed] [Google Scholar]
- Rudolf R, Kogel T, Kuznetsov SA, Salm T, Schlicker O, Hellwig A, Hammer III JA, Gerdes HH (2003) Myosin Va facilitates the distribution of secretory granules in the F-actin rich cortex of PC12 cells. J Cell Sci 116: 1339-1348. [DOI] [PubMed] [Google Scholar]
- Saxton MJ, Jacobson K (1997) Single-particle tracking: applications to membrane dynamics. Annu Rev Biophys Biomol Struct 26: 373-399. [DOI] [PubMed] [Google Scholar]
- Scalettar BA, Swedlow JR, Sedat JW, Agard DA (1996) Dispersion, aberration and deconvolution in multi-wavelength fluorescence images. J Microsc 182: 50-60. [DOI] [PubMed] [Google Scholar]
- Scalettar BA, Rosa P, Taverna E, Francolini M, Tsuboi T, Terakawa S, Koizumi S, Roder J, Jeromin A (2002) Neuronal calcium sensor-1 binds to regulated secretory organelles and functions in basal and stimulated exocytosis in PC12 cells. J Cell Sci 115: 2399-2412. [DOI] [PubMed] [Google Scholar]
- Schmoranzer J, Goulian M, Axelrod D, Simon SM (2000) Imaging constitutive exocytosis with total internal reflection fluorescence microscopy. J Cell Biol 149: 23-32. [DOI] [PMC free article] [PubMed] [Google Scholar]
- Schwarzer C, Marksteiner J, Kroesen S, Kohl C, Sperk G, Winkler H (1997) Secretoneurin: a market in rat hippocampal pathways. J Comp Neurol 377: 29-40. [PubMed] [Google Scholar]
- Steyer JA, Almers W (1999) Tracking single secretory granules in live chromaffin cells by evanescent-field fluorescence microscopy. Biophys J 76: 2262-2271. [DOI] [PMC free article] [PubMed] [Google Scholar]
- Steyer JA, Horstmann H, Almers W (1997) Transport, docking and exocytosis of single secretory granules in live chromaffin cells. Nature 388: 474-478. [DOI] [PubMed] [Google Scholar]
- Taraska JW, Perrais D, Ohara-Imaizumi M, Nagamatsu S, Almers W (2003) Secretory granules are recaptured largely intact after stimulated exocytosis in cultured endocrine cells. Proc Natl Acad Sci USA 100: 2070-2075. [DOI] [PMC free article] [PubMed] [Google Scholar]
- Trifaro J, Rose SD, Lejen T, Elzagallaai A (2000) Two pathways control chromaffin cell cortical F-actin dynamics during exocytosis. Biochimie 82: 339-352. [DOI] [PubMed] [Google Scholar]
- Trifaro JM, Vitale ML (1993) Cytoskeleton dynamics during neurotransmitter release. Trends Neurosci 16: 466-472. [DOI] [PubMed] [Google Scholar]
- Tsuboi T, Kikuta T, Warashina A, Terakawa S (2001) Protein kinase C-dependent supply of secretory granules to the plasma membrane. Biochem Biophys Res Commun 282: 621-628. [DOI] [PubMed] [Google Scholar]