

Abstract
Naturalistic stimuli, reconstructed from measured eye movements of flying blowflies, were replayed on a panoramic stimulus device. The directional movement-sensitive H1 neuron was recorded from blowflies watching these stimuli. The response of the H1 neuron is dominated by the response to fast saccadic turns into one direction. The response between saccades is mostly inhibited by the front-to-back optic flow caused by the forward translation during flight. To unravel the functional significance of the H1 neuron, we replayed, in addition to the original behaviorally generated stimulus, two targeted stimulus modifications: (1) a stimulus in which flow resulting from translation was removed (this stimulus produced strong intersaccadic responses); and (2) a stimulus in which the saccades were removed by assuming that the head follows the smooth flight trajectory (this stimulus produced alternating zero or nearly saturating spike rates). The responses to the two modified stimuli are strongly different from the response to the original stimulus, showing the importance of translation and saccades for the H1 response to natural optic flow. The response to the original stimulus thus suggests a double function for the H1 neuron, assisting two major classes of movement-sensitive output neurons targeted by H1. First, its strong response to saccades may function as a saccadic suppressor (via one of its target neurons) for cells involved in figure-ground discrimination. Second, its intersaccadic response may increase the signal-to-noise ratio (SNR) of wide-field neurons involved in detecting translational optic flow between saccades, in particular when flying speeds are low or when object distances are large.
Keywords: natural stimuli, movement detection, spike coding, optic flow, eye movements, saccadic suppression
Introduction
Blowflies are agile flyers and strongly depend on vision during flight (Egelhaaf and Kern, 2002). The optic flow field, the pattern of local motions as perceived in the visual surround, is analyzed by specialized neurons in the brain of the fly. Most prominent is a set of ∼60 identified neurons called tangential cells, each present in the third visual neuropil of the left and right eyes. A subset of these neurons is thought to be involved in using the optic flow to estimate the parameters of self-motion, such as yaw (rotation around a vertical axis), roll (rotation around a longitudinal axis), and sideward translation (for review, see Hausen, 1981; Hausen and Egelhaaf, 1989; Krapp et al., 2001). Other neurons are thought to be involved in analyzing the content of the visual scene itself, for example, to separate figure from ground using motion parallax (Egelhaaf, 1985; Kimmerle and Egelhaaf, 2000).
Most of the visual motion perceived by the eye is generated by the movements of the animal itself during flight. These movements appear to be tuned to generate optic flow in a form that makes it easy for the visual system to process the visual information in a robust way. During flight, the considerable roll of the thorax, necessary for turning, is counteracted by a compensating roll of the head, thus stabilizing the visual image (Hengstenberg, 1992; Schilstra and van Hateren, 1998). Changes in yaw are not performed gradually but rather in a step-like manner (Wagner, 1986). The thorax and head perform a series of saccadic changes in yaw, with a quite stable orientation of the head between saccades (van Hateren and Schilstra, 1999).
Recently, it has become possible to measure and reconstruct the stimuli as perceived by flying blowflies and to present such stimuli on a panoramic visual stimulator to study the performance of motion-sensitive cells (van Hateren and Schilstra, 1999; Lindemann et al., 2003). Here, we use such stimuli to study the performance of the H1 neuron in the blowfly third visual neuropil. This neuron has been used for quite some time as a testing bed for studying both motion processing (Harris et al., 2000) and, more generally, coding in spike trains (Bialek et al., 1991; Haag and Borst, 1997; Warzecha et al., 2000). It is therefore interesting and important to use the newly available naturalistic stimuli to investigate function and coding in this neuron.
We found that the H1 response to natural optic flow is dominated by two stimulus characteristics that were not considered in previous studies of H1. First, the forward translation during flight suppresses H1 for much of the time between saccades, and second, saccadic gaze shifts produce, contrary to previous assumptions, the dominant response in H1. We studied the impact of the presence or the absence of these stimulus characteristics by constructing stimuli lacking either translation or saccades. Finally, we discuss the potential function of H1 in view of these new findings.
Materials and Methods
Flight recording and stimulus reconstruction. Position and orientation of the head were recorded from blowflies (Calliphora vicina) flying in a cubic cage with edges of 40 cm (Schilstra and van Hateren, 1999). Recording was performed by measuring the voltages induced by externally generated magnetic fields in tiny search coils attached to the head (van Hateren and Schilstra, 1999). Resolution of the measurement was 1 ms, 0.3°, and 1 mm. The walls of the cage were covered with images of herbage. Because the compound eye forms an integral part of the head, we could use the head trajectory to reconstruct the visual stimulus as a function of space and time, as encountered by the fly during its flight (Lindemann et al., 2003). If not stated otherwise, for the present measurements on the H1 neuron, we used three different flights each of 3.45 s in length and each obtained from a different fly. For each of the stimulus movies resulting from these flights, we constructed two variants by targeted modifications of the original movies. The variant “without translation” was made by using the angular movements (yaw, roll, and pitch) measured during the flight, whereas the position of the (virtual) fly was fixed to the center of the cage. The variant “without saccades” was made by using the instantaneous direction of the tangent of the horizontally projected flight path as the current yaw direction. Thus, seen from above, the fly always looks into the direction where it is flying. Note that this is not simply the direction into which the thorax is pointing, because the thorax is often at an angle with the flight path (similarly to the head) (Fig. 1 A) (see Results for additional discussion). For this movie, the roll was fixed to zero, and the pitch was fixed to the average pitch measured for that particular movie. Position coordinates, and thus translation, were the same as in the original movie.
Figure 1.
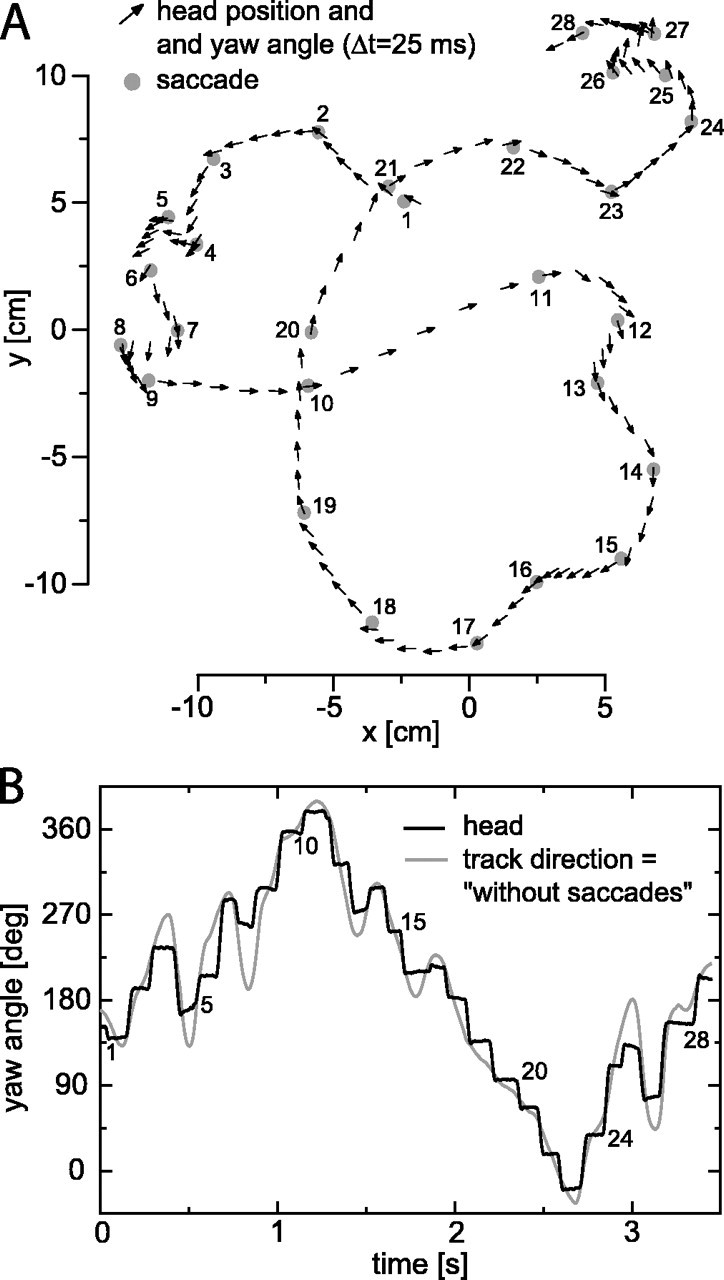
Flight trajectory and yaw angles. A, Horizontal projection of a flight trajectory with head position (arrow bases) and head yaw (arrow direction) shown every 25 ms. The gray dots mark the midpoints of saccades, which are numbered for the purpose of reference. The flight arena is a cage with dimensions of 40 × 40 × 40 cm3, with images of herbage covering the walls. The position of the walls is at x, y = -20, +20 cm. The total length of a typical blowfly is ∼1 cm, ∼50% longer than the arrows shown in the figure. B, Black line, Head yaw angle (rotation around its vertical axis) for the flight shown in A; gray line, track direction (tangent of path projected on a horizontal plane) for the flight shown in A. The yaw defined by the track direction, combined with zero roll, fixed pitch, and original x, y, z coordinates, yields the without-saccades stimulus variant.
Stimulus presentation. Stimuli were presented on a specially built, panoramic stimulus device [FliMax (Lindemann et al., 2003)] consisting of >7000 light-emitting diodes (LEDs) covering most of the visual field of the blowfly's eyes. For details on how the stimulus was adapted to the device, see the study by Lindemann et al. (2003). Here, we will only draw attention to the temporal anti-aliasing we used, because it is important for the present study. Without it, turns and saccades (reaching velocities of up to 3000°/s) produce spatiotemporal aliasing. Aliasing would arise despite the fact that the frame rate of the FliMax, 370 frames per second (fps), is fast enough to avoid flicker in the photoreceptors of the fly. A speed of 3000°/s implies an image shift per frame of 3000/370 = 8.1°, which is several times the interommatidial angle Δϕ = 1.5° of Calliphora. The interommatidial angle is the angle between neighboring sampling directions and is considered the main sampling base of the inputs of the elementary movement detectors (Buchner, 1976; Schuling et al., 1989). Thus, a shift larger than the interommatidial angle will not effectively stimulate the movement sensitive-neurons, because it artificially jumps past ommatidia; this would never happen during a real physical movement. We solved this problem by computing the movie at six times the FliMax rate, 2220 fps, using the positional and orientational coordinates of the flight path, upsampled to 2220 Hz from the measured 1000 Hz rate, using linear interpolation. We subsequently block-averaged groups of six consecutive frames into the frames to be presented on FliMax at 370 fps (Lindemann et al., 2003). This procedure simulates the temporal integration performed in 1/370 s by the photoreceptors of the fly that was originally confronted with the real physical stimulus in the cage. As a control, we performed simulations by presenting a modeled representation of the actual FliMax stimulus (with discrete LEDs and the actually used frame rate) to a model of the first stages of the blowfly visual system [photoreceptors according to the model by van Hateren and Snippe (2001), combined with a provisional model for the large monopolar cells]. From the simulated responses, we found that the 2220 fps was sufficiently fast to reduce the spatiotemporal aliasing to a negligible level. This result is corroborated by the fact that we measure clear directionally sensitive responses even to the fastest saccades (Figs. 2, 3).
Figure 2.

Responses to the original and two stimulus variants. A, Yaw velocity of the head (rotation velocity around a vertical axis through the head) for the original and without-translation stimuli (black line) and for the without-saccades stimulus (gray line). Positive yaw velocities denote leftward saccades or leftward turns. B, Response to the original stimulus of the left eye H1 neuron (black line, upward pointing histogram) and of the right eye H1 neuron (gray line, downward pointing histogram); the response of the left eye H1 was measured directly, and its response to an appropriately mirrored version of the movie provided an approximation of the response of the right eye H1 (average of 78 stimulus repeats; bin width, 2 ms). C, As in B, for the without-translation stimulus. This stimulus has the same yaw, pitch, and roll as the original, but position is fixed to the center of the cage. D, As in B, for the without-saccades stimulus, with yaw as shown in Figure 1 B (gray line). deg/s, Degrees per second; sp/s, spikes per second.
Figure 3.

Responses to the original and two stimulus variants (detail). A, Yaw velocity. B, Response to the original stimulus (upward histogram, left eye H1; downward histogram, right eye H1). C, Response to the without-translation stimulus. D, Response to the without-saccades stimulus. deg/s, Degrees per second; sp/s, spikes per second.
Recording. Extracellular recording from H1 neurons in 3- to 6-d-old female Calliphora vicina was performed using standard procedures (Warzecha et al., 2000). Stability of the recordings was checked by inspecting the responses to control stimuli (conventional moving bar patterns) inserted at regular intervals in the stimulus protocol. The results on H1 presented here are based on the recordings from six animals, all producing similar results. The results on HSE and CH presented in Figure 8 were obtained by intracellular recording using standard methods (Warzecha et al., 1993) and are based on recordings from 13 cells in 1- to 2-d-old female animals. The temperature close to the head of the fly in all experiments was ∼30°C.
Figure 8.

Saccade-triggered averages of H1 and the HSE and VCH cells targeted by H1. Saccade-triggered averages were obtained by finding the velocity peak of either leftward or rightward saccades and subsequently averaging responses from 50 ms before until 50 ms after that time. Responses were all shifted 22.5 ms to the left to account for the approximate latency of the cells. The traces in the graphs are averages of responses to two to six repeats of 1-10 different movies of six H1 cells, nine HSE cells, and four VCH cells. Responses from all cells of a particular type were similar.
Coherence calculation. Coherence between stimulus and response was calculated as γ2b(ω) = |Psr(ω)|2/[Pss(ω)Prr(ω)] (Theunissen et al., 1996; Haag and Borst, 1998; van Hateren and Snippe, 2001), with Psr as the cross spectral density of stimulus and response, Pss as the power spectral density of the stimulus, Prr as that of the response, and ω = 2πf, with f frequency. The response was represented by an array (at a resolution of 0.25 ms) filled with zeros and ones, with a one representing the presence of a spike [see the study by van Hateren et al. (2002), their Materials and Methods, for a discussion of using coherence for unfiltered spike trains). Spectra were calculated by periodogram averaging of 50% overlapping data segments, with each periodogram the discrete Fourier transform of a cos2-tapered zero-mean data segment of 256 ms, extended by zero-padding to 512 ms. Results were not strongly dependent on segment length. Before segmentation, the response was aligned with the stimulus by shifting it 22.5 ms backwards in time, the approximate latency under the experimental conditions. Results were not strongly dependent on shift size. Segments from all flights (1-3) used as a stimulus for a particular cell were included in the periodogram averaging. Bias in the coherence estimate of each stimulus repetition was corrected by γ2 = n/(n - 1)γ2b -1/(n - 1) (van Hateren and Snippe, 2001; van Hateren et al., 2002), with n as the number of segments (n = 25-75 for the one to three flights of the present experiments). Coherences were finally averaged over all stimulus repetitions.
We investigated the coherence of the response with a range of stimulus parameters and found that only yaw velocity and sideward velocity gave significant coherences. The yaw velocity of the head is the instantaneous angular velocity around a vertical axis through the head and is obtained from the differential rotation matrix in the coordinate system of the head (Schilstra and van Hateren, 1999; van Hateren and Schilstra, 1999). The sideward velocity of the head is the velocity component along a transverse axis through the head. Coherence of the response with these two parameters of the stimulus was obtained by first conditioning the second parameter with the first (Bendat and Piersol, 2000), i.e., s′2(ω) = s2(ω) - [P21(ω)/P11(ω)]s1(ω), with s1(ω) the first parameter (here, the Fourier transform of the yaw velocity), and s2(ω) and s′2(ω) the original and conditioned second parameter (here, the Fourier transform of the sideward velocity), respectively; P21 and P11 are cross and power spectra of the second and first parameter. Conditioning removes from s2 the second-order statistical dependence with s1. We found that the order of evaluating these parameters does not significantly affect the coherences of each parameter (i.e., the coherences are similar when the sideward velocity is used for s1, and the yaw velocity for s2).
The method described above gives coherences for the entire response. These coherences are strongly dominated by the saccades, because the response and the yaw are much larger during saccades than between saccades. To focus on the stimulus-response relationship between saccades, we constructed masks m(t) for masking (i.e., zeroing) the saccadic part of the stimulus and response. We then calculated the coherence between masked stimulus m(t)s(t) and masked response m(t)r(t), rather than between the stimulus s(t) and response r(t) as above. Masks selecting intersaccadic segments were obtained by first constructing masks ms(t) selecting saccades. A mask ms(t) was obtained by giving it a value of 1 in a region surrounding each saccade and 0 elsewhere. Saccades were detected from peaks (≥500°/s) in the total angular velocity of the head. The saccadic regions were made large enough to include all parts of both saccadic stimulus and corresponding response. Regions of saccades that were close together were merged to reduce boundary effects. Edges of the masks were tapered with a 12.5 ms cos2 taper to reduce spectral leakage biasing the coherence estimate at high frequencies. The mask used for selecting the intersaccadic segments, m(t), is then defined as m(t) = 1 - ms(t). For the flight of Figure 1 A, m(t) is illustrated in the trace below Figure 2 A. Masked data consisted of gated (transmitted) data intermitted with blocks of zeroes. Although the mask shapes the power and cross spectra of the masked data, this occurs in a similar way for all spectra in the numerator and denominator of the definition of coherence. Consequently, the mask by itself does not generate coherence for uncorrelated data, as was checked in control computations with uncorrelated noise. The coherence of masked data include the zero blocks, however, and therefore should be regarded as belonging to the entire masked signal and not just to its intersaccadic part.
The masks are not used only for the coherence analysis but also for selecting the intersaccadic stimulus and response sections for Figure 4C-E. For that purpose, the intersaccadic sections are defined by m(t) ≥ 0.5.
Figure 4.

Difference spike rate as a function of stimulus parameters. A, Difference spike rate as a function of saccade size (original stimulus). Saccade size was obtained from the difference in yaw angle of the start and the end of each saccadic interval (see mask below Fig. 2 A), and the difference spike rate (difference between spike rates in the left eye and right eye H1 neurons) was averaged over this interval. Different symbols represent saccades for three different H1 neurons of similar average spike rate. B, Difference spike rate as a function of peak saccadic velocity (original stimulus). C, Difference spike rate as a function of the yaw velocity averaged over each intersaccadic section (original stimulus). D, Difference spike rate as a function of sideward velocity averaged over each intersaccadic section (original stimulus). E, Difference spike rate as a function of the yaw velocity averaged over each intersaccadic section (without-translation stimulus). F, Difference spike rate as a function of the yaw velocity averaged over consecutive 50 ms intervals (without-saccades stimulus). deg/s, Degrees per second.
Calculation of information rates. Information rates were calculated closely following the procedure of Strong et al. (1998). In this method, the spike train is considered to consist of “words” containing zeros and ones, with the latter denoting the times of spike occurrence. How many different words exist in the entire spike train is related to its total entropy, whereas the number of different words in response to a specific section of the stimulus is related to the noise entropy of the spike train. For a given bin size (typically 3 ms) and word length (varied between 4 and 30), we calculated the total and noise entropy for different partition sizes, s, of the data set and fitted the resulting entropy rate with a polynomial in 1/s: H0 + H1/s + H2/s2. H0 was then taken as the entropy rate extrapolated to infinite data size. The extrapolated entropy rate as a function of inverse word length was subsequently linearly extrapolated to infinite word length. The difference between the estimated total and noise entropy rate yielded the information rate. For additional details on the method, see the study by Strong et al. (1998).
Results
Here, we describe the properties of the flights used as a stimulus and how we modified this stimulus to remove particular aspects of the generated optic flow. The responses to the original and two modified stimuli are subsequently analyzed in detail and compared. Finally, we present two additional experiments that provide important clues for interpreting the function of H1 under conditions of natural optic flow.
Original stimulus and modifications
Stimuli used in this article were reconstructed from measured head movements of blowflies flying in a cage (van Hateren and Schilstra, 1999). Figure 1A shows, at a resolution of 25 ms, an example of head position (arrow base) and head yaw (arrow direction) of one of the flights used here. Only the coordinates in a horizontal plane, x and y, are shown; the vertical coordinate, z, varied only moderately during this flight. During the flight, the angular motions of the head are dominated by rotations around its vertical axis (yaw, i.e., left-right rotation), whereas the rotations around its transverse axis (pitch, up-down rotation) and longitudinal axis (roll) are quite small (van Hateren and Schilstra, 1999). As shown from the arrow directions, the yaw tends to be constant during short stretches and then changes abruptly. Figure 1B (black trace) shows this again for the same flight at a higher resolution. The yaw changes in a stepwise manner, with high-speed changes (saccades) alternated with sections of more constant yaw. The saccades of the head partly consist of the saccades of the thorax, in which the latter reflect the normal, angular flight behavior of the larger blowflies (Wagner, 1986). Because of additional neck movements, the head yaw is in fact a sharpened version of the thorax yaw; the head saccades are somewhat faster and shorter than the thorax saccades and, in particular, the angular stability of the head between saccades is higher than that of the thorax (Schilstra and van Hateren, 1998). The midpoints of the saccades are marked by gray dots in Figure 1A, and the saccades are numbered for aiding the description of the stimulus and response below. Note that the head, like the thorax (Schilstra and van Hateren, 1999), often points in a direction away from the direction of the flight path. The consequence of this misalignment is that the visual system occasionally experiences considerable sideward optic flow resulting from sideward translation.
Below, we show that the saccades strongly determine the response of the H1 neuron. To investigate the consequences of the presence or absence of saccades in a stimulus, we constructed a without-saccades stimulus variant. The gray line in Figure 1B shows the corresponding yaw, which is taken as the instantaneous track direction (the tangent to the flight path as projected on a horizontal plane). It thus corresponds to the direction of the line that could be drawn through the arrow bases in Figure 1A. It is a type of stimulus that has been used in a previous study of H1 responses to naturalistic stimuli (Lewen et al., 2001) [using data from the study by Land and Collett (1974)], and it can be constructed from flight paths obtained with techniques that do not provide information on head orientation. As shown in Fig. 1B, the yaw constructed in this way corresponds only approximately to the actual yaw of the head. Whereas the gaze between saccades is generally quite straight, the flight path between saccades is often somewhat curved (e.g., between saccades 18 and 19). Large curves in the flight path (turns) can correspond to a single saccade but also to a series of saccades in a row (e.g., between saccades 14 and 16 and between 18 and 21).
Because the H1 neuron is excited by back-to-front motion and inhibited by front-to-back motion, it is strongly responsive to rotations of the animal around a vertical axis (yaw), and H1 is therefore traditionally considered a detector of yaw velocity. Below, we show that not only rotational flow but also translational flow has a strong impact on the response of H1. Translational flow is optic flow generated by the apparent motion of nearby objects and walls during translation of the animal. To investigate the consequences of the presence or absence of translational flow in a stimulus, we constructed the without-translation stimulus. In this stimulus, the (virtual) fly performs all measured rotational movements but has its position fixed to the center of the cage. This movie therefore only produces flow because of rotation, whereas flow resulting from translation is completely absent.
Figures 2A (entire movie) and 3A (detail) show the yaw velocities associated with the changes in yaw shown in Figure 1B. Positive yaw velocities denote a head rotation to the left, producing an effective optic flow from back to front for the left eye, which is an excitatory flow for the left eye H1 neuron. The black trace is the yaw velocity belonging to the original stimulus and the without-translation variant, and the gray trace is the yaw velocity belonging to the without-saccades variant. Yaw velocities during saccades (peaks in the black trace; numbered according to the numbering in Fig. 1A) are high, up to a few thousand degrees per second, whereas the yaw velocities between saccades are much lower, typically <100-200°/s (Figs. 2A, 3A) [see the study by van Hateren and Schilstra (1999), their Fig. 6A,B, for probability density functions of the yaw velocities during and between saccades for a large number of flights]. In contrast, the yaw velocity belonging to the without-saccades variant (Figs. 2A, 3A, gray traces) is intermediate between these extremes. Whereas the yaw velocity of this variant is occasionally quite low or quite high, it is at values of a few hundred degrees per second for most of the time.
Figure 6.
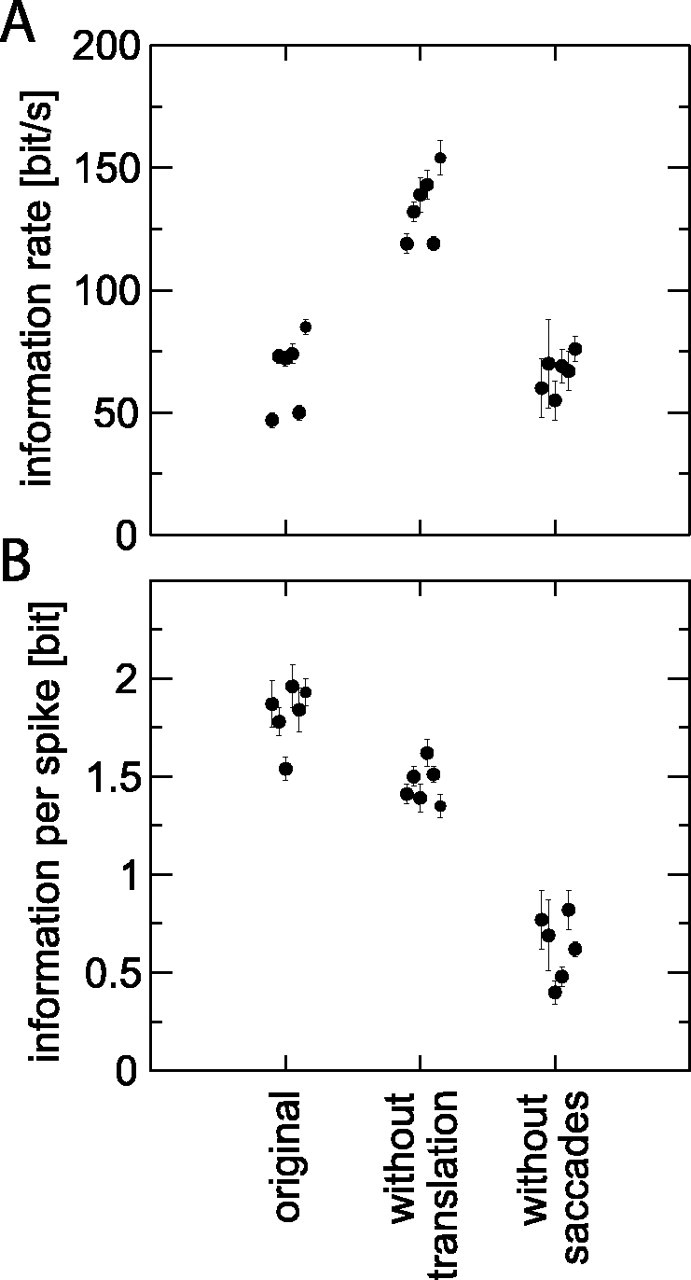
Information rates (A) and information per spike (B) for the original and two stimulus variants. The six points (±estimate of extrapolation error) at each condition are, from left to right, computed for movie 1 presented to H1 neuron 1 (60 stimulus repeats), movie 2 to neuron 1 (60 repeats), movie 3 to neuron 2 (78 repeats), movie 4 to neuron 2 (78 repeats), movie 3 to neuron 3 (320 repeats), and movie 3 to neuron 4 (320 repeats).
General response characteristics
Figures 2B (entire movie) and 3B (detail) show the response to the original stimulus of the H1 neurons of the left and right eyes as upward pointing and downward pointing spike rates, respectively. The response of the left eye H1 was measured directly and also provided an approximation of the response of the right eye H1 by its response to properly mirrored versions of the movies. Because H1 is inhibited by front-to-back motion of the stimulus, as encountered during normal forward flight, both the left and right eye H1 cells typically show a low firing rate between saccades. There is a strong response only during saccades producing back-to-front motion in the receptive fields of the two H1 neurons [i.e., leftward saccades for the left eye H1 (Fig. 2B, black curve) and rightward saccades for the right eye H1 (gray curve)]. Occasionally, there are also significant spike rates between saccades, which is partly related to sideward translation of the fly. For example, the moderately high spike rates of the left H1 (Fig. 2B, black line) between saccades 3 and 4, 5 and 6, and 25 and 26 are related to leftward translation (see the motion between corresponding saccades in Fig. 1A), whereas the spike rates of the right H1 (Fig. 2B, gray line) between saccades 4 and 5, 7 and 8, and 26 and 27 are related to rightward translation (Fig. 1A).
In contrast to the original stimulus, the without-translation variant (Figs. 2C, 3C) produces considerably more response to the stimulus sections between the saccades. As shown in the coherence analysis below, this response is closely related to the relatively small yaw rotations that the head makes between saccades (Figs. 2A, 3A). Yaw rotations are able to produce responses here, because the continuous suppression of both H1 neurons by front-to-back optic flow, as generated by forward translation of the animal, is absent in this stimulus. The saccades are clearly represented in the response to this stimulus as well. Note that this stimulus variant yields a response that is strongly different from the one to the original stimulus. Because the only difference between the two stimuli is the presence or absence of translational flow, it is clear that translational flow is an important determinant of the H1 response.
Comparing the response to the without-saccades variant (Figs. 2D, 3D) with that to the original stimulus shows the dramatic consequences of the fact that the fly's head follows a saccadic gaze strategy. The yaw velocity of the without-saccades variant (Figs. 2A, 3A, gray lines) is, most of the time, high enough (a few hundred degrees per second) to drive the H1 neuron into long sections of high spike rates. This is only possible because the optic flow resulting from forward translation is not large enough to nullify the considerable optic flow caused by the yaw rotations in this stimulus.
Scatter diagrams of stimulus and response
We can obtain more insight into which aspects of the stimulus variants determine the responses of H1 by plotting spike rate versus various stimulus parameters (Fig. 4). To reduce the non-linearity attributable to the fact that a single H1 cell is suppressed by movement in its null (antipreferred) direction, we focus on the difference of the responses from left and right H1 (Bialek et al., 1991), referred to as “difference response” or “difference spike rate” below. Because, for the original movies, H1 responds mainly to the saccades, we first investigated whether the spike rate in response to a saccade indicates the size of that saccade. Figure 4A shows the results from three cells (different symbols) of similar average spike rate, in which the black symbols are dominated by the responses of the left eye H1 to leftward saccades (Fig. 2B, black trace), and the gray symbols are dominated by the responses of the right eye H1 to rightward saccades (Fig. 2B, gray trace). The large scatter of the data in combination with the rather flat response curve for saccades >10-20° make the spike rate a fairly poor indicator of saccade size, with the exception of the smallest saccades.
Similarly, Figure 4B shows that the difference spike rate is only a poor predictor of the peak saccade velocity (i.e., peaks of the yaw velocity as shown in Figs. 2A and 3A). Although the correlation coefficient is r = 0.94 for the data points in the figure, this correlation is mainly a result of the fact that the data points cluster into two groups: the sign of a saccade is well predicted by the sign of the corresponding difference response. The clusters of black and gray data points separately produce a weak r = 0.50 and r = 0.41, respectively. Indeed, for a given response of, for example, 100 spikes/s, the saccadic velocity is not too well defined, and it could be anywhere between a few hundred and a few thousand degrees per second.
Although the stimulus and response are both dominated by the saccades (Fig. 2A,B), this does not rule out that the intersaccadic response (i.e., the response between saccades) carries significant information on the intersaccadic stimulus. We separated saccadic and intersaccadic sections by constructing masks like the one shown in the trace below Figure 2A (see Materials and Methods). The masks switch between 0 and 1, denoting saccadic and intersaccadic sections, respectively. Figure 4C shows, for the original stimulus, the difference spike rate versus the yaw velocity, both averaged over each intersaccadic section. Correlation is negligible (r = 0.005). Note that the average intersaccadic yaw velocity is typically <100°/s. At a finer time scale, yaw velocities between saccades can be transiently higher, but they generally remain <200°/s (van Hateren and Schilstra, 1999).
Whereas the average intersaccadic yaw velocity is not correlated with the difference spike rate, this is not true for the sideward velocity, again averaged over each intersaccadic section (Fig. 4D, r = 0.65). The correlation is only moderate, but it is nevertheless the reflection of the fact that, as noted above, significant intersaccadic spike rates (as in Fig. 2B) can often be traced back to sections in which sideward translation dominates (Fig. 1A).
The intersaccadic yaw velocity is particularly well correlated with the difference spike rate for the without-translation stimulus variant (Fig. 4E, 0.90). Note that the range of average intersaccadic yaw velocities, approximately -100 to +100°/s, produces difference spike rates covering much of the response range of H1 (i.e., approximately -200 to +200 spikes/s). This is consistent with the fact that the movement-sensitive cells in the fly third visual neuropil are quite sensitive to velocities in the 0-100°/s range (Dror et al., 2001).
Finally, Figure 4F shows the distribution of difference spike rates as a function of yaw velocity for the without-saccades stimulus variant (different symbols represent different cells). Here, the stimulus and response were obtained by averaging over consecutive sections of 50 ms. Although there is a section in the curve indicating an approximately linear relationship between stimulus and response, the response is pushed to high, saturating spike rates for a considerable part of the time (Figs. 2D, 3D).
Coherence analysis
Although the scatter diagrams presented above give a general idea of the stimulus-response relationships, the analysis is quite coarse. For most diagrams, the stimulus and response are averaged over sections of typically 50 ms, and these diagrams therefore do not provide information on what happens at shorter time scales. Information on an extended range of time scales can be obtained by calculating the coherence of the difference response with various aspects of the stimulus (see Materials and Methods). The coherence is a function of frequency, varies between 0 and 1, and can be considered as the (squared) correlation coefficient for each frequency component composing the stimulus and response. A coherence of 1 at a particular frequency implies that stimulus and response completely specify each other's amplitude and phase at that frequency, whereas a coherence of 0 implies the absence of such a relationship (either because of noise or because of nonlinearities in the stimulus-response relationship) [see the study by van Hateren and Snippe (2001) for a discussion of this method and its close relationship to stimulus reconstruction techniques].
We found that of the six translational and rotational coordinates of self-motion of the fly, only two produce coherences significantly >0, namely the yaw velocity and the sideward velocity. Figure 5A shows that for the entire response (i.e., not masked; see Materials and Methods), there is only significant coherence with the yaw velocity. This can be understood from Figure 2B: the sign of positive and negative saccades is reliably encoded by the difference response, which is the combination of the black and gray traces. It is also consistent with the result in Figure 4B, because the entire response is dominated by the saccadic response.
Figure 5.

Coherence of the difference response with parameters of self-motion. A, Coherence with yaw (black line) and sideward velocity (gray line) for the original stimulus. B, Coherence with yaw (black) and sideward velocity (gray) for intersaccadic responses to the original stimulus. C, Coherence with yaw (black) and sideward velocity (gray) for the without-translation stimulus. Sideward velocity of the original stimulus was used and is shown only as a control. D, Coherence with yaw (black) and sideward velocity (gray) for intersaccadic responses to the without-translation stimulus. Sideward velocity of the original stimulus was used and is shown only as a control. E, Coherence with yaw (black) and sideward velocity (gray) for responses to the without-saccades stimulus. Graphs in A-E show averages and SEM of four cells stimulated with one to three different flights. coh., Coherence.
The coherence of the intersaccadic response (i.e., masked; see Materials and Methods) with yaw and sideward velocity (Fig. 5B) has a quite different signature. Here, low frequencies mainly encode sideward velocity (gray trace), whereas the yaw velocity (black trace) is represented in a higher frequency band. The low-frequency coherence of the sideward velocity is consistent with the result of Figure 4D, which shows a moderate correlation between averaged intersaccadic sideward velocity and averaged difference spike rate. The midfrequency coherence of the yaw velocity (Fig. 5B) is, however, not detected by the analysis in Figure 4C (with r = 0.005), because there the focus is on low frequencies only (as a result of the averaging over each intersaccadic section), and the coherence with yaw velocity happens to be close to zero at low frequencies (Fig. 5B). This illustrates the advantages of using a coherence analysis rather than only a correlation analysis: the coherence analysis provides a more complete picture of the stimulus-response relationships.
Coherences for the without-translation variant are shown in Figure 5, C and D. Although the yaw coherence of the entire response (Fig. 5C, black trace) is still similar to that of the original stimulus in Figure 5A, the coherence of the intersaccadic response is now considerable (Fig. 5D, black trace). It shows that, for this stimulus variant, the relatively small yaw velocities between saccades (Fig. 4E) are responsible for the considerable H1 response between saccades (Figs. 2C, 3C). The coherences with the sideward velocity (i.e., as it is in the original stimulus) are shown in Figure 5, C and D, only as a consistency check: they are expected to be close to zero, because sideward velocity is zero in the without-translation stimulus.
Finally, Figure 5E shows coherences for the without-saccades variant. Because the response is nearly constant (because of saturation) over extended segments of time (Figs. 2D, 3D, 4F), most of its spectral power is concentrated at low frequencies. The small signal power at higher frequencies leads to a small signal-to-noise ratio at those frequencies, and therefore the coherence between yaw velocity and response (black trace) is confined to low frequencies. The coherence is quite low, because the (nonlinear) saturation compromises the adequacy of linear filtering for reconstructing stimulus from response (or vice versa) (van Hateren and Snippe, 2001).
Information rates
Whereas coherence is related to the ability to recover an estimate of a stimulus parameter by linear filtering of the response, there is potentially much more information available in the spike train than may be visible to the (linear) coherence method. One method to study this possibility is to make direct estimates of the total entropy in the spike train and to compare that with the entropy of the noise as revealed by comparing spike trains in response to stimulus repeats (Strong et al., 1998). A disadvantage of this method is that it does not indicate which aspects of the stimulus are responsible for this information rate. Nevertheless, it does provide an estimate of the overall reliability of the neuron and of its potential for coding behaviorally relevant information (see Discussion).
Figure 6 shows the results of such an analysis for the present data set, using a bin width of 3 ms. Results for a bin width of 2 ms were not significantly different, whereas those for a bin width of 5 ms were ∼20% lower. The information rate (Fig. 6A) is highest for the without-translation variant, which is qualitatively consistent with the high coherence found in Figure 5C. This result is related to the high spike rate in response to the without-translation variant (Fig. 2C). When the information per spike is calculated (Fig. 6B), it is the original stimulus that provides the highest numbers, between 1.5 and 2 bit/spike. The lowest number, ∼0.5 bit/spike, is now obtained for the without-saccades variant, which produces a moderate information rate (Fig. 6A)at the expense of the highest sustained spike rates of the three stimuli (Fig. 2D).
Intersaccadic responses and translational flow
The intersaccadic response of H1 is determined in at least two different ways by translational optic flow. First, the backward flow resulting from forward flight suppresses the intersaccadic response (Fig. 2, compare B, C). Second, sideward flow (Fig. 1A) is responsible for some of the coherence between stimulus and response (Fig. 5B, coherence with sideward velocity). The strength of these effects obviously depends on the strength of the translational flow, which is determined by both flight speed and the distances of objects from the fly. If these distances become large, the translational flow becomes small. The stimulus then approaches the without-translation condition. Because our flies were flying in a cubic cage with edges of 0.4 m, the translational flow may have been larger than would have been typically the case for flies flying in a less restricted space, at least if the flight speed would still be the same.
However, it appears that blowflies, similarly to freely flying bees (Srinivasan et al., 1996), scale their flying speed depending on the average distance of objects, effectively keeping the contribution of translational optic flow to the total flow constant. Figure 7 shows the results of an experiment in which a high-speed camera was used to film flies flying through a tunnel (Kern et al., 2005a). The average speed of crossing the tunnel depends on the tunnel width, which was 9, 18, or 36 cm in the experiment. In Figure 7, this width is expressed as the average nearness, defined as 1/distance (Koenderink and van Doorn, 1987), as observed from the center of the tunnel. For simplicity, the nearness was averaged over a full sphere, and the tunnel was assumed to be infinitely long. Under these assumptions, the integral over nearness can be solved analytically, and yields the following:
 |
Figure 7.
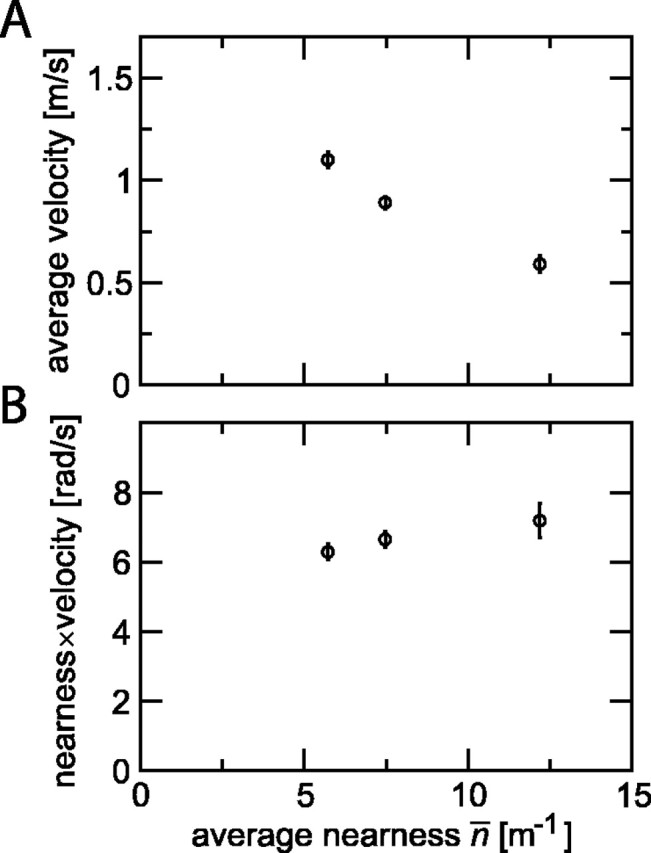
Flight velocity and translational optic flow as a function of tunnel size. A, Average velocity for crossing a tunnel of 20 cm height and width of 9, 18, or 36 cm plotted as a function of average nearness. B, Average nearness times average velocity as a function of average nearness. For both graphs, data points show average (±SEM) of 62 flights of 11 flies (W = 36 cm; n̄ = 5.7 m-1), 61 flights of 11 flies (W = 18 cm; n̄ = 7.5 m-1), and 20 flights of 5 flies (W = 9 cm; n̄ = 12.2 m-1). Velocity was defined here as Δs/Δt, where Δt is the time difference between crossing the entrance and exit planes of a tunnel segment of length Δs = 0.8 m. rad/s, Radians per second.
where n̄ is the average nearness, H is the height of the tunnel, and W is the width. Figure 7A shows that small nearness (i.e., large distance) leads to higher flight speeds than large nearness. For the magnitude of the translational optic flow, the important parameter is the product of nearness and translational velocity (Koenderink and van Doorn, 1987), which has the dimension of an angular velocity. Figure 7B shows that this quantity is nearly constant over the nearness range measured here. It remains to be seen up to which distances such a scaling extends. The maximum flight speed of Calliphora vicina is not known, but it is possibly higher in free space than the maximum of 3 m/s reported by Nachtigall and Roth (1983) for blowflies flying in a wind tunnel. Thus, there is sufficient potential for extended scaling, and it appears likely that translational flow will be important for the H1 response also in other flight conditions than those of our cage experiment.
Saccadic responses of H1 and its target neurons
The response of H1 is strongly dominated by the saccades that the fly makes (Fig. 2B). Because H1 provides excitatory input to tangential cells in the contralateral optic lobe, such as the HSE and VCH neurons (Hausen, 1976; Horstmann et al., 2000) (see Discussion), the response of these neurons is of particular interest. Figure 8 shows the saccade-triggered average responses of the left eye H1 and the right eye HSE and VCH. HSE and VCH are primarily graded-potential neurons, sensitive to front-to-back optic flow, and thus in a direction opposite to that of the H1 cell in the same (ipsilateral) optic lobe. However, the preference of HSE and VCH to yaw rotation is in the same direction as that of the contralateral H1.
The responses to rightward saccades of these neurons (Fig. 8) are as expected. Rightward saccades suppress the left eye H1. The hyperpolarizing response in HSE to rightward saccades is produced by the input of elementary motion detectors in the right eye feeding ipsilaterally into HSE. This HSE hyperpolarization is subsequently passed on to VCH. There is good evidence that VCH lacks direct input from elementary motion detectors and obtains its response from HSE through electrical synapses (Haag and Borst, 2002).
The responses to leftward saccades are dramatically different and, in part, not expected. H1 now responds strongly. Although the right eye HSE should be excited by leftward saccades (because these provide front-to-back optic flow to the right eye), HSE does not show a clearly excitatory response; it even shows a small response dip. This response characteristic is presumably attributable to the fact that the excitatory, leftward saccades are superimposed on a stimulus that is already exciting HSE quite strongly (namely the continuous backward flow caused by forward flight). Surprisingly, the VCH response to leftward saccades is clearly excitatory. This would be difficult to understand if VHC would receive only input from HSE; then, VCH should show, just like HSE, a response dip to leftward saccades. The excitatory response of VCH to leftward saccades can be understood, however, from the excitatory input of H1 into this cell. This explanation requires that the H1 input into VCH is strong enough to overrule the HSE input into VCH. The latter input is possibly weakened during leftward saccades, because the input resistance of HSE is known to be reduced during strong input. This reduced input resistance will decrease the effectiveness of the electrical coupling between HSE and VCH. An H1 input into VCH that is significantly stronger than the H1 input into HSE is in fact consistent with previous reports that both the contralateral and ipsilateral inputs into VCH are significant (Egelhaaf et al., 1993), whereas the contralateral input into HSE is much weaker than the ipsilateral input (Hausen, 1982; Horstmann et al., 2000).
Discussion
We investigated the response of the H1 neuron by using reconstructions of the actual spatiotemporal stimulus as perceived by flying blowflies. Two stimulus modifications were used as well, in which either the translational flow or the saccades were removed. Although all three stimulus variants contain at least some aspects of natural optic flow, we show here that the corresponding responses are dramatically different. Not only the qualitative appearance of the responses is different (Figs. 2, 3) but also the correlation and coherence with parameters of self-motion (Figs. 4, 5), the information rates, and the information per spike (Fig. 6). These results show that extreme care is needed even when naturalistic stimuli are used for interpreting the function of a neuron or for studying its performance limits.
The main conclusion of the experiments is that both the presence of saccades and the presence of translational flow strongly determine the response of H1. In the without-saccades variant, the H1 neuron is exposed to angular velocities of typically a few hundred degrees per second, driving the cell close to its maximal spike rate, switching on and off depending on the direction of turning (Figs. 2D, 3D, 4F). A similar response was measured by Lewen et al. (2001), using the direction of the flight path as a stimulus. The response carries information at a rate of ∼70 bit/s (Fig. 6). For a bin width of 3 ms and a word length of 10 (a measurement window of 30 ms), we found an information of ∼3 bit/word, similar to what is reported for the same bin width and word length by Lewen et al. (2001) for bright outdoor conditions. However, most of the information rate for this stimulus variant does not appear to be linearly related to parameters of self-motion, because the coherence with yaw velocity is small (Fig. 5E).
The without-translation stimulus variant produces not only clear and strong responses to the saccades (Fig. 2C), but it also leads to reliable coding of the relatively low yaw velocities between saccades (Figs. 4E, 5D). The latter result confirms the ability of H1 to encode velocities in the 0-100°/s range (Fig. 4E) and the possibility to reconstruct such yaw velocities from the response (Bialek et al., 1991; Haag and Borst, 1997). However, this type of response profile does not appear to reflect the typical natural response mode of the H1 neuron as produced by the original stimulus. That stimulus also contains translational flow, mainly because of the forward translation during flight, effectively inhibiting the neuron between saccades (Figs. 2B, 3B). Nevertheless, this inhibition is not complete, because occasionally rotational and sideward translational flow in excitatory directions overrides the inhibitory translational flow, producing some coherence with self-motion parameters (Fig. 5B).
If, in natural flight, the coding of small intersaccadic rotations in H1 is mostly hindered by the inhibitory translational flow and the response to saccades is quite prominent, what is the function of H1? It is important to stress here that H1 is an interneuron of the visual system and not an output neuron. Figure 9 summarizes the main connections, as relevant to the present discussion (Egelhaaf et al., 1993; Warzecha et al., 1993; Farrow et al., 2003). H1 and the quite similar H2 neuron (Hausen, 1981; Warzecha et al., 1998) provide excitatory input to contralateral tangential cells, such as the HSE and VCH neurons (Hausen, 1976; Horstmann et al., 2000). VCH gets ipsilateral input from HSE, presumably via electrical synapses (Haag and Borst, 2002). VCH has been shown to provide inhibition to the FD1 cell, which is specialized in detecting objects by visual motion cues (Warzecha et al., 1993).
Figure 9.

Neural wiring related to the presumed function of the H1 neuron, exemplified for the left eye H1. The H1 and H2 neurons of the left third visual neuropil excite the contralateral HSE and VCH neurons. VCH, in addition, is excited by HSE and provides an inhibitory ground for figure-ground detection via the FD1 cell.
The function of H1 with respect to HSE does not appear to be related to the large saccadic responses of H1, because HSE lacks a corresponding excitatory response (Fig. 8). However, the intersaccadic response of H1 displays coherences with yaw and sideward velocity (Fig. 5B,D) that are quite similar to, although generally smaller than, the coherences found in HSE for identical stimuli (Kern et al., 2005b). It is therefore possible that the measured H1 input into HSE (Horstmann et al., 2000) serves to increase the intersaccadic SNR of HSE. The addition to HSE of H1 signals arriving from the contralateral eye (i.e., with different noise but with a similar dependence on self-motion parameters) is expected to increase the SNR of HSE, in particular when the flight speed drops or when object distances become large (i.e., when H1 becomes more active between saccades, because it is no longer suppressed by translational flow). Indeed, the intersaccadic SNR of HSE (here defined as the ratio of total signal and total noise power in 0-50 Hz passbands) increases from 3.5 ± 0.8 (SEM; n = 3) for the original stimulus (when H1 is mostly suppressed) to 15.3 ± 4.2 (SEM; n = 3) for the without-translation stimulus (when H1 is quite active). Obviously, this is only circumstantial evidence, because not only the activity of H1 is different for these stimuli but also the way the actual responses of HSE are mapped into the available HSE response range. This different mapping may affect the SNR measured in HSE as well because of nonlinearities in the biophysical properties of HSE. For a direct check on whether H1 indeed increases the SNR of HSE during naturalistic optic flow, we are currently preparing measurements on HSE in which the H1 contribution is specifically manipulated.
The functional significance of H1 is presumably quite different with regard to VCH and the object-detection circuit. The excitatory response of the right eye VCH to leftward saccades (Fig. 8) must be attributable to H1 and H2, because HSE does not display such a response. Because the major role of VCH is thought to provide an inhibitory surround for object-detecting cells like FD1 (Haag and Borst, 2002), the effect of the transient excitatory response during a leftward saccade in VCH will be a transient suppression of FD1. Without this suppression (indirectly resulting from H1), FD1 would be strongly excited by the optic flow associated with a leftward saccade, because the resulting front-to-back flow in the right eye is excitatory to FD1. Thus, FD1 would then erroneously signal the presence of an object. We therefore hypothesize that the large H1 response in the left eye H1 to leftward saccades is used via VCH as saccadic suppression for the right eye FD1 cell [for a review on saccadic suppression, see Ross et al. (2001)]. Thus, H1 then takes over the role of the right-eye HSE, which fails to be strongly excited by leftward saccades and thus cannot provide, via VCH, the required suppression for FD1. The response characteristics of H1 are well suited for saccadic suppression: H1 is sensitive enough to produce nearly saturating responses even to relatively small saccades (Fig. 4A) and thus clearly marks the period in which saccadic suppression is needed (Figs. 2B, 3B). For a direct check on whether H1 performs this role for FD1 during naturalistic optic flow, we are currently preparing measurements on FD1 in which both the H1 input into VCH and the depth structure of the visual surround is manipulated.
For saccadic suppression to be effective, only a high spike rate is needed (H1 response in Figs. 4A, 8), whereas the details of the spike pattern in the saccadic response are not relevant. This is consistent with the fact that decoding of the H1 spike train appears to be a straightforward, linear summation of EPSPs onto VCH (Horstmann et al., 2000). The high information rate and information per spike of the original stimulus (Fig. 6), which is dominated by the saccadic response, are then not too relevant. Although these measures formally relate to the mutual information between stimulus and spike train, the information within the saccadic response is presumably mostly discarded and not used for visual information processing.
The considerable information rate associated with the H1 response thus puts constraints on the biophysical reliability of the neuron and its input elements, but it does not appear to provide much insight into the role of the neuron or even into its reliability with respect to visual function. This may be a general problem when using information theory in a task-independent way, in particular for neurons at higher processing stages in the brain, where neurons may already be strongly committed to a particular function [see the study by Gabbiani et al. (1996) for a similar observation made in the context of electrosensory processing in weakly electric fish]. High information rates may then just be the by-product of the neuron optimizing only a specific aspect of the response that happens to be behaviorally relevant, such as merely producing a strong and temporally well-delimited response to each saccade. In cases where neurons are not yet too committed to specific tasks, perhaps in early (front-end) processing stages of the sensory system, this is less likely to be a problem.
Conclusion
Conclusions on coding of natural stimuli in H1 strongly depend on the correct details of the stimulus. For natural optic flow, the response to saccades dominates. This suggests a double role for H1; its main role may be to provide, via VCH, saccadic suppression for the FD1 neuron. In addition, H1 may increase the intersaccadic signal-to-noise ratio of HSE and related cells, in particular when flying speeds are low or when object distances are large.
Footnotes
This work was supported by the Deutsche Forschungsgemeinschaft. We thank H. P. Snippe for comments on this manuscript. J. P. Lindemann helped to set up the natural optic flow stimuli in FliMax.
Correspondence should be addressed to J. H. van Hateren at the above address. E-mail: j.h.van.hateren@rug.nl.
Copyright © 2005 Society for Neuroscience 0270-6474/05/254343-10$15.00/0
References
- Bendat JS, Piersol AG (2000) Random data: analysis and measurement procedures. New York: Wiley.
- Bialek W, Rieke F, de Ruyter van Steveninck RR, Warland D (1991) Reading a neural code. Science 252: 1854-1857. [DOI] [PubMed] [Google Scholar]
- Buchner E (1976) Elementary movement detectors in an insect visual system. Biol Cybern 24: 85-101. [Google Scholar]
- Dror RO, O'Carroll DC, Laughlin SB (2001) Accuracy of velocity estimation by Reichardt correlators. J Opt Soc Am A 18: 241-252. [DOI] [PubMed] [Google Scholar]
- Egelhaaf M (1985) On the neuronal basis of figure-ground discrimination by relative motion in the visual-system of the fly. 2. Figure-detection cells, a new class of visual interneurones. Biol Cybern 52: 195-209. [Google Scholar]
- Egelhaaf M, Kern R (2002) Vision in flying insects. Curr Opin Neurobiol 12: 699-706. [DOI] [PubMed] [Google Scholar]
- Egelhaaf M, Borst A, Warzecha AK, Flecks S, Wildemann A (1993) Neural circuit tuning fly visual neurons to motion of small objects. 2. Input organization of inhibitory circuit elements revealed by electrophysiological and optical-recording techniques. J Neurophysiol 69: 340-351. [DOI] [PubMed] [Google Scholar]
- Farrow K, Haag J, Borst A (2003) Input organization of multifunctional motion-sensitive neurons in the blowfly. J Neurosci 23: 9805-9811. [DOI] [PMC free article] [PubMed] [Google Scholar]
- Gabbiani F, Metzner W, Wessel R, Koch C (1996) From stimulus encoding to feature extraction in weakly electric fish. Nature 384: 564-567. [DOI] [PubMed] [Google Scholar]
- Haag J, Borst A (1997) Encoding of visual motion information and reliability in spiking and graded potential neurons. J Neurosci 17: 4809-4819. [DOI] [PMC free article] [PubMed] [Google Scholar]
- Haag J, Borst A (1998) Active membrane properties and signal encoding in graded potential neurons. J Neurosci 18: 7972-7986. [DOI] [PMC free article] [PubMed] [Google Scholar]
- Haag J, Borst A (2002) Dendro-dendritic interactions between motion-sensitive large-field neurons in the fly. J Neurosci 22: 3227-3233. [DOI] [PMC free article] [PubMed] [Google Scholar]
- Harris RA, O'Carroll DC, Laughlin SB (2000) Contrast gain reduction in fly motion adaptation. Neuron 28: 595-606. [DOI] [PubMed] [Google Scholar]
- Hausen K (1976) Functional characterization and anatomical identification of motion sensitive neurons in the lobula plate of the blowfly Calliphora erythrocephala Z Naturforsch 31c: 629-633. [Google Scholar]
- Hausen K (1981) Monocular and binocular computation of motion in the lobula plate of the fly. Verh Dtsch Zool Ges 74: 49-70. [Google Scholar]
- Hausen K (1982) Motion sensitive interneurons in the optomotor system of the fly. II. The horizontal cells: receptive field organization and response characteristics. Biol Cybern 46: 67-79. [Google Scholar]
- Hausen K, Egelhaaf M (1989) Neural mechanisms of visual course control in insects. In: Facets of vision (Stavenga DG, Hardie RC, eds), pp 391-424. Berlin: Springer.
- Hengstenberg R (1992) Stabilizing head/eye movements in the blowfly Calliphora erythrocephala In: The head-neck sensory motor system (Berthoz A, Graf W, Vidal PP, eds), pp 49-55. Oxford: Oxford UP.
- Horstmann W, Egelhaaf M, Warzecha AK (2000) Synaptic interactions increase optic flow specificity. Eur J Neurosci 12: 2157-2165. [DOI] [PubMed] [Google Scholar]
- Kern R, Dittmar L, Schwerdtfeger G, Böddeker N, Egelhaaf M (2005a) Blowflies exhibit saccadic flight style under various free flight conditions. In: Proceedings of the 6th Meeting of the German Neuroscience Society/30th Göttingen Neurobiology Conference 2005 (Zimmermann H, Krieglstein K, eds),; Neuroforum 2005, 1 [Suppl]: 19B. [Google Scholar]
- Kern R, van Hateren JH, Michaelis C, Lindemann JP, Egelhaaf M (2005b) Eye movements during natural flight shape the function of a blowfly motion sensitive neuron. PLoS Biol, in press. [DOI] [PMC free article] [PubMed]
- Kimmerle B, Egelhaaf M (2000) Performance of fly visual interneurons during object fixation. J Neurosci 20: 6256-6266. [DOI] [PMC free article] [PubMed] [Google Scholar]
- Koenderink JJ, van Doorn AJ (1987) Facts on optic flow. Biol Cybern 56: 247-254. [DOI] [PubMed] [Google Scholar]
- Krapp HG, Hengstenberg R, Egelhaaf M (2001) Binocular contribution to optic flow processing in the fly visual system. J Neurophysiol 85: 724-734. [DOI] [PubMed] [Google Scholar]
- Land MF, Collett TS (1974) Chasing behavior of houseflies (Fannia canicularis)-description and analysis. J Comp Physiol 89: 331-357. [Google Scholar]
- Lewen GD, Bialek W, de Ruyter van Steveninck RR (2001) Neural coding of naturalistic motion stimuli. Network 12: 317-329. [PubMed] [Google Scholar]
- Lindemann JP, Kern R, Michaelis C, Meyer P, van Hateren JH, Egelhaaf M (2003) FliMax, a novel stimulus device for panoramic and highspeed presentation of behaviourally generated optic flow. Vision Res 43: 779-791. [DOI] [PubMed] [Google Scholar]
- Nachtigall W, Roth W (1983) Correlations between stationary measurable parameters of wing movement and aerodynamic force production in the blowfly (Calliphora vicina). J Comp Physiol 150: 251-260. [Google Scholar]
- Ross J, Morrone MC, Goldberg ME, Burr DC (2001) Changes in visual perception at the time of saccades. Trends Neurosci 24: 113-121. [DOI] [PubMed] [Google Scholar]
- Schilstra C, van Hateren JH (1998) Stabilizing gaze in flying blowflies. Nature 395: 654. [DOI] [PubMed] [Google Scholar]
- Schilstra C, van Hateren JH (1999) Blowfly flight and optic flow I. Thorax kinematics and flight dynamics. J Exp Biol 202: 1481-1490. [DOI] [PubMed] [Google Scholar]
- Schuling FH, Mastebroek HAK, Bult R, Lenting BPM (1989) Properties of elementary movement detectors in the fly Calliphora erythrocephala J Comp Physiol [A] 165: 179-192. [Google Scholar]
- Srinivasan MV, Zhang SW, Lehrer M, Collett TS (1996) Honeybee navigation en route to the goal: visual flight control and odometry. J Exp Biol 199: 237-244. [DOI] [PubMed] [Google Scholar]
- Strong SP, de Ruyter van Steveninck RR, Bialek W, Koberle R (1998) On the application of information theory to neural spike trains. Pac Symp Biocomput 80: 621-632. [PubMed] [Google Scholar]
- Theunissen F, Roddey JC, Stufflebeam S, Clague H, Miller JP (1996) Information theoretic analysis of dynamical encoding by four identified primary sensory interneurons in the cricket cercal system. J Neurophysiol 75: 1345-1364. [DOI] [PubMed] [Google Scholar]
- van Hateren JH, Schilstra C (1999) Blowfly flight and optic flow II. Head movements during flight. J Exp Biol 202: 1491-1500. [DOI] [PubMed] [Google Scholar]
- van Hateren JH, Snippe HP (2001) Information theoretical evaluation of parametric models of gain control in blowfly photoreceptor cells. Vision Res 41: 1851-1865. [DOI] [PubMed] [Google Scholar]
- van Hateren JH, Rüttiger L, Sun H, Lee BB (2002) Processing of natural temporal stimuli by macaque retinal ganglion cells. J Neurosci 22: 9945-9960. [DOI] [PMC free article] [PubMed] [Google Scholar]
- Wagner H (1986) Flight performance and visual control of flight of the free-flying housefly (Musca domestica). 1. Organization of the flight motor. Philos Trans R Soc Lond B Biol Sci 312: 527-551. [Google Scholar]
- Warzecha AK, Egelhaaf M, Borst A (1993) Neural circuit tuning fly visual interneurons to motion of small objects. I. Dissection of the circuit by pharmacological and photoinactivation techniques. J Neurophysiol 69: 329-339. [DOI] [PubMed] [Google Scholar]
- Warzecha AK, Kretzberg J, Egelhaaf M (1998) Temporal precision of the encoding of motion information by visual interneurons. Curr Biol 8: 359-368. [DOI] [PubMed] [Google Scholar]
- Warzecha AK, Kretzberg J, Egelhaaf M (2000) Reliability of a fly motion-sensitive neuron depends on stimulus parameters. J Neurosci 20: 8886-8896. [DOI] [PMC free article] [PubMed] [Google Scholar]