

Abstract
The learned vocalizations of songbirds constitute a rhythmic behavior that is thought to be governed by a central pattern generator and that is accompanied by highly patterned neural activity. Phasic premotor activity is observed during singing in HVC [used as a proper name following the nomenclature of Reiner et al. (2004)], a telencephalic song system nucleus that is essential for song production. Moreover, HVC neurons display phasic patterns of auditory activity in response to song stimulation. To address the cellular basis of pattern generation in HVC, we investigated its rhythm-generating abilities.
We report here the induction of sustained, rhythmic activity patterns in HVC when isolated in vitro. Brief, high-frequency stimulation evoked repetitive postsynaptic potentials (PSPs) and local field potentials (LFPs) from HVC neurons recorded in a brain slice preparation made from adult male zebra finches. These rhythmic events were sustained for seconds in the absence of ongoing, phasic stimulation, and they had temporal properties similar to those of syllable occurrence within zebra finch song. Paired recordings revealed synchrony between repetitive PSP and LFP occurrence, indicating that a population of cells participates in this patterned activity. The PSPs resulted from multiple, coordinated, fast-glutamatergic, synaptic inputs. Moreover, their occurrence and timing relied on inhibitory synaptic transmission. Thus, HVC itself has rhythmic abilities that could influence the timing of neural activity over relatively long time windows. These rhythmic properties may contribute to song production or perception in vivo.
Keywords: birdsong, vocalization, central pattern generator, sensorimotor, rhythm, HVC
Introduction
Song production involves the coordinated rhythmic actions of respiratory muscles and those of the syrinx, the avian vocal organ (Vicario, 1991; Suthers, 1997). Song is a learned behavior, and the neural structures controlling song learning and production lie within the song system, a specialized set of interconnected nuclei (Nottebohm et al., 1976, 1982). The combination of a highly stereotyped behavior and candidate neural substrates is advantageous for understanding the neural control of complex learned behaviors. Moreover, parallels between song and human speech suggest the possibility of some shared underlying mechanisms (Doupe and Kuhl, 1999).
A central pattern generator (CPG) network likely controls song production, as originally suggested by the repetitive, stereotyped quality of birdsong. Like other behaviors generated by CPGs, song production in adults does not rely on sensory feedback for the moment-to-moment execution of motor outputs. Neither removing auditory feedback by deafening nor removing proprioceptive feedback by deafferenting the syringeal muscles leads to an immediate song deficit in adult songbirds, either alone or in combination (Konishi, 1965; Price, 1979; Bottjer and Arnold, 1984). Thus, a CPG network could drive singing.
HVC [used as a proper name following the nomenclature of Reiner et al. (2004)] is a telencephalic nucleus within the song system (Fig. 1A) that is well suited to control song production. As part of the motor pathway, HVC is necessary for singing, has the appropriate connectivity to influence song output (Nottebohm et al., 1976), and exhibits patterned premotor activity during singing (McCasland, 1987; Yu and Margoliash, 1996; Hahnloser et al., 2002). In addition, in vivo stimulation studies implicate HVC as a part of the CPG network for song: stimulating HVC in a singing bird resets the song pattern (Vu et al., 1994), and there is some suggestion that high-frequency stimulation delivered to HVC in quiescent birds can elicit vocalizations (Vu et al., 1994; Vicario and Simpson, 1995). Thus, patterned activity in HVC accompanies song production. Moreover, HVC neurons are auditory, displaying robust phasic activity in response to song stimuli (Margoliash, 1983; Margoliash and Fortune, 1992; Mooney, 2000). Thus, HVC could mediate song perception (Brenowitz, 1991) and is a potential site for sensorimotor integration; both of these roles may rely on rhythmic neural activity. To understand the pattern-generating mechanisms of HVC that could underlie song processing and production, we investigated the rhythmic abilities of HVC in isolation.
Figure 1.
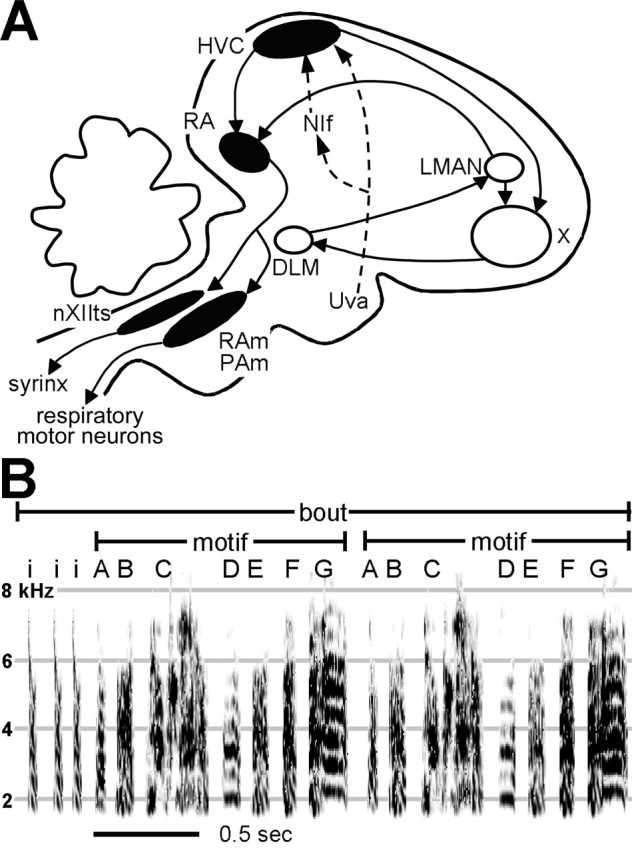
The structure of the song system and of zebra finch song. A, A schematic of the song system shows the motor pathway nuclei in black and the anterior forebrain pathway (AFP) nuclei in white. HVC projects to RA, which then projects to the tracheosyringeal portion of the hypoglossal nucleus (nXIIts) and to two respiratory nuclei, nucleus retroambigualis (RAm) and nucleus parambigualis (PAm). Dashed arrows indicate two afferent pathways to HVC: Uva and NIf. The AFP nuclei form a pathway that indirectly links HVC and RA by way of the basal ganglia. The AFP consists of Area X, the medial dorsolateral nucleus of the anterior thalamus (DLM), and the lateral magnocellular nucleus of the anterior nidopallium (LMAN). B, A sonogram of an adult zebra finch song bout plots frequency against time; intensity in each frequency band is indicated by degree of darkness. Different syllables are labeled with different letters; a repeated sequence of syllables comprises a motif. Introductory notes (“i”) precede the first motif and, together with the multiple motifs, comprise a song bout.
We studied a brain-slice preparation of HVC made from adult zebra finches, a species that learns one song and reproduces it with high fidelity throughout life. Their song consists of multiple syllables, which occur with frequencies ranging from 4 to 10 Hz (Fig. 1B) (Price, 1979; Nordeen and Nordeen, 1992; Wang et al., 1999; Brainard and Doupe, 2001). A stereotyped sequence of two to nine syllables composes a motif (Price, 1979), which lasts from 500 to 1000 ms (Sossinka and Böhner, 1980), and is repeated multiple times in a song bout. We report here that high-frequency stimulation of HVC in vitro can induce rhythmic synaptic events and local field potentials (LFPs), the timing of which resembles that of syllable occurrence within song. These events allowed us to begin to dissect the cellular mechanisms underlying HVC rhythmicity.
Materials and Methods
Slice preparation. Data were obtained from 38 adult (>90 d of age) male zebra finches (Taeniopygia guttata) obtained from suppliers. All procedures were in accordance with a protocol approved by the Institutional Animal Care and Use Committee of the University of Washington. Birds were anesthetized with isoflurane and decapitated. The brain was quickly removed and placed in ice-cold artificial CSF (ACSF) (in mm: 119 NaCl, 2.5 KCl, 1.3 MgSO4, 2.5 CaCl2, 1 NaH2PO4, 16.2 NaHCO3,11 d-glucose, and 10 HEPES, osmolarity 286-292 mOsm). Parasagittal or coronal slices, 350-500 μm thick, were cut with a vibrating microtome in ice-cold ACSF and then transferred to a storage chamber containing ACSF heated to 35°C. The storage chamber was allowed to cool to room temperature after slicing was completed. The storage and recording ACSF differed from the slicing ACSF in that the HEPES was replaced with equiosmolar NaHCO3. All solutions were bubbled with a 95% O2-5% CO2 mixture.
The brain-slice preparation of HVC used in these experiments transected the inputs from its three afferent nuclei: nucleus interface of the nidopallium (NIf), nucleus uvaeformis (Uva), and medial magnocellular nucleus of the anterior nidopallium (MMAN). These nuclei lie anterior to HVC (the closest nucleus, NIf, is ≥1 mm anterior of HVC). Uva lies within the diencephalon, which was removed in all cases. For 24 of 51 recordings, NIf was confirmed to be absent from the slice, because either it was cut in the coronal plane (n = 6) or, in the parasagittal plane, the anterior portion of the slice was removed (n = 18; n = 10 cases from whole-cell recordings; n = 8 cases from field-potential recordings). The remaining cases were unlikely to contain NIf, because when NIf and HVC do coexist in a slice, it is the smaller, medial-most portion of HVC included in the slice, from which we did not record. For robust nucleus of the arcopallium (RA) recordings, the slices contained both HVC and RA.
Electrophysiology. Recording began >1 h after slices were made. For recording, a slice was submerged in a small chamber perfused with HEPES-free ACSF at 2 ml/min. ACSF temperature was maintained at 28-30°C. We did not record at zebra finch body temperature (∼40°C), because at temperatures >30°C, cell health is greatly diminished. Although the speed of most cellular events would be expected to be faster at 40°C, network-generated phenomena could be faster, slower, or unchanged (Ruby et al., 1999).
HVC is visible in brain slices when transilluminated and viewed with a stereomicroscope. Most intracellular recordings were obtained using the blind whole-cell technique. Patch electrodes were pulled from glass pipettes, resulting in a tip diameter <2 μm and a resistance of 4-10 MΩ when filled with internal solution. The internal solution contained the following (in mm): 120 K-methylsulfate, 10 HEPES, 2 EGTA, 8 NaCl, 2 ATP, 0.3 GTP, and 1 MgCl2, pH 7.3, and osmolarity was ±5% of the ACSF osmolarity. In some cases, 10 mm biocytin (Vector Laboratories, Burlingame, CA) was included in the internal solution for histological identification of the cells recorded. In five cases, cells were obtained using intracellular sharp electrodes. For these recordings, microelectrodes were filled with 2 m potassium acetate and had resistances of 100-200 MΩ. All electrodes were pulled with a Sutter Instruments (Novato, CA) P-97 micropipette puller. Data collected with sharp electrodes did not differ from those collected with patch electrodes; therefore, the data from both methods were combined.
Voltage signals were initially amplified with an Axoclamp 2B (Axon Instruments, Foster City, CA) and then low-pass filtered (3 kHz) and further amplified with a Brownlee model 410 amplifier (San Jose, CA). Total signal amplification for intracellular recordings was 100×. The filtered signals were digitized at 6 kHz with a National Instruments (Austin, TX) digitizing board and stored in a personal computer using custom data acquisition programs written in LabView (National Instruments) by M. Farries (University of Washington, Seattle, WA), D. Perkel, and M. Solis.
Field-potential recordings were made using glass electrodes with tips 8-10 μm wide and filled with a 0.9% NaCl solution (1-4 MΩ). Signals were amplified 1000× and digitized at 10 kHz. Although field potentials were apparent with low-pass filtering at 3 kHz, they were further filtered at 100 Hz before analysis.
A stimulating electrode was placed within HVC and used to deliver high-frequency stimuli to somata and fibers within the nucleus. This electrode was either a stainless steel bipolar electrode or a platinum/iridium concentric bipolar electrode (Frederick Haer Company, Bowdoinham, ME). In choosing the stimulus paradigm, we were guided by the high-firing rates observed in HVC during singing (McCasland, 1987; Yu and Margoliash, 1996; Hahnloser et al., 2002) and by the frequency and duration of stimuli used to evoke vocalizations from quiescent birds (Vu et al., 1994; Vicario and Simpson, 1995). Stimuli consisted of trains of 100-μs-long monophasic pulses. In most cases (47 of 51), stimulation at 100 Hz for 500 ms (50 pulses) was used. The remaining four cases consisted of longer stimulus trains that were 750 ms long delivered at a rate of 100 Hz (n = 1) or 200 Hz (n = 3). The events elicited from these three different types of stimulus trains did not differ significantly in their properties (these measurements are described below) (total, duration, frequency, and latency; Kruskal-Wallis test; p > 0.05). Moreover, the events elicited by stimulus trains of different durations (500 or 750 ms) also did not differ significantly in these four properties (Mann-Whitney test; p > 0.05). Thus, the data obtained under all stimulus conditions were combined. For intracellular recordings, the effective stimulus intensity ranged from 13 to 70 V (mean, 38 V; n = 25) or from 1.5 to 3 mA (mean, 2.4 mA; n = 4); cells did not necessarily spike during the stimulus. For LFPs, the stimulus intensity ranged from 16 to 64 V (mean, 56; n = 22). Whether repetitive postsynaptic potentials (PSPs) were obtained depended on the location of the stimulating electrode relative to the recording electrode; repetitive LFP yield was higher than repetitive PSP yield given the ability to move the extracellular electrode through the tissue to search for repetitive events. However, being close (within 100 μm) to the cell recorded did not guarantee repetitive PSP appearance. In general, we found that varying stimulus intensity was more effective at eliciting repetitive PSPs than varying stimulus frequency or duration. Stimuli were delivered no faster than once every 30 s.
Drugs used in these experiments included 6-cyano-7-nitroquinoxaline-2,3-dione (CNQX) (Tocris Cookson, Ellisville, MO), bicuculline methiodide (BMI) (Sigma, St. Louis, MO), picrotoxin (Sigma), and sodium pentobarbital (Abbott Laboratories, Chicago, IL). All drugs were bath applied. Pentobarbital experiments used four different concentrations: 20 μm (n = 1), 40 μm (n = 1), 100 μm (n = 4), and 200 μm (n = 2). Kruskal-Wallis tests did not find any significant differences between the effects of these doses (p > 0.05), and thus these data were grouped together for analysis.
Histology. In cases when biocytin was included in the electrode solution, slices were immersion fixed in paraformaldehyde (4% in 0.1 m phosphate buffer) and kept at 4°C at least overnight. Slices were subsequently cryoprotected in a sucrose solution (30% in 0.1 m phosphate buffer) and stored at 4°C at least overnight. Slices were then sectioned to 40 μm thickness with a freezing microtome and processed for visualization with an avidin-biotin horseradish peroxidase complex kit (Vector ABC Elite kit; Vector Laboratories) using diaminobenzidine as the peroxidase substrate. Sections were counterstained with cresyl violet. Cells were determined to be one of three types found in HVC by their axon trajectory and/or morphology. In cases of ambiguous or no histological data, cells were identified by a combination of their intrinsic properties and action potential characteristics, as described previously (Dutar et al., 1998; Kubota and Taniguchi, 1998; Mooney, 2000).
Data analysis. Voltage traces were analyzed for the occurrence of PSPs or LFPs before and after the high-frequency stimulus using event-detection procedures written in IGOR 4.0 (Wavemetrics, Lake Oswego, OR). Each trial lasted 8-10 s and included a stimulus. The prestimulus portion of a sweep lasted 2 s and was divided into three sections: a 200 ms baseline,a 1 s hyperpolarizing current pulse to measure input resistance (for intracellular recordings only), and an 800 ms baseline before the stimulus. To be included in the final dataset, cells had to have a stable input resistance (≤15% change) and a stable resting potential (±5 mV) as well as show consistent repetitive PSPs in response to at least five consecutive (and identical) stimulus trains. This last criterion caused 56 of 85 cells to be excluded from the dataset. For evoked LFPs to be included in the dataset, they also had to occur consistently in response to at least five consecutive, identical stimulus trains; this excluded 5 of 27 cases of LFPs. The LFPs were detected (following low-pass filtering at 100 Hz) with the same procedures used for PSPs.
Several measurements of the PSPs and LFPs were made. For each event, the amplitude of the PSP, the 10-90% rise time (the time from 10 to 90% of the event amplitude), and the event onset time were measured. For each trial of identical stimulation, the following measurements were made: the number of events, the latency to the first event (relative to stimulus offset), event frequency (obtained from the reciprocals of the intervals between individual events), and duration of the epoch of events (the time between the onsets of the first and last events). For each cell or site, a mean value for each of these was obtained by averaging across trials. In drug experiments, the percentage change in event properties (such as the number evoked per trial) was calculated by averaging the values obtained during the last 2 min of drug application and comparing it with the average value obtained during the 2 min preceding drug application.
A PSP was determined to be an EPSP when it remained depolarizing at holding potentials above -55 mV; IPSPs reversed by this potential. Although the ECl value for the internal solution was calculated to be -64 mV, we found that IPSPs evoked by a single stimulus sometimes did not reverse until the cell was depolarized to -55 mV, and thus we used this as a criterion.
Spikes were detected with procedures similar to those used for PSP detection (using IGOR). For bursting interneurons, pauses between bursts were detected by calculating the instantaneous frequency of spiking and then evaluating whether each spike fell below a criterion level, which was defined as one SD below the average instantaneous frequency. If the instantaneous frequency fell below this level, a pause between bursts was detected, and the lower frequency was used to calculate the mean interburst frequency for the cell.
Statistical tests were done using IGOR or Prism (GraphPad Software, San Diego, CA); tests were two-tailed unless specified otherwise. Means were reported and parametric tests were used for distributions that passed the Kolmogorov-Smirnov goodness of fit test for normality; otherwise, nonparametric methods were used and medians reported.
Cross-correlations. To quantify the degree of correspondence between simultaneously recorded PSPs and LFPs, a cross-correlation procedure was used. For each trial, the onset times of PSPs were cross-correlated to the onset times of the LFPs using a procedure written by A. Person (University of Washington, Seattle, WA) based on the built-in “xcorr” function in MatLab (MathWorks, Natick, MA). In detail, PSP and LFP event times were represented as a comb function, which was then smoothed by convolution with a Gaussian waveform with a width at half-maximal amplitude of 10 ms. This width was chosen because it approximates the repetitive PSP and LFP rise times (the average 10-90% rise time is 9 ms and 8.5 ms for repetitive PSPs and LFPs, respectively). The resulting pairs of waveforms were then cross-correlated. The resulting cross-correlation function was normalized to the autocorrelation of one of the traces of the pair, which by definition is 1. For comparison, event times were also randomized within a trial such that the number of events and the interevent interval distribution of each trial were preserved, but the order of the intervals was randomized. These randomized event times were then cross-correlated in the same manner as the observed event times, and average cross-correlation coefficients and lags were obtained. For each pair-wise comparison, the randomizing procedure was performed 150 times. This same cross-correlation procedure was also used to quantify the stereotypy of evoked PSP or LFP patterns across trials and to quantify stereotypy of syllable-onset times during song production (see below).
Timing analysis. The degree of regularity in timing of the evoked PSPs and LFPs was analyzed with two methods: using simulated event epochs and cross-correlations. In the first method, the distribution of inter-PSP or inter-LFP (interevent) intervals observed for a cell or site was compared with a simulated distribution of interevent intervals that was obtained using the data from that cell or site. To create the simulated distribution for each cell, the evoked PSP or LFP onset times were randomly drawn to match the number of events and trials obtained for that particular cell or site. For each simulated trial, the interevent intervals were calculated. Thus, for the cell shown in Figure 5A, we randomly drew PSP onset times from the sample of all PSP times obtained from that cell (i.e., all tick marks both within and across trials). Thus, because three events occurred in the first trial in the simulation, three events were drawn from this sample of PSP onset times, followed by five (trial 2), seven (trial 3), and so on until the entire data set had been duplicated with the simulation. Between each simulated trial, event times were replaced. Then this procedure was repeated 100 times to approximate a random distribution; thus, the simulated distribution had 100-fold more events than the observed interval distribution. Because the simulated distribution was drawn from PSP onset times, the intervals between stimulus offset and first PSP onset were not included in the interval distributions. In addition, to constrain the simulated intervals to values that were biologically plausible, simulated intervals <10 ms were excluded from analysis; we used this value based on action potential refractory periods and on the average rise time of our PSP events (9.0 ms) and LFPs (8.5 ms). Finally, whether the resulting simulated (random) distribution of inter-PSP intervals was different from the actual distribution obtained from the cell was evaluated using a Kolmogorov-Smirnov test.
Figure 5.

Repetitive PSP and LFP timing displayed some regularity. A, A raster plot shows the timing of the occurrence of individual PSPs after repeated high-frequency stimulation (stimulus not shown); events are aligned to the first poststimulus PSP occurrence. The plot shows 11 consecutive trials, and each tick mark indicates the occurrence of one PSP. B, A gray histogram shows the distribution of the observed inter-PSP intervals obtained from all of the responses shown in A. The black line outlines the simulated interval distribution (bin size, 30 ms). The left axis shows the number of events for the observed data; the right axis shows the number of events for the simulated data. C, Variability of PSP or LFP time of occurrence increased with successive events. The dotted line shows the SD of each event time across trials for the cell shown in A. The solid line with solid circles indicates the average SD for each PSP event time across all cells, and the solid line with open circles indicates the average SD for each LFP event time across all sites. The number of cells or sites contributing to each point is shown below the abscissa. D, The mean cross-correlation coefficient is plotted against the mean lag obtained for all pair-wise comparisons of trials for PSPs (solid circles) and LFPs (open circles). The plus symbol indicates the values obtained for the event times shown in A. E, The mean cross-correlation coefficient is plotted against the mean lag obtained for all pair-wise comparisons of syllable onsets within bouts of song (solid circles) or excised motifs (open circles) from each bird (n = 5 birds total). F, The graph compares the cross-correlation values obtained for repetitive events elicited in vitro with those obtained for syllable onsets during song bouts or motifs in vivo. The horizontal lines mark the mean values for each group; asterisks and brackets indicate significant differences between groups.
The cross-correlation method described above was also applied to multiple trials of evoked PSPs or LFPs to quantify the stereotypy in the patterning of these events across trials. To do this, the event times from a single trial were cross-correlated to the event times of a different trial obtained from that cell or site; all possible pair-wise comparisons were made once. The resulting correlation coefficients of each pair-wise comparison were then averaged to obtain a measure of the stereotypy of a pattern evoked for a particular cell or site.
Song analysis. Song was recorded from five birds that were isolated in a sound-attenuating chamber; thus, this was “undirected” song. These birds were not subsequently used for in vitro experiments. A computerized, sound-activated recording system detected and digitized bouts of singing. A song bout was defined as a unit of song that was preceded and followed by at least 2 s of silence. Ten bouts of song were analyzed for each bird. Song was subsequently analyzed using software written in IGOR. In brief, songs were systematically segmented into their component syllables, and repeated sequences of syllables were identified as motifs by observers familiar with the structure of zebra finch song. A single bird could sing multiple motif types (range, 1-4). The cross-correlation procedure described above was applied to the syllable onset times to measure the stereotypy of syllable timing during singing. Thus, the syllable onset times of one bout (or motif) were cross-correlated to the syllable onset times of another bout (or motif); all possible pair-wise comparisons were made. The resulting cross-correlation coefficients were averaged to give a measure of syllable-timing stereotypy.
Results
High-frequency stimulation evoked repetitive synaptic events
While recording from HVC cells, a high-frequency stimulus (100 Hz for 500 ms) was delivered extracellularly within the nucleus. HVC neurons responded to this stimulation with a large, broad depolarization that could give way to multiple discrete PSPs that were depolarizing and delayed relative to the stimulus (Fig. 2A-C). These repetitive PSPs were elicited from 45% of cells (85 of 190), even though these slices included only one-fourth to one-third of the total HVC volume. In 29 of these cells, repetitive PSPs appeared consistently after stimulation, occurring for five or more consecutive identical stimuli; some of these cells fired action potentials during the stimulus train, whereas others did not. After stimulation, the average rate of PSP occurrence was elevated 45-fold above the rate during the prestimulus baseline (Wilcoxon paired sample test; n = 29; p < 0.001); events occurred rarely during the prestimulus baseline. Whereas the majority of these repetitive PSPs were subthreshold, in three cells, some events reached action potential threshold (Fig. 2B). These repetitive synaptic events were elicited similarly from all three cell types described for HVC (Dutar et al., 1998; Kubota and Taniguchi, 1998; Mooney, 2000): RA-projecting (Fig. 2A) (RAp; n = 15), X-projecting (Fig. 2B) (Xp; n = 10), and interneurons (Fig. 2C) (n = 4). Importantly, repetitive PSPs occurred in slices made in either the coronal (n = 6) or the parasagittal plane (n = 23; at least 10 of which did not contain the afferent nucleus NIf) (see Materials and Methods). This indicates that even when inputs to HVC are transected, HVC alone could perpetuate repetitive synaptic activity.
Figure 2.
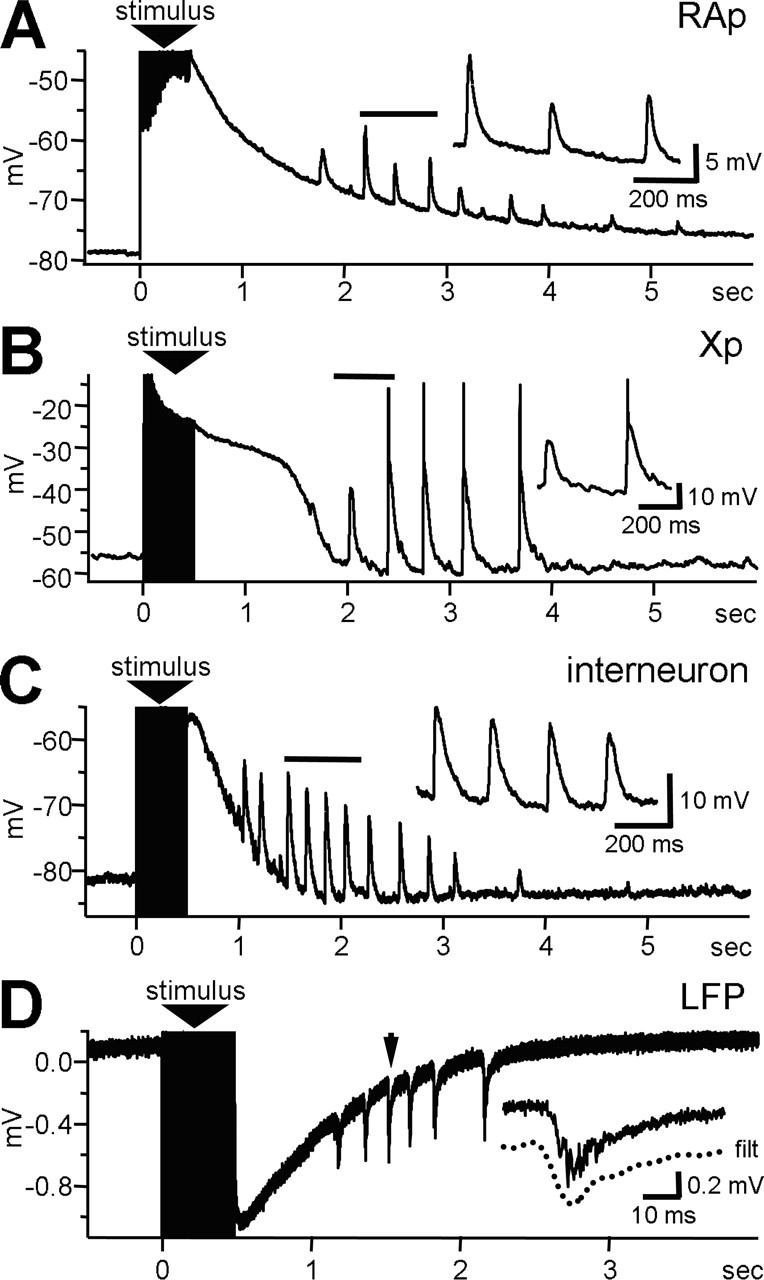
High-frequency stimulation elicited repetitive events in HVC. A train of pulses delivered to the slice at 100 Hz for 500 ms evoked repetitive PSPs in an RAp (A), an Xp cell in which PSPs were often suprathreshold (B), and an interneuron (C). The thick line above some of the PSPs marks those enlarged in each inset. In each case, stimulus artifacts are truncated. D, Stimulation at 100 Hz for 500 ms evoked repetitive negative-going LFPs in an extracellular recording from HVC. The arrow indicates the event enlarged in the inset, which shows both raw and low-pass-filtered traces (the latter designated “filt”).
Coordinated activation of HVC neurons
The amplitude and rise time of the repetitive PSPs suggest that they were the product of multiple, coordinated inputs from within HVC. The mean amplitude of the PSPs was 5.5 mV (n = 29; SEM, 0.49), and for two cells, PSP amplitude could be >10 mV. Given this size, the repetitive PSPs were likely produced by multiple inputs, because unitary EPSPs in other structures such as cortex have amplitudes of ∼1 mV (Thomson et al., 1993). Furthermore, PSP rise times were short, averaging 9.0 ms (n = 29; SEM, 0.51), indicating that the inputs giving rise to the repetitive PSPs coordinated their firing within ∼9 ms of each other.
To observe directly the coordinated activation of a population of HVC cells during the evoked rhythms, we recorded LFPs in HVC after high-frequency stimulation. At 22 sites (in 20 slices), we obtained rhythmic LFP activity that was restricted to certain locations within HVC, perhaps reflecting the activity of clusters of HVC neurons (Bottjer et al., 1986; Fortune and Margoliash, 1995). These recordings were made in parasagittal slices of HVC, at least eight of which lacked NIf. The rhythmic LFPs could be negative or positive going (Figs. 2D and 3A, respectively), and spikes could be observed occasionally within the field potential (9 of 22 cases). On average, these LFP events were 0.12 mV in absolute amplitude, and the 10-90% rise time was 8.5 ms (n = 22 for each). Thus, high-frequency stimulation also evokes patterned activity in a population of HVC cells that could include suprathreshold firing.
Figure 3.

Rhythmic PSPs and LFPs were synchronized to one another. A, Simultaneous whole-cell (top trace) and field-potential (bottom trace) recordings show a tight correspondence between repetitive PSPs and positive-going LFPs. The rhythmic activity was evoked by 100 Hz for 500 ms stimulation, and stimulus artifacts are truncated. B, A raster plot shows the event times in each trial of high-frequency stimulation for a pair of simultaneous PSP and LFP recordings. For each trial, the tick marks show the occurrences of each PSP (top) and the occurrences of LFPs (bottom). The trial in brackets indicates the trial shown in A. C, The average cross-correlation function between PSP and LFP times obtained over the trials in B is shown as the black line. The gray line shows the randomized cross-correlation function (for details, see Materials and Methods). D, The mean cross-correlation coefficients are plotted against the corresponding mean lag times for each pair of dual recordings obtained. The solid symbol indicates the dual recording shown in A-C.
We determined that the repetitive PSPs and LFPs evoked by high-frequency stimulation represented the same rhythmic state with paired recordings. Figure 3A shows simultaneous recordings of PSPs from an HVC cell and of LFPs recorded within HVC after high-frequency stimulation. There was usually a one-to-one correspondence between synaptic events and LFPs, and their timing was essentially synchronized. This is illustrated in Figure 3B, which shows the occurrence of synaptic events above the simultaneous occurrence of LFPs over multiple trials of high-frequency stimulation for the same cell-site pair shown in Figure 3A. Figure 3C shows the cross-correlation function for the trial shown in brackets in Figure 3C; the peak was centered over 0 ms, and the peak was higher than the function obtained from randomizing the event times (see Materials and Methods). Near-synchronization between repetitive PSPs and LFPs was apparent for the seven cell-site pairs we recorded (Fig. 3D). Lower cross-correlation coefficients resulted from trials in which individual LFPs did not have a corresponding synaptic event in the cell recorded or vice-versa (Fig. 3B) (e.g., trial 4). Thus, the repetitive PSPs and LFPs after high-frequency stimulation reflected the same underlying rhythmic phenomenon and indicate coordinated activation of the nucleus during this patterned activity.
Timing of rhythmic activity
The rhythmic synaptic and LFP events were sustained in the absence of ongoing phasic stimulation, because they occurred well after the offset of the stimulus train. The mean latency to the onset of the first PSP (measured from stimulus offset) was 1077 ms (n = 29), and the mean latency to the first LFP was 751 ms (Fig. 4A) (n = 22). These delays indicate that it took some time for the HVC network to settle into a rhythm-generating state after stimulation; moreover, it shows that the rhythm was maintained without external stimulation of the network.
Figure 4.
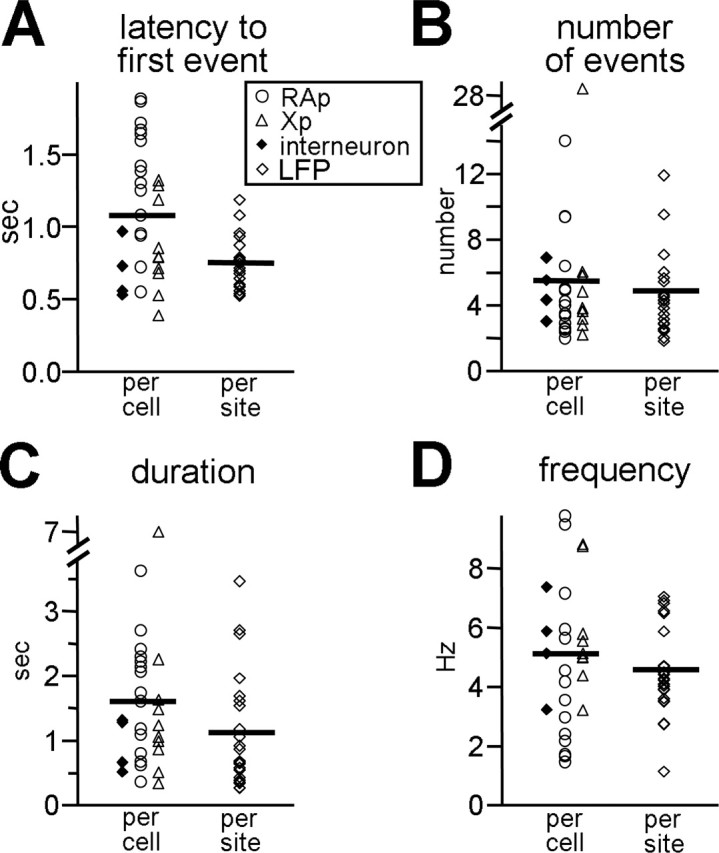
Characteristics of repetitive PSP and LFP timing. A, The mean latency to the first PSP, as measured from the end of the stimulus train, is shown for each cell with symbols; the symbol type refers to the cell type. Similarly, the mean latency to the first LFP is shown for each extracellular recording site at the right (open diamonds). The mean of each population (PSP or LFP) is marked with a thick line. These conventions are the same for B-D. B, The mean number of PSPs or LFPs induced per trial of high-frequency stimulation is shown for each cell and for each site. C, The mean duration of the PSP or LFP epoch, which is the time between the first event and the last event in a trial, is shown for each cell and site. D, The mean frequency of PSP or LFP occurrence within a trial is shown for each cell and site.
Several features of the rhythmic PSPs and LFPs resembled the timing of syllable occurrence within zebra finch song. On average, 5.5 PSPs (n = 29; because the distribution was not normal, we also report the median, 4) and 4.9 LFPs occurred after stimulation (Fig. 4B) (n = 22); these values were similar to the number of syllables within a song motif (mean, 5.4) (Price, 1979). The duration of a stimulus-evoked epoch of repetitive events was long lasting, having a mean value of 1606.3 ms for PSPs (n = 29) and 1121.0 ms for LFPs (Fig. 4C) (n = 22); these epoch durations overlapped with the reported range of motif length (500-1000 ms) (Sossinka and Böhner, 1980) and bout length (0.5-4.5 s) (Franz and Goller, 2003; our observations). The PSP frequency ranged from 1.5 to 10 Hz (mean, 5.1 Hz; n = 29), and the LFP event frequency ranged from 1 to 7 Hz (Fig. 4D) (mean, 4.5 Hz; n = 22); these values were similar to the reported frequencies of syllable occurrence (4-10 Hz) (Price, 1979; Nordeen and Nordeen, 1992; Wang et al., 1999; Brainard and Doupe, 2001). Thus, once stimulated, HVC alone could produce patterns of activity that were consistent with syllable timing during song.
The number, duration, and frequency of repetitive PSPs and LFPs were not significantly different. However, there was a significant difference in latency (unpaired t test; p < 0.0021). This difference may indicate an overestimate of latency in the repetitive PSP measurements: repetitive PSPs arise out of a large, broad depolarization that may have masked earlier events. In examining the qualities of the repetitive PSPs from the three cell types found within HVC, they were found to be highly similar. The number, duration, and frequency of synaptic events did not differ across the three cell types (one-way ANOVA; p > 0.05); however, again, a difference in latency to the first PSP was apparent between RAp cells and the other cell types (Fig. 4A) (one-way ANOVA; p < 0.0021). RAp cells had significantly longer latencies to the first PSP than Xp neurons [Tukey's honestly significant difference (HSD) test; p < 0.0091] and interneurons (Tukey's HSD test; p < 0.0121). Finally, the repetitive events obtained from slices confirmed to lack afferent nuclei (n = 16 for PSPs; n = 8 for LFPs) were similar to those obtained from the remaining slices. No significant differences were found between these two groups in any measurement of repetitive PSPs or LFPs (number per trial, latency to first event, event frequency, or duration of event epoch; unpaired t tests; p > 0.05).
Regularity of rhythmic events
Because song is stereotyped from rendition to rendition, we analyzed the consistency of the patterns of activity across trials of high-frequency stimulation. Figure 5A shows a raster plot of PSP occurrences from one cell after each high-frequency stimulus, aligned to the first PSP occurrence. Although PSP patterns were not perfectly preserved across trials, the intervals between PSPs showed some regularity: the inter-PSP intervals assembled from the responses shown in Figure 5A clustered between 100 and 250 ms (Fig. 5B, gray histogram). To begin analyzing the regularity of PSP timing, we compared the observed distribution of inter-PSP intervals from each cell to a simulated distribution obtained by randomly drawing from the PSP occurrence times of that cell and then calculating the resulting intervals (Fig. 5B, black line) (see Materials and Methods). The distribution of observed intervals shown in Figure 5B was significantly different from the simulated distribution (Kolmogorov-Smirnov goodness of fit test; p < 0.0141). Using this procedure, the observed interval distributions were found to be significantly different from the simulated distribution in 62% of neurons showing repetitive PSPs (18 of 29) and 73% of sites (16 of 22) with repetitive LFPs (Kolmogorov-Smirnov test; p < 0.05). This indicates that the majority of rhythmic events (67% total) evoked in vitro had nonrandom PSP timing.
The evoked PSPs and LFPs also showed more regularity than their simulated counterparts. The observed PSP and LFP interval distributions were significantly narrower than the simulated interval distributions, as measured by the coefficient of variation (CV) of intervals (paired t test; p < 0.0001 for PSPs and LFPs). The mean CV of observed PSP interval distributions was 0.88 (SEM, 0.08), whereas the mean CV of simulated distributions was 1.10 (SEM, 0.06). Similarly, the mean CV for LFP interval distributions was 0.64 (SEM, 0.07), whereas that of the simulated intervals was 0.95 (SEM, 0.05). Notably, the mean CV of observed intervals from the field potential data was significantly less than that obtained from the repetitive PSPs (unpaired t test; p < 0.0308). This difference could indicate that the synchrony across a population of cells decreases with time. As activity becomes uncoordinated, it no longer creates a field potential, but it may still induce postsynaptic responses. Indeed, we found that the variability in PSP and LFP timing across trials increased with time (Fig. 5C). We analyzed this by calculating the SD for onset times of a given event (i.e., first, second, and third events in a trial) across trials; this is illustrated by the rising dotted line in Figure 5C, which plots the SD for PSP times across trials of the cell shown in Figure 5A. This trend was apparent across cells (filled symbols) and LFP sites (open symbols). Thus, event timing was more consistent during the earlier events of a repetitive PSP or LFP epoch. Overall, the rhythmic patterns of PSPs evoked from HVC exhibited some regularity in their timing, suggesting that they were not produced by random barrages of presynaptic activity.
To quantify the degree of stereotypy of activity patterns across trials of repeated high-frequency stimulation, we also calculated the cross-correlation coefficients for all trial pairs. Figure 5D shows the average peak cross-correlation coefficients and corresponding lag times for each cell with repetitive PSPs and for each site with repetitive LFPs. The spread in lag indicates cases in which only portions of an activity pattern were replicated between trials. To compare these values to the regularity of timing of syllable occurrence during singing, we analyzed the songs of five adult zebra finches (10 bouts of song per bird) (see Materials and Methods). The syllable-onset times of an individual song bout were then cross-correlated to the syllable onset times of each of the other bouts; the resulting values were then averaged to give a mean cross-correlation coefficient and mean lag for each bird (Fig. 5E, solid circles). A second analysis excised the individual motifs from the song bouts and cross-correlated the syllable onset times of each motif to each of the other motifs. This procedure eliminated the introductory notes and pauses between successive motifs, thus decreasing some of the timing variability during song bouts. On average, 37 motifs were analyzed per bird (range, 20-50). These motif comparisons resulted in cross-correlation coefficients that were higher and had shorter lags than those obtained from the bout analysis (Fig. 5E, open circles). Figure 5F summarizes the differences in the cross-correlation values obtained from in vitro and behavioral data. There was a significant difference between these groups (one-way ANOVA; p < 0.0001). Specifically, the PSP/LFP group had cross-correlation coefficients that were significantly lower than those of the motif group (Tukey's HSD test; p < 0.001). Also, the motif group had cross-correlation coefficients that were significantly higher than those of the bout group (Tukey's HSD test; p < 0.001). No difference was found between the PSP/LFP and the bout groups. These cross-correlation measurements indicate that the stereotypy of the events recorded in vitro approximated the stereotypy of the timing of syllable occurrence during singing, particularly when taken in the context of a bout of song.
Similar patterned activity was not readily evoked from RA
Stimulation of HVC in vivo can reset ongoing song, whereas similar stimulation in RA does not (Vu et al., 1994). This result located the CPG governing song timing to HVC or its afferent nuclei but did not include a role for RA. Thus, if the rhythmic activity we describe is related to song, we might expect that similar stimulation would not evoke the same kind of activity from RA. To address this, we made field-potential recordings both in HVC and RA from slices in which both nuclei were present. In slices from which we could elicit repetitive LFPs from HVC, the same stimulation in RA did not elicit similar patterns of activity. In 9 of 10 slices, no rhythmic activity could be obtained from RA, despite making at least five passes with the electrode in RA. This incidence of repetitive LFP activity was statistically less than that found in HVC (χ2 test; p < 0.0001). In one slice, some repetitive activity was recorded in the dorsal cap of RA that was distinct from the activity in HVC: the RA field potential number per trial and epoch duration were more than twice anything obtained in the HVC field potential recordings (one-sample test using RA values as hypothesized mean; p < 0.001 for number per trial; p < 0.0001 for duration of epoch). This dorsal part of RA may have rhythmic abilities not shared by the rest of the nucleus (Ashmore et al., 2003). Overall, the differences between HVC and RA in the incidence of evoked rhythmic field activity in vitro suggest that the rhythmic activity in HVC does not necessarily generalize to the rest of the song system.
Excitatory and inhibitory synaptic contributions to rhythmic activity in HVC
To explore the mechanisms underlying this rhythmic activity in HVC, we investigated the contributions of excitatory and inhibitory synaptic transmission to the evoked rhythmic synaptic events. For 23 cells, the stimulation-evoked repetitive PSPs were considered to be EPSPs, because they did not reverse when the cell was depolarized well above ECl (-55 mV; see Materials and Methods). Consistent with this classification, these rhythmic events were also abolished by the AMPA receptor antagonist CNQX (Fig. 6). As expected for EPSPs, the time course of the amplitude change in the presence of CNQX showed a gradual decrease, followed by a gradual increase during drug washout (Fig. 6B). The latency of the few EPSPs that occurred at the start of CNQX application also increased relative to baseline. The number of PSPs evoked by stimulation was decreased significantly in the presence of CNQX to an average of 2.4% of the total elicited in control conditions (Fig. 6C) (n = 8; p < 0.0214; paired t test between control and CNQX conditions).
Figure 6.

Repetitive EPSPs were sensitive to blockade of excitatory and inhibitory synaptic transmission. A, Traces show the responses of a cell to high-frequency stimulation before, during, and after separate applications of 10 μM CNQX and 20 μM BMI. Both receptor antagonists abolished the repetitive EPSPs. Stimulus artifacts are truncated. B, The time course of the changes in evoked EPSP total number (open circles), amplitude (dots), and latency (solid diamonds) is shown. Open and solid triangles track the input resistance (Rin) and resting potential (Vm) of the cell, respectively. Dotted rectangles demarcate the time during which the drugs were applied. Arrowheads mark the difference in recovery amplitude between CNQX and BMI. C, The percentage change in total number of PSPs or LFPs per sweep is indicated for each cell or site in the presence of either 10 μm CNQX or a GABAA antagonist. Lines connect cells that had both antagonists applied sequentially (n = 4). No change from control is represented by 100%.
Unexpectedly, these repetitive EPSPs were also sensitive to a blockade of fast inhibitory transmission. Figure 6, A and B, shows that stimulus-evoked EPSPs were abolished in the presence of the GABAA receptor antagonist, BMI. For the seven cells tested, application of GABAA antagonists significantly decreased the average number of stimulus-evoked EPSPs to only 5.2% of the number obtained under control conditions (Fig. 6C) (n = 7; paired t test between totals in control and those in drug conditions; p < 0.0325). In contrast to the gradual decrease and recovery of EPSP amplitude in CNQX, the time course of amplitude changes in BMI showed an abrupt decrease followed by reappearance at fairly normal size during washout (Fig. 6B, arrowheads). To quantify this trend, we compared the mean amplitude of PSPs in the first trial showing PSPs during drug washout (recovery) with the mean amplitude of PSPs occurring in the trial preceding drug application. For BMI, the mean ratio for recovery amplitude/predrug amplitude was 1.4 (n = 5 cells), whereas for CNQX the mean ratio was 0.5 (n = 4); these mean values were significantly different (unpaired t test; p < 0.0337). These results are consistent with the involvement of polysynaptic inhibitory elements in generating these repetitive EPSPs. Thus, both inhibitory and excitatory synaptic transmission participated in the production of the repetitive PSPs.
Because blockade of inhibition abolished the PSPs, this repetitive synaptic activity was not the result of pathological runaway excitation. Similarly, the repetitive LFPs generated by high-frequency stimulation were also sensitive to blockade of inhibition. In all seven cases, the evoked LFPs were completely suppressed when inhibition was blocked (mean, 0% of control; n = 7; paired t test between predrug and drug conditions; p < 0.0001). Thus, inhibition was critical in producing both types of rhythmic activity in HVC.
A possible model
Figure 7A illustrates a simple model for the generation of repetitive EPSPs that incorporates a role for both synaptic excitation and inhibition. In this model, high-frequency stimulation results in phasic inhibitory output (Fig. 7A, cell 1), which could arise from a variety of mechanisms (see Discussion). The phasic inhibition is received by excitatory cells, where it is transformed into phasic patterns of spiking by cell 2, perhaps through a postinhibitory priming mechanism (Lewicki, 1996; Rosen and Mooney, 2003), through entrainment via interrupting stimulus-induced tonic activity with patterned inhibition (Whittington et al., 1995; Fisahn et al., 1998), or through depolarizing actions of GABA (Gulledge and Stuart, 2003). This pattern of activity produces phasic EPSPs in the downstream cell 3. Thus, in this scenario, inhibition begins and times the rhythmic activity.
Figure 7.

A possible model for repetitive PSP generation. A, The cell labeled 1 represents the phasic inhibitory output of an interneuron. This output drives cell 2 to produce phasic spiking activity, which is then recorded as repetitive EPSPs in cell 3. Arrowheads indicate excitatory transmission, whereas circles indicate inhibitory transmission. See Results for a full description. B, An example of repetitive IPSPs in a RAp neuron; the evoked PSPs were depolarizing at resting potential but reversed when depolarized above ECl. C, The top shows bursting-like activity evoked from an HVC interneuron in response to prolonged depolarizing current injection. The thick line marks spikes that are enlarged in the inset. Calibration: 10 mV, 10 ms. The bottom shows another interneuron that exhibited a long-lasting ADP accompanied by spiking that followed a 500 ms depolarizing current injection. D, For a RAp cell, 100 μm sodium pentobarbital increased the latency to first PSP (solid circles) and decreased the frequency (open circles) of evoked repetitive EPSPs. E, Scatter plots compare the baseline (predrug) values to the values obtained in pentobarbital for latency (left) and frequency (right) for each cell. The diagonal line in each plot marks where the points would lie if these values were equal. Note that for all cells, there was an increase in latency and a decrease in frequency. Symbols indicate the concentration of pentobarbital used: circles, 100 μm; squares, 40 μm; triangles, 20 μm.
As predicted by this model, we observed phasic inhibitory synaptic activity in two cells, one RAp cell and one Xp cell. Figure 7B illustrates an RAp neuron, the repetitive PSPs of which were depolarizing at rest but reversed when the cell was depolarized above ECl; hence, these events were inhibitory. IPSPs have not been reported previously in RAp cells, but we found that they can be regularly elicited with a single stimulus pulse applied to the outflow tract of RAp (and even to RA itself) in vitro (n = 8; data not shown).
We also found evidence of phasic activity intrinsic to some interneurons in HVC. Nine interneurons exhibited bursting during prolonged current injections (Fig. 7C, top). The average frequency of the interburst intervals from these cells was 9.1 Hz (SEM, 1.6), which is within the range of repetitive PSP and LFP frequencies. In addition, four cells exhibited afterdepolarizations (ADPs) at the end of a depolarizing current pulse. An example is shown in Figure 7C (bottom). When a current pulse was delivered of the same duration as the high-frequency stimulation used to evoke repetitive PSPs, this neuron produced an ADP accompanied by spiking that resembled repetitive PSPs in their latency, frequency, and number. Similar plateau potentials have been reported previously for HVC cells (Kubota and Saito, 1991). Thus, some interneurons in HVC exhibit complex intrinsic properties that could give rise to the rhythmic synaptic activity observed here; these types of interneurons differ from the fast-spiking type previously reported in HVC (Dutar et al., 1998; Kubota and Taniguchi, 1998; Mooney, 2000).
If inhibition times the rhythmic activity, then the time course of IPSPs would be expected to influence the pace of rhythmic activity. To test this, we examined the effects of the GABAA agonist sodium pentobarbital on repetitive EPSPs. Sodium pentobarbital increases the open-channel time of GABAA channels, which lengthens the decay time and increases the amplitude of IPSPs (MacDonald and Olsen, 1994). According to our model, this should increase the latency to the first EPSP and slow the frequency of the rhythmic EPSPs. When applied at lower concentrations (20-100 μm), pentobarbital had both of these effects; this is illustrated in Figure 7D for a single cell. The scatter plots in Figure 7E show that all six cells in this experiment exhibited an increase in latency and a decrease in frequency in the presence of pentobarbital. For the group, these changes were significant (p < 0.0027 for latency; p < 0.0062 for frequency by one-tailed paired t tests; n = 6). On average, latency increased by 52.7% above control values, and frequency decreased by 32.5% of control values. At higher concentrations (200 μm), pentobarbital completely abolished the repetitive EPSPs (n = 2), suggesting that enhancing inhibition above a certain level precludes the generation of rhythmic synaptic drive. This result is similar to the effect of BMI on the repetitive PSPs and may be explained by the power of both a GABAA receptor antagonist and a high-enough concentration of a GABAA receptor agonist to prevent the phasic occurrence of inhibitory events. Overall, these data support the notion that inhibition sets the timing of rhythmic activity in the HVC network.
Discussion
We show here that the telencephalic nucleus HVC is capable of generating rhythmic activity when isolated in vitro. High-frequency stimulation evoked rhythmic PSPs and field potentials, which were self-sustaining, in that they occurred with substantial delay from stimulus offset and continued in the absence of phasic stimulation. The timing of the rhythmic synaptic and field potential activity resembled that of syllable occurrence within zebra finch song. The occurrence and timing of the rhythmic activity was governed by inhibition. Thus, HVC itself possesses circuitry that supports pattern generation, a property well suited for mediating song-related processes in vivo.
Possible functions for rhythmicity in HVC
The ability of HVC to produce rhythmic activity in isolation, combined with the similarity of this activity to syllable timing within a song, indicates that HVC has pattern-generating mechanisms appropriate for song-related functions. One possibility is that this evoked rhythmic activity represents a kind of reenactment of the premotor activity that normally drives singing in vivo. Such “fictive” motor patterns have been described in other systems, including those for feeding in crustaceans (Johnson and Hooper, 1992), swimming in lampreys (Grillner, 2003), and breathing in mammals (Rekling and Feldman, 1998). Consistent with such a premotor role, the sustained rhythmic activity described here did not require rhythmic activity from afferent nuclei NIf, Uva, or MMAN, the inputs of which were transected in our brain slices. Birds still sing after lesions to NIf, Uva, or MMAN, suggesting that HVC has some ability to direct singing on its own (McCasland, 1987; Williams and Vicario, 1993; Vu et al., 1995; Hosino and Okanoya, 2000; Foster and Bottjer, 2001; Cardin et al., 2005). Also, we observed repetitive PSPs in RAp cells, which project to premotor neurons in RA. Whereas RAp cells burst only once per motif in vivo (Hahnloser et al., 2002), they could receive multiple PSPs during the motif, firing only for a single suprathreshold PSP. Subthreshold activity may help coordinate the phases of firing between different RAp cells during motif production. Moreover, the repetitive PSPs in interneurons resembled the syllable-related activity recorded for presumed interneurons during singing (McCasland, 1987; Yu and Margoliash, 1996). Also, the rhythmic activity was more readily evoked from HVC than from RA, which parallels the difference between these two nuclei in their ability to reset song behavior (Vu et al., 1994). Finally, the stereotypy measured for the rhythmic activity in HVC was comparable with that of the timing of syllable production, particularly across bouts, but was less stereotyped than isolated motifs. In general, the patterns were not as fixed as those found in classic CPG preparations (Marder and Calabrese, 1996; Grillner, 2003). There could be several reasons for this. First, the reduced nature of our brain-slice preparation, which contained one-third to one-fourth of HVC, could contribute to variability in the evoked patterns. The highly regular patterns of classic CPG networks are obtained in semi-intact preparations, and further reducing these preparations can compromise the regularity of rhythmic activity. For example, removal of neuromodulatory inputs from lamprey spinal cord increases the variability of rhythmic activity (Zhang and Grillner, 2000). Second, electrical stimulation can lead to more variable patterns of activity than chemical stimulation (Cohen and Wallén, 1980). Third, episodic oscillators can show history-dependent variability; evoked feeding-related motor patterns in Aplysia rely on the state of the network at the moment of stimulation (Proekt et al., 2004). An in vitro preparation of HVC that conserves more of the nucleus or its modulatory inputs, or that is stimulated chemically, might result in patterns that more closely match the timing stereotypy seen across motifs of song.
The pattern-generating capability of HVC could also contribute to song perception by helping to shape the complex auditory responses recorded in HVC. Auditory input could combine with the rhythmic abilities in HVC to produce combination-sensitive responses to song stimuli (Margoliash, 1983; Margoliash and Fortune, 1992). Combination-sensitive neurons are tuned to specific sequences of song syllables and, thus, are capable of integrating auditory signals over relatively long timescales. The sustained rhythmic activity described here may contribute to this integration. The rhythmic activity in HVC could also help create predictive signals hypothesized to follow premotor activation of HVC cells (Troyer and Doupe, 2000). In this scenario, the predictive signal (or “efference copy”) is compared with a model song during song learning, and such a signal may need to preserve the phasic patterns characteristic of auditory activity. Finally, rhythmic activity may help gate sensory feedback, as described in spinal pattern generation (Sillar, 1991). Thus, the rhythmic properties of HVC could also contribute to auditory or sensorimotor processes.
In other in vitro systems, rhythmic activity generated in the telencephalon has been related to seizures (Connors, 1984), tremor (Plenz and Kitai, 1999), motor-related oscillations (Vergara et al., 2003), sensory processing (gamma frequencies) (Whittington et al., 1995), memory (theta frequencies) (Buzsáki, 2002), and slow-wave sleep (Sanchez-Vives and McCormick, 2000). The rhythmic activity we report here is distinguished from some of these states by its frequency; it is faster than oscillations recorded during slow-wave sleep and tremor (<1 Hz) and slower than gamma frequencies (∼40 Hz). Importantly, the rhythmic activity in HVC was unlikely caused by pathological seizure activity, because it was eliminated when inhibition was blocked; thus, the rhythm was not the outcome of runaway excitation. Additional mechanistic studies of this rhythmic activity in HVC will enable comparisons with other rhythms of similar frequency and lead to insights into the complex dynamics of HVC circuitry and its function, perhaps in ways not apparent from studies of a quiescent network.
Mechanisms underlying rhythmic synaptic activity in HVC
Our basic model for the rhythmic activity in HVC involves phasic inhibition of excitatory cells, which then causes patterned PSP (or spike) activity in postsynaptic HVC cells. As in other rhythm-generating networks (Marder and Calabrese, 1996), inhibition is crucial to the HVC rhythm. Phasic inhibition could result from intrinsic phasic properties of some interneurons, such as bursting. We found interneurons in HVC that could burst repetitively with appropriate interburst frequencies. Alternatively, phasic inhibitory patterns may be an emergent property, arising from reciprocally connected interneurons or reciprocally connected interneurons and excitatory cells. The gradual slowing of the repetitive PSP rhythm induced by pentobarbital favors the idea that the HVC rhythm is an emergent property of the network. The cells downstream of the inhibitory output (cells 2 and 3 in the model) could be RAp or Xp neurons; both displayed repetitive IPSPs, as expected for cell 2, and both exhibited excitatory EPSPs, as expected for cell 3. Although these projection neurons did not display prominent phasic suprathreshold activity, in other systems, robust oscillatory field activity can occur with individual cells spiking in <5% of rhythm cycles (Fisahn et al., 1998). Moreover, the rhythmic field potentials indicate that a population of cells in HVC fire rhythmically in response to high-frequency stimulation.
High-frequency stimulation might evoke rhythmic activity by exciting a sufficient number of cells within HVC or by inducing the release of an endogenous substance that enables rhythmic network properties. HVC is rich with neuromodulators, receiving dopaminergic, noradrenergic, cholinergic, and vasoactive intestinal polypeptide-positive inputs, as well as possessing somata containing met-enkephalin and somatostatin (Zuschratter and Scheich, 1990; Bottjer, 1993; Bottjer and Alexander, 1995; Bottjer et al., 1997; Mello et al., 1998). Understanding the effects of these neuromodulators on rhythmic activity generated in vitro will help identify candidates for initiating and modulating rhythmic output of the HVC network in vivo.
A CPG network for song
Regardless of the precise function of the rhythmic activity found in HVC in vitro, song production is likely controlled by a CPG network that includes HVC. Although HVC could drive song production on its own, the CPG for song may be distributed across several song nuclei. For example, afferent inputs could trigger or modulate HVC rhythms or even select different motor patterns in birds with multiple song repertoires. If these afferent nuclei possess any rhythmic properties of their own, the neural control of song may rely on multiple, interacting CPGs, which could control different aspects of song timing or provide redundancy. Interactions between rhythmic circuits occur in the crab stomatogastric ganglion (Bartos et al., 1999) and between segmental oscillators in lamprey spinal cord (Grillner, 2003).
In other species, CPG networks mediate vocalizations. Un-learned vocal outputs such as calling in frogs (Schmidt, 1992) and crowing in quails (Shaw, 2000) are produced by rhythmic neural activity in the brainstem. In contrast, the CPG network for song includes the telencephalon, where HVC lies. The role of the telencephalon may reflect the learned nature of song, which involves memorization of a tutor song and use of auditory feedback to correct self-generated vocalizations. Similarly, aspects of human speech production are governed by CPGs (Gracco and Abbs, 1988) potentially located in the telencephalon. A previous study of patients with deficits in speech articulation implicated a region of insular cortex in organizing sequence and timing of speech movements (Dronkers, 1996). The CPG network governing song must also interact with respiratory centers, because vocalization is coordinated with expiration (Suthers, 1997). Moreover, sensory feedback is likely to influence (although not drive) the final pattern produced by a song CPG, because song is a learned behavior that relies heavily on auditory feedback. Sensitivity to auditory feedback by the song CPG could account for the variability in song patterns observed during learning and in other species, such as Bengalese finches. The song system presents a unique opportunity to explore how the telencephalon organizes the production of learned vocalizations and can lend insight into the motor control of other sequenced and patterned behaviors.
Footnotes
This work was supported by a National Research Service award (MH12344) and a Burroughs Wellcome Fund Career award to M.M.S. and by grants from the National Institutes of Health (MH56646, MH066128, and MH068530) and the University of Washington Royalty Research Fund to D.J.P. We thank Dawn Blitz, Michael Farries, Abigail Person, Jeffry Isaacson, Fred Rieke, and Jane Sullivan for helpful comments on previous versions of this manuscript. We also thank Emily Terrell for assistance with song analysis.
Correspondence should be addressed to Michele M. Solis, Departments of Biology and Otolaryngology, University of Washington, Box 356515, 1959 Northeast Pacific Street, Seattle, WA 98195-6515. E-mail: solis@u.washington.edu.
Copyright © 2005 Society for Neuroscience 0270-6474/05/252811-12$15.00/0
References
- Ashmore RC, Nealen PM, Schmidt MF (2003) Disruption of song production from microstimulation in forebrain nuclei in birds with unilateral RA lesions. Soc Neurosci Abstr 29: 942.9. [Google Scholar]
- Bartos M, Manor Y, Nadim F, Marder E, Nusbaum MP (1999) Coordination of fast and slow rhythmic neuronal circuits. J Neurosci 19: 6650-6660. [DOI] [PMC free article] [PubMed] [Google Scholar]
- Bottjer SW (1993) The distribution of tyrosine hydroxylase immunoreactivity in the brains of male and female zebra finches. J Neurobiol 24: 51-69. [DOI] [PubMed] [Google Scholar]
- Bottjer SW, Alexander G (1995) Localization of met-enkephalin and vasoactive intestinal polypeptide in the brains of male zebra finches. Brain Behav Evol 45: 153-177. [DOI] [PubMed] [Google Scholar]
- Bottjer SW, Arnold AP (1984) The role of feedback from the vocal organ I. Maintenance of stereotypical vocalizations by adult zebra finches. J Neurosci 4: 2387-2396. [DOI] [PMC free article] [PubMed] [Google Scholar]
- Bottjer SW, Meisner EA, Arnold AP (1986) Changes in neuronal number, density and size account for increases in volume of song-control nuclei during song development in zebra finches. Neurosci Lett 67: 263-268. [DOI] [PubMed] [Google Scholar]
- Bottjer SW, Roselinsky H, Tran NB (1997) Sex differences in neuropeptide staining of song-control nuclei in zebra finch brains. Brain Behav Evol 50: 284-303. [DOI] [PubMed] [Google Scholar]
- Brainard MS, Doupe AJ (2001) Postlearning consolidation of birdsong: stabilizing effects of age and anterior forebrain lesions. J Neurosci 21: 2501-2517. [DOI] [PMC free article] [PubMed] [Google Scholar]
- Brenowitz EA (1991) Altered perception of species-specific song by female birds after lesions of a forebrain nucleus. Science 251: 303-305. [DOI] [PubMed] [Google Scholar]
- Buzsáki G (2002) Theta oscillations in the hippocampus. Neuron 33: 325-340. [DOI] [PubMed] [Google Scholar]
- Cardin JA, Raskin JN, Schmidt MF (2005) The sensorimotor nucleus NIf is necessary for auditory processing but not vocal motor output in the avian song system. J Neurophysiol, in press. [DOI] [PubMed]
- Cohen AH, Wallén P (1980) The neuronal correlate of locomotion in fish: “fictive swimming” induced in an in vitro preparation of the lamprey spinal cord. Exp Brain Res 41: 11-18. [DOI] [PubMed] [Google Scholar]
- Connors B (1984) Initiation of synchronized neuronal bursting in neocortex. Nature 310: 685-687. [DOI] [PubMed] [Google Scholar]
- Doupe AJ, Kuhl PK (1999) Birdsong and human speech: common themes and mechanisms. Annu Rev Neurosci 22: 567-631. [DOI] [PubMed] [Google Scholar]
- Dronkers NF (1996) A new brain region for coordinating speech articulation. Nature 384: 159-161. [DOI] [PubMed] [Google Scholar]
- Dutar P, Vu HM, Perkel DJ (1998) Multiple cell types distinguished by physiological, pharmacological and anatomical properties in nucleus HVc of the adult zebra finch. J Neurophysiol 80: 1828-1838. [DOI] [PubMed] [Google Scholar]
- Fisahn A, Pike FG, Buhl EH, Paulsen O (1998) Cholinergic induction of network oscillations at 40 Hz in the hippocampus in vitro Nature 394: 186-189. [DOI] [PubMed] [Google Scholar]
- Fortune ES, Margoliash D (1995) Parallel pathways and convergence onto HVc and adjacent neostriatum of adult zebra finches (Taeniopygia guttata). J Comp Neurol 360: 413-441. [DOI] [PubMed] [Google Scholar]
- Foster EF, Bottjer SW (2001) Lesions of a telencephalic nucleus in male zebra finches: influences on vocal behavior in juveniles and adults. J Neurobiol 46: 142-165. [DOI] [PubMed] [Google Scholar]
- Franz M, Goller F (2003) Respiratory patterns and oxygen consumption in singing zebra finches. J Exp Biol 206: 967-978. [DOI] [PubMed] [Google Scholar]
- Gracco VL, Abbs JH (1988) Central patterning of speech movements. Exp Brain Res 71: 515-526. [DOI] [PubMed] [Google Scholar]
- Grillner S (2003) The motor infrastructure: from ion channels to neuronal networks. Nat Rev Neurosci 4: 573-586. [DOI] [PubMed] [Google Scholar]
- Gulledge A, Stuart G (2003) Excitatory actions of GABA in the cortex. Neuron 37: 299-309. [DOI] [PubMed] [Google Scholar]
- Hahnloser R, Kozhevnikov A, Fee MS (2002) An ultra-sparse code underlies the generation of neural sequences in a songbird. Nature 419: 65-70. [DOI] [PubMed] [Google Scholar]
- Hosino T, Okanoya K (2000) Lesion of a higher-order song nucleus disrupts phrase level complexity in Bengalese finches. NeuroReport 11: 2091-2095. [DOI] [PubMed] [Google Scholar]
- Johnson BR, Hooper SL (1992) Overview of the stomatogastric nervous system. In: Dynamic biologial networks: the stomatogastric nervous system (Harris-Warrick RM, Marder E, Selverston A, Moulins M, eds), pp 1-30. Cambridge, MA: MIT.
- Konishi M (1965) The role of auditory feedback in the control of vocalization in the white-crowned sparrow. Z Tierpsychol 22: 770-783. [PubMed] [Google Scholar]
- Kubota M, Saito N (1991) Sodium- and calcium-dependent conductances of neurones in the zebra finch hyperstriatum ventrale pars caudale in vitro J Physiol (Lond) 440: 131-142. [DOI] [PMC free article] [PubMed] [Google Scholar]
- Kubota M, Taniguchi I (1998) Electrophysiological characteristics of classes of neuron in the HVc of the zebra finch. J Neurophysiol 80: 914-923. [DOI] [PubMed] [Google Scholar]
- Lewicki MS (1996) Intracellular characterization of song-specific neurons in the zebra finch auditory forebrain. J Neurosci 16: 5854-5863. [PubMed] [Google Scholar]
- MacDonald RL, Olsen RW (1994) GABAA receptor channels. Annu Rev Neurosci 17: 569-602. [DOI] [PubMed] [Google Scholar]
- Marder E, Calabrese RL (1996) Principles of rhythmic motor pattern generation. Physiol Rev 76: 687-717. [DOI] [PubMed] [Google Scholar]
- Margoliash D (1983) Acoustic parameters underlying the responses of song-specific neurons in the white-crowned sparrow. J Neurosci 3: 1039-1057. [DOI] [PMC free article] [PubMed] [Google Scholar]
- Margoliash D, Fortune ES (1992) Temporal and harmonic combination-sensitive neurons in the zebra finch's HVc. J Neurosci 12: 4309-4326. [DOI] [PMC free article] [PubMed] [Google Scholar]
- McCasland JS (1987) Neuronal control of bird song production. J Neurosci 7: 23-39. [DOI] [PMC free article] [PubMed] [Google Scholar]
- Mello CV, Pinaud R, Ribeiro S (1998) Noradrenergic system of the zebra finch brain: immunocytochemical study of dopamine-β-hydroxylase. J Comp Neurol 400: 207-228. [PubMed] [Google Scholar]
- Mooney R (2000) Different subthreshold mechanisms underlie song selectivity in identified HVc neurons of the zebra finch. J Neurosci 20: 5420-5436. [DOI] [PMC free article] [PubMed] [Google Scholar]
- Nordeen KW, Nordeen EJ (1992) Auditory feedback is necessary for the maintenance of stereotyped song in adult zebra finches. Behav Neural Biol 57: 58-66. [DOI] [PubMed] [Google Scholar]
- Nottebohm F, Stokes TM, Leonard CM (1976) Central control of song in the canary, Serinus canarius J Comp Neurol 165: 457-486. [DOI] [PubMed] [Google Scholar]
- Nottebohm F, Kelley DB, Paton JA (1982) Connections of vocal control nuclei in the canary telencephalon. J Comp Neurol 207: 344-357. [DOI] [PubMed] [Google Scholar]
- Plenz D, Kitai ST (1999) A basal ganglia pacemaker formed by the subthalamic nucleus and external globus pallidus. Nature 400: 677-682. [DOI] [PubMed] [Google Scholar]
- Price PH (1979) Developmental determinants of structure in zebra finch song. J Comp Physiol Psychol 93: 260-277. [Google Scholar]
- Proekt A, Brezina V, Weiss KR (2004) Dynamical basis of intentions and expectations in a simple neuronal network. Proc Natl Acad Sci USA 101: 9447-9452. [DOI] [PMC free article] [PubMed] [Google Scholar]
- Reiner A, Perkel DJ, Bruce LL, Butler AB, Csillag A, Kuenzel W, Medina L, Paxinos G, Shimizu T, Striedter G, Wild M, Ball GF, Durand S, Güntürkün O, Lee DW, Mello CV, Powers A, White SA, Hough G, Kubikova L, et al. (2004) Revised nomenclature for avian telencephalon and some related brainstem nuclei. J Comp Neurol 473: 377-414. [DOI] [PMC free article] [PubMed] [Google Scholar]
- Rekling JC, Feldman JL (1998) PreBötzinger complex and pacemaker neurons: hypothesized site and kernel for respiratory rhythm generation. Annu Rev Physiol 60: 385-405. [DOI] [PubMed] [Google Scholar]
- Rosen MJ, Mooney R (2003) Inhibitory and excitatory mechanisms underlying auditory responses to learned vocalizations in the songbird nucleus HVC. Neuron 39: 177-194. [DOI] [PubMed] [Google Scholar]
- Ruby NF, Burns DE, Heller HC (1999) Circadian rhythms in the suprachiasmatic nucleus are temperature-compensated and phase-shifted by heat pulses in vitro J Neurosci 19: 8630-8636. [DOI] [PMC free article] [PubMed] [Google Scholar]
- Sanchez-Vives MV, McCormick DA (2000) Cellular and network mechanisms of rhythmic recurrent activity in neocortex. Nat Neurosci 3: 1027-1034. [DOI] [PubMed] [Google Scholar]
- Schmidt RS (1992) Neural correlates of frog calling: production by two semi-independent generators. Behav Brain Res 50: 17-30. [DOI] [PubMed] [Google Scholar]
- Shaw BK (2000) Involvement of a midbrain vocal nucleus in the production of both the acoustic and postural components of crowing behavior in Japanese quail. J Comp Physiol [A] 186: 747-757. [DOI] [PubMed] [Google Scholar]
- Sillar KT (1991) Spinal pattern generation and sensory gating mechanisms. Curr Opin Neurobiol 1: 583-589. [DOI] [PubMed] [Google Scholar]
- Sossinka R, Böhner J (1980) Song types in the zebra finch Poephila guttata castanotis Z Tierpsychol 53: 123-132. [Google Scholar]
- Suthers RA (1997) Peripheral control and lateralization of birdsong. J Neurobiol 33: 632-652. [PubMed] [Google Scholar]
- Thomson A, Deuchars J, West D (1993) Large, deep layer pyramid-pyramid single axon EPSPs in slices of rat motor cortex display paired pulsed and frequency-dependent depression, mediated presynaptically and self-facilitation, mediated postsynaptically. J Neurophysiol 70: 2354-2369. [DOI] [PubMed] [Google Scholar]
- Troyer TW, Doupe AJ (2000) An associational model of birdsong sensorimotor learning. I. Efference copy and the learning of song syllables. J Neurophysiol 84: 1204-1223. [DOI] [PubMed] [Google Scholar]
- Vergara R, Rick C, Hernandez-Lopez S, Laville JA, Guzman JN, Galarraga E, Surmeier DJ, Bargas J (2003) Spontaneous voltage oscillations in striatal projection neurons in a rat corticostriatal slice. J Physiol (Lond) 553: 169-182. [DOI] [PMC free article] [PubMed] [Google Scholar]
- Vicario DS (1991) Contributions of syringeal muscles to respiration and vocalization in the zebra finch. J Neurobiol 22: 63-73. [DOI] [PubMed] [Google Scholar]
- Vicario DS, Simpson HB (1995) Electrical stimulation in forebrain nuclei elicits learned vocal patterns in songbirds. J Neurophys 73: 2602-2607. [DOI] [PubMed] [Google Scholar]
- Vu ET, Mazurek ME, KuoYC (1994) Identification of a forebrain motor programming network for the learned song of zebra finches. J Neurosci 14: 6924-6934. [DOI] [PMC free article] [PubMed] [Google Scholar]
- Vu ET, Kuo Y, Chance FS (1995) Effects of lesioning nucleus interfacialis on adult zebra finch song. Soc Neurosci Abstr 21: 382.18. [Google Scholar]
- Wang N, Aviram R, Kirn JR (1999) Deafening alters neuron turnover within the telencephalic motor pathway for song control in adult zebra finches. J Neurosci 19: 10554-10561. [DOI] [PMC free article] [PubMed] [Google Scholar]
- Whittington MA, Traub RD, Jefferys JGR (1995) Synchronized oscillations in interneuron networks driven by metabotropic glutamate receptor activation. Nature 373: 612-615. [DOI] [PubMed] [Google Scholar]
- Williams H, Vicario DS (1993) Temporal patterning of song production: participation of nucleus uvaeformis of the thalamus. J Neurobiol 24: 903-912. [DOI] [PubMed] [Google Scholar]
- Yu AC, Margoliash D (1996) Temporal hierarchical control of singing in birds. Science 273: 1871-1875. [DOI] [PubMed] [Google Scholar]
- Zhang W, Grillner S (2000) The spinal 5-HT system contributes to the generation of fictive locomotion in lamprey. Brain Res 879: 188-192. [DOI] [PubMed] [Google Scholar]
- Zuschratter W, Scheich H (1990) Distribution of choline acetyltransferase and acetylcholinesterase in the vocal motor system of zebra finches. Brain Res 513: 193-201. [DOI] [PubMed] [Google Scholar]