

Abstract
A transgenic mouse line (Oligo-TTK) was established to monitor oligodendrocyte cell death and myelin formation in the CNS. The expression of a conditionally toxic gene, the herpes simplex virus-1 thymidine kinase (HSV1-TK), was made under control of the MBP (myelin basic protein) gene promoter. A truncated form of the HSV1-TK (TTK) gene was used to avoid both bystander effect resulting from leaking in thymidine kinase activity and sterility in transgenic males observed in previous transgenic mice. The transgene was expressed in the CNS with a restricted localization in oligodendrocytes. Oligodendrocyte proliferation and myelin formation are therefore tightly controlled experimentally by administration of ganciclovir (GCV) via the induction of oligodendrocyte cell death. The most severe and irreversible hypomyelination was obtained when GCV was given daily from postnatal day 1 (P1) to P30. Oligodendrocyte plasticity and myelin recovery were analyzed in another phenotype generated by GCV treatment from P1 to P15. In this model, after dysmyelination, an apparent normal behavior was restored with no visible pathological symptoms by P30. Proliferating cells, which may be implicated in myelin repair in this model, are detected primarily in myelin tracts expressing the oligodendrocyte phenotype. Therefore, the endogenous potential of oligodendrocytes to remyelinate was clearly demonstrated in the mice of this study.
Keywords: oligodendrocytes, cell death, toxic gene, dysmyelination, myelin recovery, axonal abnormality
Introduction
The study of myelin and the various factors leading to anomalies of the myelin in vivo requires animal models in which we can cause lesions to mimic several human pathologies.
A variety of experimental animal models to produce demyelination has been described. Ethidium bromide (Yajima and Suzuki, 1979), lysolecithin (Hall, 1972), cuprizone (Blakemore, 1973; Hiremath et al., 1998), and viral infection in animal (Martin and Nathanson, 1979; Dal Canto and Rabinowitz, 1982; Stohlman and Hinton, 2001; Fazakerley and Walker, 2003) were extensively used. Other models, involving experimental allergic encephalomyelitis, have been widely produced (Swanborg, 1995; Bradl and Linington, 1996; Stefferl et al., 2000). In addition, several spontaneous mutations of myelin genes are at the origin of myelin disorders in human (Snipes et al., 1993) and in jimpy, quaking, and shiverer mice (Friedrich, 1975; Roach et al., 1983, Nave et al., 1986; Ghandour and Skoff, 1988; Hardy, 1998). Transgenic mice with silenced or overexpressed myelin genes were also used, and valuable information on the role of myelin proteins during development and in the adult were obtained (Kagawa et al., 1994; Nave, 1994; Readhead et al., 1994; Klugmann et al., 1997; Uschkureit et al., 2000).
A useful approach to selective targeting of cells in vivo using transgenic techniques to express diphtheria toxin has been previously used to study cell lineage and cellular interactions in different body organs (Breitman et al., 1987; Palmiter et al., 1987; Lem et al., 1991; Messing et al., 1992; Smeyne et al., 1995). Unfortunately, the strong lethal effect of diphtheria toxin limited the study on this model.
The expression of an inducible toxicity gene, thymidine kinase of the herpes simplex virus-1 (HSV1-TK), has been successfully used to target a wide number of cells in vivo and in vitro (Caruso and Klatzmann, 1992; Wallace et al., 1994; Bush et al., 1998; Xie et al., 2002; Fillat et al., 2003). Indeed, the thymidine kinase (TK) system is based on the capacity of the HSV1-TK to phosphorylate certain nucleoside analogs such as ganciclovir (GCV) (Heyman et al., 1989; Salomon et al., 1994; Delaney et al., 1996). Phosphorylated GCV is a potent toxic metabolite for dividing cells. It is incorporated into elongating DNA by cellular DNA polymerase and induces chain termination and eventually cell death (Furman et al., 1980; St Clair et al., 1987). This system offers valuable advantages of allowing a controlled cell ablation for precise times and durations.
In the present study, a viable transgenic mouse, with normal phenotype that harbors the HSV1-TK gene was generated. A functionally truncated transgene (TTK) used in the minigene construct resulted in a restricted expression in oligodendrocytes, under the control of MBP promoter, without any visible bystander effects. In addition, the sterility of males noticed in previous transgenic mice (Ghandour et al., 1995, 2002; Mathis et al., 2000) was avoided. Two paradigms are described in the present paper: the first one exhibits a severe and irreversible dysmyelination in the CNS, and the other one is characterized by transient loss of myelin and then recovery.
Materials and Methods
Transgene construction and transgenic mouse production. DNA fragment containing a truncated form of HSV1-TK gene (TTK) (1.1 kb) and simian virus 40 poly(A) was cut out from the plasmid pLTR-TTK (a generous gift from Dr. D. Klatzmann, Pitié Salpêtrière, Paris, France) after digestion with BglII/EcoRI enzymes (New England Biolabs, Beverly, MA). TTK-poly(A) fragment was then inserted in the plasmid pMSPI containing 1.3 kb MBP promoter (a generous gift from Dr. M. Kimura, Department of DNA Biology, Tokai University, Kanagawa, Japan) using BamHI/EcoRI enzymes (New England Biolabs). Final fragment, 3.1 kb, BglII/EcoRI was cut from agarose gel and then purified using DNA Wizard purification columns (Promega, Madison, WI). Purified DNA at 1.5 ng/μl in Tris-EDTA buffer (5 mm Tris, 0.1 mm EDTA, pH 7.4) was prepared for microinjection. One hundred fifty mouse embryos, FVB strain, received the DNA fragment by microinjection (Eurogentec, Seraing, Belgium). Six founder mice from 41 mice were identified by TTK gene integration in genomic DNA by PCR using specific primers (see below). Only two mouse lines were identified to express TTK mRNA in the brain. All of the animal experiments were performed under supervision of authorized investigators.
Genotyping of transgenic mice. Genomic DNA was extracted from tail biopsies using Easy-DNA kit (Invitrogen, San Diego, CA) according to the manufacturer's instructions. DNA (0.5 μg) was then subjected to 35 cycles of PCR with the following specific primers for HSV1-TTK: forward, 5′-GCTATGCTGGCTGCGATTCG, and reverse, 5′-ATATCGTCGGTATGGAGCCG. As expected, a 397 bp fragment was visualized in transgenic mice after electrophoresis of PCR products in 1.5% agarose gel stained with ethidium bromide under UV illumination and photographed with Alpha Imager system (Alpha Innotech, San Leandro, CA).
GCV treatment. Transgenic neonatal mice received a daily subcutaneous injection of sterile GCV solution (Roche Products, Welwyn Garden City, UK) in 0.9% NaCl solution; the dose was 50 μg/g body weight per day. Wild-type mice received a similar injection.
Three groups of mice were treated separately with GCV. Group I contained pups treated daily from postnatal day 1 (P1) to P28 and examined at 28 d. Group II contained four subgroups, with pups treated daily from P1 to P7, from P7 to P14, from P14 to P21, and from P1 to 28. In group II, mice were examined at 7, 14, 21, and 28 d. Group III contained pups treated daily with GCV from P1 to P15, and examined at 15, 30, and 60 d postnatal.
Tissue processing and histological analysis. Mice were killed under pentobarbitone anesthesia by perfusion through the left ventricle of 4% paraformaldehyde (PFA) freshly prepared in 0.1 m PBS. Brains were then removed and kept overnight at 4°C in the same fixative. Eighty micrometer serial sagittal sections from transgenic and wild-type mice were performed using vibratome (Technical Products International, St. Louis, MO). Sections were then kept at 4°C overnight in 2× SSC or PBS buffers.
Electron microscopy. For the electron microscopy experiments, animal were perfused with 2% PFA and 2% glutaraldehyde (Sigma, St. Louis, MO) in 0.1 m PBS. Brains were removed and kept for 2 h in the same fixative. Two hundred micrometer sagittal sections were performed by vibratome. Tissue sections were extensively washed with PBS and then were postfixed in 1% osmium tetroxide for 2 h. Afterward, sections were dehydrated in alcohols. After embedding in epoxy resin, 1 μm thin sections were performed and stained with toluidine blue, and 60 nm ultrathin sections were examined with the transmission electron microscope Siemens (Erlangen, Germany) Elmiskop 102 at 60 kV.
RNA preparation. Total RNA was extracted from the different tissues using TRIzol reagent according to the manufacturer's instructions (Invitrogen). Briefly, each tissue sample was weighted and homogenized in 1 ml of TRIzol per 100 mg of tissue, and then 0.2 ml of chloroform was added. After centrifugation, RNAs were precipitated from the aqueous phase by mixing with isopropanol, washed with ethanol, and finally resuspended at 1 μg/μlinH2O-DEPC. To prevent the presence of contaminating DNA, RNAs were treated with RNase-free DNase I (7.5 U/μg RNA) (Amersham Biosciences, Les Ulis, France) in DNase buffer [50 mm Tris-HCl, pH 7.5, 10 mm MgCl2, 50 μg/ml bovine serum albumin (BSA) RNase/DNase-free] for 30 min at 37°C.
Reverse transcription-PCR. One microgram of total RNA was reverse transcribed in the presence of 0.5 μg of Oligo(dT)15 primer (Promega) for 1 h at 37°C using Omniscript reverse transcriptase kit (Qiagen, Hilden, Germany) according to the manufacturer's instructions. The total volume of a reverse transcription (RT) reaction was 20 μl. One microliter of first-strand cDNA was then subjected to 25 μl PCR performed on Eppendorf Master Cycler (Eppendorf, Wesseling-Berzdorf, Germany) with the following conditions: 95°C for 3 min (1 cycle); 95°C for 30 s, 62°C for 1 min; 72°C for 30 s (30 cycles); and 72°C for 10 min (1 cycle). The PCR solution, pH 9, contained 10 mm Tris-HCl, 50 mm KCl, 1.5 mm MgCl2, 200 μm desoxyribonucleoside 5′-triphosphate, and 0.06 U/μl of Taq polymerase (Amersham Biosciences), and 12.5 pmol of each primer (see supplemental material, available at www.jneurosci.org).
Semiquantification of RT-PCR products. RT-PCR products of the interest genes of 7-, 14-, and 21-d-old GCV-treated and wild-type mice were grouped and analyzed simultaneously. We used three animals for each age. The same numbers of wild-type mice were used. All of the reactions were repeated three times with different RT reactions.
The samples were quantified, and we used glyceraldehyde 3-phosphate dehydrogenase (GAPDH) mRNA level to control the efficiency of the RNA extraction, its integrity, the amount of RNA present, and the efficiency of the RT-PCR. To determine the linear-response range of each reaction, all of the reactions were compared at 20, 24, 26, 30, 32, and 35 cycles. Finally, RT products were selectively diluted to normalize for GAPDH expression levels until all of the templates showed equal GAPDH signal.
Products were visualized using ethidium bromide-stained, 1.5% agarose gels run with 100 bp DNA marker (Fermentas, St. Leon-Rot, Germany), and images were captured using AlphaImager UV system (Alpha Innotech). The average level of gene expression in wild-type animals was arbitrarily taken as 100% and was then compared with the corresponding values from the treated transgenic mice.
Immunohistochemistry. Free-floating sections were treated with 0.1 m PBS, pH 7.4, containing 0.3% Triton X-100 for 15 min at room temperature (rt) and rinsed in PBS three times for 5 min each time. For proliferating cell nuclear antigen (PCNA) immunodetection, sections were boiled two times for 30 s each time in a microwave in citrate buffer, pH 6, before incubation with mouse monoclonal anti-PCNA antibody (1:100). Sections were incubated overnight at 4°C with primary antibodies at the appropriate dilution in PBS containing 1% normal goat serum (NGS). Antibodies used were as follows: rabbit anti-HSV1-TK (1:200; a polyclonal anti-TK antibody was generated in our laboratory by immunizing rabbits with KLH-conjugated C-terminal peptide corresponding to amino acids CDLARTAREMGEAN of HSV1-TK); mouse monoclonal anti-MBP (1:200; generated in our laboratory); rabbit anti-carbonic anhydrase II (CA II) (1:200; generated in our laboratory); mouse anticaspase-3 (1:200; R&D Systems, Minneapolis, MN); rabbit anti-GFAP (1:300; DakoCytomation, Glostrup, Denmark); mouse monoclonal anti-PCNA (1:100; clone PC10; Santa Cruz Biotechnology, Santa Cruz, CA); guinea pig anti-NG2 (1:200; generously provided by Dr. W. Stallcup, Developmental Neurobiology, The Burnham Institute, La Jolla, CA); and monoclonal antibody (O10) to proteolipid protein (PLP) (1:10; generous gift from Dr. K. A. Nave, Neurogenetics, Göttingen, Germany).
Sections were rinsed three times in PBS and incubated with secondary antibodies: Alexa Fluor 488-, Alexa Fluor 546-coupled anti-rabbit or anti-mouse IgG antibodies (Molecular Probes, Eugene, OR) at a dilution of 1:200 for 2 h at rt before washing in PBS and mounting in AquaPoly/Mount (Polysciences, Warrington, PA). As a control for immunohistochemistry staining, the primary antibody was omitted. For the double labeling experiments, we repeated the same steps using the other primary antibody and a different secondary one.
In situ hybridization. In situ hybridization was made as described previously (Jalabi et al., 2003). Briefly, sections were washed in 0.1 m TBS, pH 7.5, two times for 10 min at rt, treated with 0.5% Triton X-100 (Sigma) for 15 min at rt, and then briefly washed in the same buffer. Sections were treated with 10 μg/ml proteinase K (Invitrogen) in 0.1 m Tris buffer, pH 8, and 0.05 m EDTA for 10 min at 37°C, immersed in 0.1 m triethanolamine (TEA) for 10 min, and in 0.25% acetic anhydride in 0.1 m TEA for 15 min, and then washed in TBS. One microliter of 1:2 diluted labeled probe was added to 100 μl of prehybridization solution (50% formamide, 2× SSC, 5% dextran sulfate, 1× Denhardt's, and 0.1 mg/ml salmon testis DNA), boiled for 10 min, and snap-cooled on ice (see supplemental material, available at www.jneurosci.org).
Sections were incubated in the above hybridization solution overnight at 40°C. The next day, the sections were briefly washed in 4× SSC, followed by two sequential washes of 15 min in 2× SSC, 1× SSC, and 0.5× SSC. After three washes of 10 min in 0.1 m Tris buffer, tissue-nonspecific binding was blocked by incubation of sections in 3% DNA blocking solution (Roche Products) for 1 h at rt. Sections were rinsed in TBS and incubated with alkaline phosphatase (AP)-labeled anti-digoxigenin (Dig) antibodies (anti-digoxigenin-AP; Fab fragments; Roche Products) at 1:200 dilution in 1× Denhardt's in TBS at rt for 1 h. Sections were then washed in TBS three times for 10 min and finally with 0.1 m Tris-HCl, 0.1 m NaCl, 0.05 m MgCl2, pH 9.5, buffer (TBS 9.5). The color was developed in TBS 9.5 in the presence of nitroblue tetrazolium and 5-bromo-4-chloro-3-indolyl phosphate (Roche Products) for 30 min to 1 h. Sections were rinsed several times in TBS and then mounted on glass slides with AquaPoly/Mount (Polysciences). Controls for in situ hybridization consisted of sections incubated in prehybridization solution without adding cDNA probes. Other control experiments were performed using sense Dig-labeled probes.
Bromodeoxyuridine immunodetection. Animals were received an intraperitoneal injection of bromodeoxyuridine (BrdU) (50 μg/g body weight) in 0.9% NaCl and killed under anesthesia 2 or 12 h after injection. After perfusion and postfixation, sections were made as above and were treated with 2 N HCl for 1 h at rt, neutralized with 0.1 m sodium borate, pH 8.5, two times for 15 min each time. After 10 min washing with PBS, sections were incubated overnight with 1:25 mouse monoclonal antibody to BrdU (Roche Products) in 1% BSA in PBS. Sections were rinsed three times in PBS and incubated with anti-mouse secondary antibody in 1% NGS for 2 h.
Generation of hybrid transgenic oligodendrocytes expressing LacZ/TTK and detection of β-galactosidase activity. Lately, to facilitate the histopathological studies and the counting of oligodendrocytes in transgenic mice, we crossed our MBP-TTK transgenic mice with a transgenic line expressing bacterial LacZ gene (Forghani et al., 2001) under the control of 9 kb of MBP promoter in oligodendrocytes (a generous gift from Dr. A. Peterson, Department of Neurology and Neurosurgery, McGill University, Montreal, Quebec, Canada). Offspring from such crosses were identified by PCR for LacZ integration in genomic DNA using the forward primer (5′-ATACGCCGAACGATCGCCAG) and the reverse primer (5′-ATGTCGTTATCCAGCGGTGCAC) (596 bp). GCV-treated hybrid mice were processed for LacZ histochemistry. To detect the β-galactosidase (β-gal) activity, mice were anesthetized and perfused transcardially with 4% PFA freshly prepared in 0.1 m PBS. Brains were then removed and postfixed for an additional 1 h. Eighty micrometer floating sagittal sections were performed using vibratome, and samples were rinsed in PBS for 3 h and then incubated for 1 h with the same buffer containing 5 mm potassium ferricyanide, 5 mm potassium ferrocyanide trihydrate, 2 mm MgCl2, and 1 mg/ml 5-bromo-4-chloro-3-indolyl β-d-galactopyranoside (X-gal) (Roche Products) in N,N-dimethylformamide (Sigma). The sections were washed three times for 15 min in PBS, mounted in AquaPoly/Mount, and viewed with light microscopy. An immunohistofluorescence using rabbit anti-β-gal antibody (Sigma) was also performed.
Image processing. Photomicrographs were taken with a digital camera (DP70; Olympus Optical, Tokyo, Japan) attached to the microscope (Olympus BX60). The images were prepared for publication with the appropriate software (DP Manager; Olympus Optical; Adobe Photoshop 7.0). Microscopically verified artifacts were digitally removed from the photomicrographs.
Statistical analysis. For statistical purposes, RT-PCR analyses were performed three times, and, unless otherwise indicated, three mice were pooled in each experiment. Representative images are shown. Data were expressed as means ± SE. Statistical significance was determined by either Student's t test or one-way ANOVA followed by Newman-Keuls multiple-comparison test. Differences were considered significant at p < 0.05.
Results
Transgenic mice genotyping and transgene expression
Transgenic mice were generated by microinjection of the MBP-TTK construct into fertilized mouse ovocytes from the FVB hybrid strain. From six founder mice that carried the TTK transgene identified by PCR analysis of genomic DNA from tail biopsies, two lines were established as identified by the expression of TTK mRNA in the brain. The integration of TTK gene in genomic DNA was analyzed by PCR (Fig. 1B). The expression of TTK-specific mRNA by RT-PCR in the two transgenic mouse lines was detected only in the brain (Fig. 1C). Other tissues, sciatic nerve, liver, and lung did not show any detectable band corresponding to the TTK mRNA (Fig. 1C). In the absence of drug treatment, the two TTK transgenic homozygous mouse lines develop normally without any visible clinical or pathological signs.
Figure 1.

A, Structure of MBP-HSV1-TTK transgene. The transgene consists of 1.3 kb of the MBP promoter joined to 1.1 kb of a truncated form of HSV1-TTK. Restriction enzymes action sites are shown. B, Agarose gel electrophoresis analysis of PCR products of caudal biopsies from different mice. A 397 bp fragment corresponding to TTK gene was observed in lanes 1-4 that correspond to transgenic animals. Lane 5, Nontransgenic mouse; lane 6, molecular weight markers (100 bp). C, RT-PCR detection of PLP/DM-20 and TTK expression. Final products were separated on 1.5% agarose gel. The bands revealed by ethidium bromide correspond to predicted sizes of amplified PLP/DM-20 or TTK fragments. Lanes 1-4, PLP/DM-20 (604-499 bp); lanes 5-8, TTK (987 bp); lanes 1 and 5, brain; lanes 2 and 6, lungs; lanes 3 and 7, liver; lanes 4 and 8, sciatic nerve; lane 9, molecular weight markers (100 bp).
The specificity of TTK expression in brain cells was carefully examined by in situ hybridization using digoxigenin-tagged specific probes to TTK. After hybridization and detection of hybridized probes to brain tissue sections using alkaline phosphatase staining, oligodendrocytes in the white matter corpus callosum (Fig. 2A) as well as in cerebral cortex (B) showed a specific staining for TTK mRNA. Furthermore, we confirmed the functionality of TTK expression in oligodendrocytes by immunohistofluorescence using a rabbit polyclonal antibody to HSV1-TK C-terminal amino acid sequences developed in our laboratory. Oligodendrocytes in corpus callosum (Fig. 2C,D) showed a bright fluorescence for the HSV1-TK antibody. Brain sections from wild-type control mouse did not show any specific staining (Fig. 2E). TTK+ cell identity was confirmed by double-labeling immunohistofluorescence experiments with a monoclonal antibody to MBP. All TTK+ cells were MBP+ at P8 (Fig. 2F-H). The expression of TTK in oligodendrocytes was reduced after the end of the fourth week in the brain.
Figure 2.

Tissue-specific expression of TTK in 18-d-old transgenic brain tissue. In situ hybridization with TTK-Dig-labeled probes were used to detect TTK mRNA-positive cells in corpus callosum (A) and cerebral cortex (B). Immunohistofluorescence with a rabbit polyclonal antibody to HSV1-TK was performed to localize TTK-positive cells. Numerous TTK-positive cells were detected in corpus callosum (C, D) in transgenic mouse. No TTK immunoreaction was detected in control nontransgenic mouse (E). Double-labeling immunohistofluorescence shows staining of a transgenic brain section at P7 obtained with anti-HSV1-TK antibody detected by Alexa 546 (red)-tagged secondary antibody (F) and a mouse monoclonal antibody to MBP revealed by Alexa 488 (green)-labeled secondary antibody (G). Arrows show that TTK+ cells (F) are MBP+ (G) as confirmed in H. F and G are merged in H. Scale bar, 40 μm.
Phenotype of GCV-treated mice
When neonatal mice were treated daily with GCV by a single injection from P1 to P28, mice became sick and showed, starting from the end of the second postnatal week, clear signs of dysmyelination such as tremors, ataxia, seizures, and a significant decrease in body weight. In contrast, nontransgenic littermates did not show any visible pathological signs. A drastic reduction in oligodendrocyte number in both white and gray matter of treated transgenic mice was observed using in situ hybridization with specific PLP/DM20 digoxigenin-labeled probes (Fig. 3A,C) compared with normal mice (B,D). This dramatic reduction in oligodendrocyte number was confirmed by immunocytochemistry using antibodies to PLP (data not shown) and to CA II (see Fig. 9). Brain sections at 28 d of GCV treatment showed a dramatic reduction in the white matter. Immunofluorescence with MBP antibody in corpus callosum (Fig. 3E) showed only scattered MBP+ myelinated fibers, whereas the corpus callosum in control mice was densely packed with MBP+ myelinated fibers (F).
Figure 3.

Effect of GCV treatment on oligodendrocyte population after 28 d of GCV treatment. In situ hybridization detection of oligodendrocytes in the corpus callosum using PLP/DM-20 Dig-labeled probes in GCV-treated (A, C) and control mice (B, D). Only a few oligodendrocytes are detected in this field of corpus callosum in GCV-treated mouse (C) compared with control (D). Immunofluorescence for MBP in CGV-treated and control mice. Scattered bundles of remaining myelinated fibers in corpus callosum are fluorescent for MBP in GCV-treated mice (E). Very robust and compacted MBP fluorescence was observed in control mouse corpus callosum (F). Oligodendrocyte loss was also observed in hybrid Oligo-TTK-LacZ transgenic mice. At P21, we showed a drastic reduction in X-gal enzymatic reactivity in GCV-treated mice (G) compared with control (H). Similar results were obtained using a rabbit anti-β-gal antibody in GCV-treated (I) and control mice (J). Scale bar: (in A) A, B, 200 μm; E, F, 40 μm; C, D, I, J, 60 μm; G, H, 1.2 mm.
Figure 9.

Immunofluorescence of CA II (A, B) and NG2 (C, D) at P20 of GCV-treated (A, C) and control (B, D) mice. A higher number of NG2+ cells were observed in the corpus callosum of treated transgenic mice. Double immunostaining for CA II/PCNA (E, F, G, H) or CA II/BrdU (I, J, K, L) is shown. At P20, a drastic reduction in the number of CA II-positive cells in the corpus callosum of treated transgenic mice was observed (A) compared with control (B). In GCV-treated P1-P15 mice, examined at P30 using double immunostaining for CA II/PCNA, we show clearly a high number of CA II+/PCNA+ cells (arrows) in recovering brain (E, F) compared with control (G, H). Proliferating CA II+ cells were observed using double immunostaining for CA II and BrdU at P20 in GCV-treated and control mice. Double-stained cells were detected (arrows) in GCV-treated transgenic mice (I, J). Fewer CA II+/BrdU+ cells were detected in control brains (K, L). Scale bars: (in A) A-D, 60 μm; (in E) E-L, 40 μm.
In addition, to facilitate counting of oligodendrocytes, we generated hybrid transgenic mice by crossing our Oligo-TTK mice with a previously described line, MBP-LacZ (Forghani et al., 2001), which expresses LacZ reporter gene in oligodendrocytes. After GCV treatment of hybrid strain, oligodendrocytes expressing LacZ were identified by histochemistry using the X-gal enzymatic reaction (Fig. 3G,H). We observed a reduction in myelin and oligodendrocyte number in corpus callosum of GCV-treated (Fig. 3G) compared with control mice (H). The decrease in X-gal staining resulted from the reduction in number of both oligodendrocytes and myelinated fibers. Similar results were obtained when we used anti-β-gal antibody by immunohistofluorescence. At P21 in GCV-treated MBP-TTK mice, few oligodendrocytes are present in corpus callosum (Fig. 3I) compared with control (J). Results of β-gal+ oligodendrocyte cell counting (data not shown) were similar to those obtained by the counting of PLP/DM20+ cells.
The reduction in the number of oligodendrocytes is summarized in Table 1. The loss in oligodendrocytes in corpus callosum and cerebellum was 85-90%, whereas in spinal cord the loss was only 50% compared with control mice. Electron micrographs at P28 from GCV-treated transgenic mice (Fig. 4A,C) showed a limited number of myelinated axons in corpus callosum, whereas the majority of axons remained unmyelinated compared with control mice (B,D). The majority of nonmyelinated axons exhibited smaller diameters compared with the axons in control mice.
Table 1.
Average number of oligodendrocytes per section in the corpus callosum, cerebellum, and spinal cord from 28-d-old GCV-treated transgenic and control mice
|
|
Corpus callosum |
Cerebellum |
Spinal cord |
|---|---|---|---|
| MBP-TTK | 58 ± 14 | 39 ± 12 | 66 ± 18 |
| Control |
320 ± 15 |
216 ± 41 |
127 ± 29 |
The total number of CA II+ cells was counted after immunohistochemistry with a polyclonal anti-CA II. A reduction of 82% of the total CA II+ cells in the entire surface of the corpus callosum was observed. The same reduction was observed in the cerebellum. In the spinal cord, the number of oligodendrocytes (CA II+ cells) was reduced by only 48%. Results are expressed as means ± SE (n = 3 mice/group;3 sections/mouse).
Figure 4.
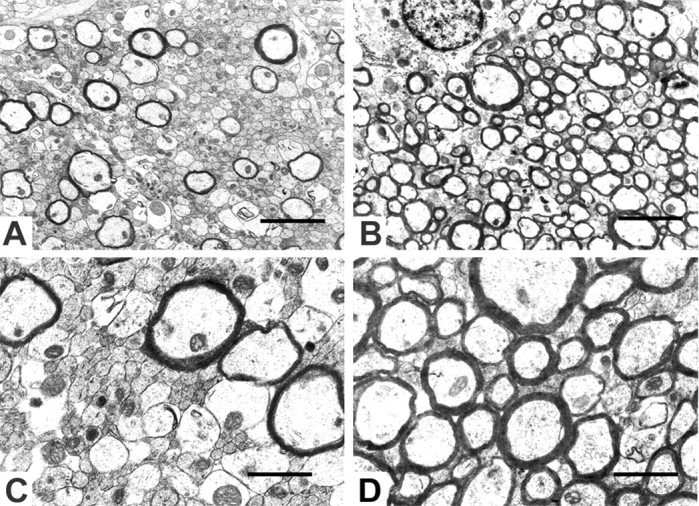
Electron micrographs of the corpus callosum from 28-d-old treated mouse brain (A, C) and control (B, D) are shown. Only a few axons are myelinated compared with control (B, D). Many unmyelinated axons in GCV-treated mice (A, C) showed a smaller diameter than in controls (B, D). Scale bars: A, B, 1 μm; C, D, 2 μm.
Furthermore, the loss in oligodendrocytes was also confirmed when several oligodendrocyte membrane markers were measured by a semiquantitative RT-PCR method. The expression of lysophosphatidic acid receptor 1 (LPA1) mRNA, a G-protein-coupled receptor for lysophosphatidic acid, the myelin-associated protein (MAG), and Connexin32 (Cx32), a protein in the subunits of gap junction channels found primarily in oligodendrocytes, were drastically reduced at P21 in GCV-treated mice (data not shown), reflecting the loss in oligodendrocytes. Although astrocytosis is a characteristic phenomenon observed in various types of dysmyelinating diseases (Hatfield and Skoff, 1982; Li and Bartlett, 1991; Chen et al., 1993; Eddleston and Mucke, 1993), GFAP mRNA level in the brain of GCV-treated transgenic animals was significantly increased at P14 and P21 as confirmed by immunohistofluorescence. In contrast, the mRNA level of aquaporin 4 (AQP4), a water channel protein highly polarized in astrocytic membrane (Nielsen et al., 1997) declined in GCV-treated mice (data not shown).
Cell death of oligodendrocytes in GCV-treated MBP-TTK mice
To examine the mechanism of oligodendrocyte cell death in GCV-treated mice, we used an antibody against the active form of caspase-3 for immunohistofluorescence. Caspase-3 is a cytosolic enzyme activated only in cells committed to undergo apoptosis. Our results showed large number of caspase-3+ cells at P7 in corpus callosum of GCV-treated transgenic mice (Fig. 5A). Smaller number of caspase-3+ cells were observed in the cerebral cortex (Fig. 5B). Normal control brain showed only a limited number of apoptotic cells (Fig. 5C). Apoptotic cells were detected also at later ages but in smaller numbers than that observed at P7.
Figure 5.

Detection of oligodendrocytes undergoing apoptosis. Oligodendrocyte cell death was detected using caspase-3 immunohistofluorescence of P7 GCV-treated Oligo-TTK and control mice. High numbers of caspase-3-positive cells were detected, particularly in the corpus callosum (A, B) in GCV-treated Oligo-TTK mice. Only a small number was detected in control mice (C). Double-labeling immunohistofluorescence showed that oligodendrocytes undergoing apoptosis (D, F) stained for caspase-3 at P8 after two injections of GCV were MBP+ (E) or PLP+ (G). The arrows indicate the same cells in D and E or F and G. Scale bar, 60 μm.
Apoptotic caspase-3+ cells in GCV-treated transgenic mice were differentiated to a point showing a staining for MBP as well as for PLP/DM20 antibodies (Fig. 5D-G).
Induction of oligodendrocyte cell death in developing brain
In situ hybridization of PLP/DM20 probes in tissue sections derived from three GCV-treated mouse groups (P1-P7, P7-P14, P14-P21 killed at P28) showed significant variations in the severity of oligodendrocyte loss. Oligodendrocytes positive for PLP/DM20 mRNA counting in corpus callosum showed a very severe reduction in oligodendrocyte number by 90% in the treated mice P1-P28 as mentioned above (Fig. 6A), whereas the reduction was 67% for P1-P7 and 59% for P7-P14 GCV-treated mice (A). The loss in oligodendrocytes was reduced to 34% when transgenic mice were treated only during the third week (P14-21). The percentage of the total number of BrdU+ cells per section in corpus callosum of GCV-treated mice is 20 and 36% at P10 and P20, respectively (Fig. 6B). Oligodendrocytes are particularly sensitive to GCV treatment primarily during the first 3 weeks postnatal with a maximal killing effect at the end of the first week, during the active phase of proliferation. Mature oligodendrocytes (postmitotic) in adult brain at P60, after daily injection of GCV for the last 10 d, were not sensitive to GCV treatment as confirmed by immunofluorescence for CA II (Fig. 7A,B) and by classical histological staining in semithin plastic-embedded sections (C,D). Furthermore, even in young adult brains at P45 after daily GCV injection for the last 5 d, the oligodendrocyte population was not significantly affected by GCV treatment as attested with in situ hybridization for PLP/DM20 probes (Fig. 7E,F).
Figure 6.

A, Quantification of PLP/DM20 mRNA-positive oligodendrocytes in the corpus callosum in 28-d-old mice. The total numbers of mRNA PLP/DM20-positive oligodendrocytes per sagittal section were counted. The greatest decrease in oligodendrocytes number (90%) was observed in mice treated continuously from P1 to P28. Oligodendrocyte number was decreased by 67 and 59% in transgenic mice treated from P1 to P7 and P7 to P14, respectively. The reduction was less (34%) in mice treated from P14 to P21. B, The total number of BrdU+ cells was counted after immunohistochemistry with a monoclonal antibody to BrdU. A reduction of 80% of the total BrdU-positive cells in the entire surface of the corpus callosum was observed at P10 in GCV-treated mice compared with control. This reduction was ∼64% at P20. Results are expressed as means ± SE (n = 3 mice/group; 3 sections/mouse).
Figure 7.

Brain sections from adult (P60) transgenic Oligo-TTK (A, C) and control (B, D) mice treated daily with GCV for the last 10 d before examination at P60 are shown. Immunohistofluorescence of CA II in GCV-treated (A) and control (B) brain sections is shown. Similar number of oligodendrocytes was detected in the two brains. Myelinated axons in corpus callosum in treated mice (C) did not show any significant abnormalities compared with the control (D). In situ hybridization for PLP/DM20 in brain section from young adult mice (P45) treated daily with GCV for the last 5 d before the examination of transgenic (E) and control (F) brains. No significant difference was observed in the number of PLP/DM20+ cells in corpus callosum of both brains. Scale bar: (in A) A, B, E, F, 60 μm; C, D, 40 μm.
Dysmyelination in P1-P15 model and recovery of myelin
The group of mice treated with GCV during the first 2 weeks only (P1-P15) and then examined at 15, 30, and 60 d showed a gradual recovery in myelination. At P15, semithin plastic sections stained with toluidine blue showed almost complete loss of myelin in corpus callosum in treated transgenic mice compared with control. Two weeks after the arrest of treatment, a partial recovery in myelin was observed in GCV-treated mice at P30, and ∼25-30% of axons were myelinated. Control mice at P30 showed an additional general increase in the thickness and the number of myelinated fibers. At P60, the number of myelinated fibers in corpus callosum are reduced by 50-60% in treated mice compared with control mice (data not shown). Electron micrographs from the same group of GCV-treated and control mice confirmed the optical microscope observations. At P15 in treated transgenic mice, all of the axons in this examined area in corpus callosum were nonmyelinated and exhibited a small diameter (Fig. 8A) compared with control myelinated fibers (B). Occasionally, debris of dying oligodendrocytes were also observed. A gradual increase in the number of myelinated fibers and their diameters was observed in treated transgenic mice at P30 and P60 (Fig. 8C,E). All of the remaining unmyelinated fibers exhibited small diameters compared with the myelinated axons in transgenic as well as control mice (Fig. 8D,F). The diameter of myelinated axons increased gradually during myelination. The GCV-treated mice at P15 showed typical signs of dysmyelination characterized by tremors and loss of weight. Two weeks after the arrest of treatment, the pathological symptoms began to disappear gradually, and at P60, the mice exhibited an apparent normal phenotype despite the fact that ∼40% of axons remained unmyelinated.
Figure 8.

Electron micrographs of corpus callosum showing recovery in myelination. Transgenic mice were treated with GCV from P1 to P15. Tissues were examined at P15 (A, B), P30 (C, D), and P60 (E, F). Almost all of the axons were unmyelinated at P15 (A) compared with control (B). At P30, 2 weeks after the arrest of treatment, a small number of myelinated axons was observed (C). At P60, ∼40-50% of axons became myelinated (E). A, C, E, GCV-treated mice. B, D, F, Control mice. Scale bar, 1.8 μm.
Proliferation of oligodendrocytes during myelin restoration in transgenic mice (P1-P15 GCV-treated mice)
To establish the identity of proliferating oligodendrocytes in mice treated with GCV for only the first 2 weeks, PCNA and BrdU immunohistofluorescence in tissue sections was combined with immunohistofluorescence of CA II. The reduction in oligodendrocyte number in GCV-treated mice was clearly demonstrated with CA II immunohistofluorescence. Very few CA II+ oligodendrocytes were present at P20 in transgenic mice receiving GCV treatment (Fig. 9A), whereas a large number was observed in control brain (B). In contrast to the reduced number of CA II+ cells in corpus callosum at P20, the number of NG2+ cells (Fig. 9C) was twofold to threefold higher than in control mice (D). In mice treated with GCV from P1-P15, two weeks after arrest of GCV treatment, at P30, a significant number of double-labeled CA II+/PCNA+ cells are present particularly in corpus callosum (Fig. 9E,F). In contrast, very rare CA II+/PCNA+ cells are present in control brain corpus callosum (Fig. 9G,H). All of the CA II+ oligodendrocytes were PLP/DM20 mRNA+ in mouse brain (Jalabi et al., 2003).
The identity of proliferating cells in GCV-treated as well as control mice was also examined at previous stages during postnatal development. At P20 in GCV-treated mice, BrdU+/CA II+ cells were detected (Fig. 9I,J) but fewer double labeled cells were observed in control brain (K,L). The number of double-stained BrdU/CA II cells in control mice was three to four times greater than that of treated mice, particularly in 10-d-old mice during GCV treatment. Furthermore, the estimated number of NG2+ cells in corpus callosum of GCV-treated mice at P20 was twice higher than in control mice, whereas the number of CA II+ cells was reduced by 30%. The ratio of NG2+/CA II+ cells is 2:1 in recovering mice and only 1:2 in control mice.
Discussion
We generated transgenic mice (Oligo-TTK) carrying a truncated form of HSV1-TK gene driven by the MBP promoter to induce the cell death of oligodendrocytes at selected times during postnatal development and to evaluate their role in CNS function. The HSV1-TK system offers the valuable advantages of allowing the induction of the cell death at times and for durations that are fully controlled by the investigator by administration of nucleoside analogs. Such a system is a powerful tool for appreciating the physiological importance of oligodendrocytes at different developmental phases. In this study, we focused on specific aspects of oligodendrocyte plasticity and myelination.
Specific induction of oligodendrocyte death in postnatal developing brain
To generate the present transgenic mouse model, we used a truncated sequence of TK gene (TTK) (1.1 kb) (Salomon et al., 1995). This choice was made to avoid sterility in males observed in transgenic mice harboring the TK gene previously produced (Al-Shawi et al., 1988; Braun et al., 1990; Neznanov et al., 1993; Ghandour et al., 1995; Mathis et al., 2000) and to exclude the bystander effect of a high level of HSV1-TK expression, which may result in leaky expression. In fact, sterility of male transgenic mice was correlated with high levels of expression of short TK transcripts in postmitotic germ line cells (Braun et al., 1990; Al-Shawi et al., 1991) initiated primarily upstream of the second internal ATG of the TK gene. Furthermore, TTK has more specific properties in cell ablation than the native form because of the absence of leaky expression and the decreases in specific activity of the enzyme, which is not a limiting factor for GCV sensitivity (Coen et al., 1989; Zemskova and Fodor, 1991). In addition, 1.3 kb of MBP promoter can target oligodendrocytes in the CNS but not in peripheral nervous system (Katsuki et al., 1988). A specific expression of the TTK in oligodendrocytes is clearly demonstrated by the localization of HSV1-TK transcripts using in situ hybridization. The presence of the enzyme in oligodendrocytes was further attested using a polyclonal antibody to the HSV1-TK enzyme produced in our laboratory. Another polyclonal antibody to TK provided by Dr. M. Black (Washington State University, Pullman, WA) gave similar results. The effects of GCV treatment in the CNS via the induction of oligodendrocyte death proved to be highly specific in the present transgenic mice. Conflicting data on the mechanism of cell death in TK/GCV system have been described in the literature. Halloran and Fenton (1998) described a cell cycle arrest that occurred in late S phase or G2 phase because of activation of the G2-M DNA damage checkpoint. The cell death is attributable to the irreversible arrest at the G2-M checkpoint rather than apoptosis. In contrast, Beltinger et al. (1999) found that TK/GCV induces accumulation of p53 and increased cell surface expression of death receptor CD95 and tumor necrosis factor receptor, which is likely to involve p53-mediated translocation of CD95 to the cell surface. Our results confirmed oligodendrocyte cell death by apoptosis through the detection of caspase-3. A massive apoptosis of oligodendrocytes can be induced particularly during the first 2 weeks after birth (Ghandour et al., 2002). Cells undergoing apoptosis, in response to GCV treatment during brain postnatal development, showed immunoreactivity with MBP and PLP antibodies.
Oligodendrocyte apoptosis and dysmyelination in GCV-treated transgenic mice
Daily treatment from P1 to P28 results in the most severe phenotype, as characterized by tremors, ataxia, and seizures. At P28, only 10-15% of oligodendrocytes were left in the brain and cerebellum, whereas 40-50% were present in spinal cord. Oligodendrocytes escaping from GCV treatment detected in the CNS at P28 may be formed and became postmitotic before P1. This explanation is supported by the greater number of residual oligodendrocytes detected in spinal cord. Indeed, oligodendrocyte formation and myelination in spinal cord precede those of the brain (Skoff et al., 1976; Sturrock, 1981; Foran and Peterson, 1992; Fuss et al., 2000; Baracskay et al., 2002).
In fact, the most sensitive cells to GCV treatment are the actively dividing immature oligodendrocytes (oligodendroblasts), because the action of GCV is greater in cells entering the S phase of cell cycle during which GCV triphosphate is incorporated in large amount into newly synthesized DNA. Those dividing cells express a functional HSV1-TK induced by active MBP promoter. Interestingly, oligodendrocytes HSV1-TK+ cells in transgenic mice express a detectable level of MBP.
Mature oligodendrocytes (postmitotic) in adult transgenic brain are not sensitive to GCV treatment. However, a very small number of oligodendrocytes scattered in the corpus callosum showed apoptotic figures after 5-10 d of GCV treatment (M. S. Ghandour, unpublished observation). The slowly proliferating oligodendrocytes in adult brain that are affected by GCV treatment and present in limited number may give insights in the future on the partial recovery in myelin in early phases of multiple sclerosis.
The loss in oligodendrocytes, observed in GCV programs P1-P7, P7-P14, and P14-P21, agrees well with data available from the literature on oligodendrocyte proliferation in rat and mouse postnatal development in vivo (Gilmore, 1971; Skoff et al., 1976; Sturrock and McRae, 1980; Arenella and Herndon, 1984; Blakemore and Crang, 1988; Fok-Seang and Miller, 1994; Skoff et al., 1994). More than 70% of oligodendrocytes are formed during the first 2 weeks, and the rest are formed during the third postnatal week.
The dramatic reduction in myelin and oligodendrocytes was also confirmed by semiquantitative RT-PCR for MAG mRNA. MAG is localized exclusively in oligodendrocytes and in the adaxonal membrane of the myelin internodes (Trapp et al., 1989; Ishiguro at al., 1991). Cx32 mRNA, encoded for a protein of gap junction channels found primarily in oligodendrocyte (Rash et al., 2001; Nagy et al., 2003), was also greatly decreased, whereas LPA1 receptor mRNA level was less affected, because it was reported to be expressed also by astrocytes (Tabuchi et al., 2000).
Finally, astrocyte hypertrophy observed by immunohistochemistry was confirmed by the increase in GFAP mRNA level. In contrast, despite the increase in astrocyte processes, AQP4 mRNA level was decreased. Taking into account the increase in plasma membrane extensions, a deficiency in water pores in hypertrophied astrocytes is reasonable to propose.
Oligodendrocyte plasticity in P1-P15 GCV-treated mice
The induction of cell death for >70% of oligodendrocytes by GCV treatment for the first 2 weeks only (P1-P15) resulted in a gradual recovery in the numbers of oligodendrocytes and myelinated fibers. At P60, the mice behave normally without any apparent clinical symptoms. This normal phenotype was observed despite a deficit of >40% of myelinated axons and 25-30% in oligodendrocytes. Double immunohistofluorescence for BrdU, PCNA, carbonic anhydrase II, a marker for oligodendrocytes in vivo (Ghandour et al., 1980, 2000; Kumpulainen and Korhonen, 1982), identified the proliferating cells as oligodendrocytes. In situ hybridization for PLP or PLP/DM20 combined with immunohistofluorescence of CA II showed that all PLP mRNA+ or PLP/DM20 mRNA+ cells are CA II+ in postnatal mouse brain (Jalabi et al., 2003). Furthermore, increasing evidence in the favor of proliferating cells that express transcripts for MBP and PLP as well as the corresponding proteins has been reported (Feutz et al., 1995; Spassky et al., 1998; Perez Villegas et al., 1999; Mallon et al., 2002). The vast majority of oligodendrocytes generated in postnatal mouse and rat brain (>90%) are formed from cells expressing an oligodendrocytic phenotype (Skoff et al., 1994). We showed that CA II+ cells and PLP mRNA+ cells are proliferating in situ to compensate for the loss in oligodendrocytes.
The plasticity of oligodendrocytes has been clearly demonstrated in a previous study on female carriers of jimpy mutation (Skoff and Ghandour, 1995), in which the loss in jimpy oligodendrocytes was compensated by an increase in the number of normal oligodendrocytes, which in turn maintain more myelin segments than their counterpart in normal brain. It is interesting to note that, in corpus callosum, during myelin recovery, the number of oligodendrocyte progenitors NG2+ (Nishiyama, 2001) was twice higher than the normal, and the ratio of NG2+/CA II+ cells was 2:1 at P20 and then decreased gradually during remyelination to 1:2. Because oligodendrocyte generation in postnatal brain is a continuous but not synchronous phenomenon, it is conceivable that as soon as NG2+ cells express HSV1-TK, under the action of MBP promoter, they are killed by GCV.
In addition, we observed that all of the nonmyelinated axons in GCV-treated mice brain remained small, showing directly the importance of myelination in the development of axonal diameter. Axon diameters are related to the thickness of the myelin sheath, which in turn determines the velocity of action potential propagation. Previous data have also indicated that axon diameter growth remained substantially reduced in the absence of oligodendrocytes (Colello et al., 1994; Sanchez et al., 1996).
The Oligo-TTK mouse model offers the possibility to obtain various degrees of dysmyelination in the CNS associated with oligodendrocyte apoptosis. The model can be used for therapeutic tests to study the plasticity potential of an oligodendrocyte population at different phases during brain development. The selective and conditional induction of oligodendrocyte cell death will be useful for addressing other questions concerning the role of oligodendrocytes during early development and in young adult mice.
Footnotes
This work was supported by Association Européenne contre les Leucodystrophies and Ministère de l'Éducation Nationale de la Recherche et de la Technologie to M.S.G. We thank Prof. G. Vincendon for support and encouragement and E. Scherrer, Y. Huss, and R. Bury for technical assistance. We thank Dr. D. Klatzmann (Pitié Salpêtrière, Paris, France) for the generous gift of the plasmid pLTR-TTK, Dr. A. Fujuoka (Kinki University, Osaka, Japan) for her generous donation of anti-AQP4, Dr. W. Stallcup (Developmental Neurobiology, The Burnham Institute, La Jolla, CA) for providing anti-NG2, Dr. A. Peterson (Department of Neurology and Neurosurgery, McGill University, Montreal, Quebec, Canada) for providing lacZ mice, Dr. K. A. Nave (Neurogenetics, Göttingen, Germany) for O10 antibody, and Drs. R. P. Skoff and J. Benjamins (Department of Anatomy and Cell Biology and Neurology, Wayne State University, Detroit, MI) for their critical reading of this manuscript.
Correspondence should be addressed to Dr. M. Said Ghandour, Unité Mixte de Recherche 7004, Université Louis Pasteur/Centre National de la Recherche Scientifique, Faculté deMédecine, 11 rue Humann, 67085 Strasbourg, France. E-mail: ghandour@neurochem.u-strasbg.fr.
Copyright © 2005 Society for Neuroscience 0270-6474/05/252885-10$15.00/0
References
- Al-Shawi R, Burke J, Jones CT, Simons JP, Bishop JO (1988) A Mup promoter-thymidine kinase reporter gene shows relaxed tissue-specific expression and confers male sterility upon transgenic mice. Mol Cell Biol 8: 4821-4828. [DOI] [PMC free article] [PubMed] [Google Scholar]
- Al-Shawi R, Burke J, Wallace H, Jones C, Harrison S, Buxton D, Maley S, Chandley A, Bishop JO (1991) The herpes simplex virus type 1 thymidine kinase is expressed in the testes of transgenic mice under the control of a cryptic promoter. Mol Cell Biol 11: 4207-4216. [DOI] [PMC free article] [PubMed] [Google Scholar]
- Arenella LS, Herndon RM (1984) Mature oligodendrocytes. Division following experimental demyelination in adult animals. Arch Neurol 41: 1162-1165. [DOI] [PubMed] [Google Scholar]
- Baracskay KL, Duchala CS, Miller RH, Macklin WB, Trapp BD (2002) Oligodendrogenesis is differentially regulated in gray and white matter of jimpy mice. J Neurosci Res 70: 645-654. [DOI] [PubMed] [Google Scholar]
- Beltinger C, Fulda S, Kammertoens T, Meyer E, Uckert W, Debatin KM (1999) Herpes simplex virus thymidine kinase/ganciclovir-induced apoptosis involves ligand-independent death receptor aggregation and activation of caspases. Proc Natl Acad Sci USA 96: 8699-8704. [DOI] [PMC free article] [PubMed] [Google Scholar]
- Blakemore WF (1973) Remyelination of the superior cerebellar peduncle in the mouse following demyelination induced by feeding cuprizone. J Neurol Sci 20: 73-83. [DOI] [PubMed] [Google Scholar]
- Blakemore WF, Crang AJ (1988) Extensive oligodendrocyte remyelination following injection of cultured central nervous system cells into demyelinating lesions in adult central nervous system. Dev Neurosci 10: 1-11. [DOI] [PubMed] [Google Scholar]
- Bradl M, Linington C (1996) Animal models of demyelination. Brain Pathol 6: 303-311. [DOI] [PMC free article] [PubMed] [Google Scholar]
- Braun RE, Lo D, Pinkert CA, Widera G, Flavell RA, Palmiter RD, Brinster RL (1990) Infertility in male transgenic mice: disruption of sperm development by HSV-tk expression in postmeiotic germ cells. Biol Reprod 43: 684-693. [DOI] [PubMed] [Google Scholar]
- Breitman ML, Clapoff S, Rossant J, Tsui LC, Glode LM, Maxwell IH, Bernstein A (1987) Genetic ablation: targeted expression of a toxin gene causes microphthalmia in transgenic mice. Science 238: 1563-1565. [DOI] [PubMed] [Google Scholar]
- Bush TG, Savidge TC, Freeman TC, Cox HJ, Campbell EA, Mucke L, Johnson MH, Sofroniew MV (1998) Fulminant jejuno-ileitis following ablation of enteric glia in adult transgenic mice. Cell 93: 189-201. [DOI] [PubMed] [Google Scholar]
- Caruso M, Klatzmann D (1992) Selective killing of CD4+ cells harboring a human immunodeficiency virus-inducible suicide gene prevents viral spread in an infected cell population. Proc Natl Acad Sci USA 89: 182-186. [DOI] [PMC free article] [PubMed] [Google Scholar]
- Chen H, Cabon F, Sun P, Parmantier E, Dupouey P, Jacque C, Zalc B (1993) Regional and developmental variations of GFAP and actin mRNA levels in the CNS of jimpy and shiverer mutant mice. J Mol Neurosci 4: 89-96. [DOI] [PubMed] [Google Scholar]
- Coen DM, Irmiere AF, Jacobson JG, Kerns KM (1989) Low levels of herpes simplex virus thymidine-thymidylate kinase are not limiting for sensitivity to certain antiviral drugs or for latency in a mouse model. Virology 168: 221-231. [DOI] [PubMed] [Google Scholar]
- Colello RJ, Pott U, Schwab ME (1994) The role of oligodendrocytes and myelin on axon maturation in the developing rat retinofugal pathway. J Neurosci 14: 2594-2605. [DOI] [PMC free article] [PubMed] [Google Scholar]
- Dal Canto MC, Rabinowitz SG (1982) Experimental models of virus-induced demyelination of the central nervous system. Ann Neurol 11: 109-127. [DOI] [PMC free article] [PubMed] [Google Scholar]
- Delaney CL, Brenner M, Messing A (1996) Conditional ablation of cerebellar astrocytes in postnatal transgenic mice. J Neurosci 16: 6908-6918. [DOI] [PMC free article] [PubMed] [Google Scholar]
- Eddleston M, Mucke L (1993) Molecular profile of reactive astrocytes—implications for their role in neurologic disease. Neuroscience 54: 15-36. [DOI] [PMC free article] [PubMed] [Google Scholar]
- Fazakerley JK, Walker R (2003) Virus demyelination. J Neurovirol 9: 148-164. [DOI] [PMC free article] [PubMed] [Google Scholar]
- Feutz AC, Bellomi I, Allinquant B, Schladenhaufen Y, Ghandour MS (1995) Isolation and characterization of defective jimpy oligodendrocytes in culture. J Neurocytol 24: 865-877. [DOI] [PubMed] [Google Scholar]
- Fillat C, Carrio M, Cascante A, Sangro B (2003) Suicide gene therapy mediated by the herpes simplex virus thymidine kinase gene/ganciclovir system: fifteen years of application. Curr Gene Ther 3: 13-26. [DOI] [PubMed] [Google Scholar]
- Fok-Seang J, Miller RH (1994) Distribution and differentiation of A2B5+ glial precursors in the developing rat spinal cord. J Neurosci Res 37: 219-235. [DOI] [PubMed] [Google Scholar]
- Foran DR, Peterson AC (1992) Myelin acquisition in the central nervous system of the mouse revealed by an MBP-Lac Z transgene. J Neurosci 12: 4890-4897. [DOI] [PMC free article] [PubMed] [Google Scholar]
- Forghani R, Garofalo L, Foran DR, Farhadi HF, Lepage P, Hudson TJ, Tret-jakoff I, Valera P, Peterson A (2001) A distal upstream enhancer from the myelin basic protein gene regulates expression in myelin-forming Schwann cells. J Neurosci 21: 3780-3787. [DOI] [PMC free article] [PubMed] [Google Scholar]
- Friedrich VL (1975) Hyperplasia of oligodendrocytes in quaking mice. Anat Embryol 147: 259-271. [DOI] [PubMed] [Google Scholar]
- Furman PA, McGuirt PV, Keller PM, Fyfe JA, Elion GB (1980) Inhibition by acyclovir of cell growth and DNA synthesis of cells biochemically transformed with herpes virus genetic information. Virology 102: 420-430. [DOI] [PubMed] [Google Scholar]
- Fuss B, Mallon B, Phan T, Ohlemeyer C, Kirchhoff F, Nishiyama A, Macklin WB (2000) Purification and analysis of in vivo-differentiated oligodendrocytes expressing the green fluorescent protein. Dev Biol 218: 259-274. [DOI] [PubMed] [Google Scholar]
- Ghandour MS, Skoff RP (1988) Expression of galactocerebroside in developing normal and jimpy oligodendrocytes in situ. J Neurocytol 17: 485-498. [DOI] [PubMed] [Google Scholar]
- Ghandour MS, Vincendon G, Gombos G, Limozin N, Filippi D, Dalmasso C, Laurent G (1980) Carbonic anhydrase and oligodendroglia in developing rat cerebellum: a biochemical and immunohistological study. Dev Biol 77: 73-83. [DOI] [PubMed] [Google Scholar]
- Ghandour MS, Borrelli E, Thiriet G, Miehe M, Schladenhaufen Y (1995) Oligodendrocyte obliteration in transgenic mice: creation of a unique model for myelin deficiency study and oligodendrocyte lineage analysis. J Neurochem [Suppl]45: S110. [Google Scholar]
- Ghandour MS, Parkkila AK, Parkkila S, Waheed A, Sly WS (2000) Mitochondrial carbonic anhydrase in the nervous system: expression in neuronal and glial cells. J Neurochem 75: 2212-2220. [DOI] [PubMed] [Google Scholar]
- Ghandour MS, Jalabi W, Boehm N, Steibel J, Grucker D (2002) Oligodendrocyte conditional cell death in transgenic mice. Soc Neurosci Abstr 28: 799.13. [Google Scholar]
- Gilmore SA (1971) Neuroglial population in the spinal white matter of neonatal and early postnatal rats: an autoradiographic study of numbers of neuroglia and changes in their proliferative activity. Anat Rec 171: 283-291. [DOI] [PubMed] [Google Scholar]
- Hall SM (1972) The effect of injections of lysophosphatidyl choline into white matter of the adult mouse spinal cord. Cell Sci 10: 535-546. [DOI] [PubMed] [Google Scholar]
- Halloran PJ, Fenton RG (1998) Irreversible G2-M arrest and cytoskeletal reorganization induced by cytotoxic nucleoside analogues. Cancer Res 58: 3855-3865. [PubMed] [Google Scholar]
- Hardy RJ (1998) Molecular defects in the dysmyelinating mutant quaking. J Neurosci Res 51: 417-422. [DOI] [PubMed] [Google Scholar]
- Hatfield JS, Skoff RP (1982) GFAP immunoreactivity reveals astrogliosis in females heterozygous for jimpy. Brain Res 250: 123-131. [DOI] [PubMed] [Google Scholar]
- Heyman RA, Borrelli E, Lesley J, Anderson D, Richman DD, Baird SM, Hyman R, Evans RM (1989) Thymidine kinase obliteration: creation of transgenic mice with controlled immune deficiency. Proc Natl Acad Sci USA 86: 2698-2702. [DOI] [PMC free article] [PubMed] [Google Scholar]
- Hiremath MM, Saito Y, Knapp GW, Ting JP, Suzuki K, Matsushima GK (1998) Microglial/macrophage accumulation during cuprizone-induced demyelination in C57BL/6 mice. J Neuroimmunol 92: 38-49. [DOI] [PubMed] [Google Scholar]
- Jalabi W, Cerghet M, Skoff RP, Ghandour MS (2003) Detection of oligodendrocytes in tissue sections using PCR synthesis of digoxigenin-labeled probes. J Histochem Cytochem 51: 913-919. [DOI] [PubMed] [Google Scholar]
- Kagawa T, Ikenaka K, Inoue Y, Kuriyama S, Tsujii T, Nakao J, Nakajima K, Aruga J, Okano H, Mikoshiba K (1994) Glial cell degeneration and hypomyelination caused by overexpression of myelin proteolipid protein gene. Neuron 13: 427-442. [DOI] [PubMed] [Google Scholar]
- Katsuki M, Sato M, Kimura M, Yokoyama M, Kobayashi K, Nomura T (1988) Conversion of normal behavior to shiverer by myelin basic protein antisense cDNA in transgenic mice. Science 241: 593-595. [DOI] [PubMed] [Google Scholar]
- Klugmann M, Schwab MH, Puhlhofer A, Schneider A, Zimmermann F, Griffiths IR, Nave KA (1997) Assembly of CNS myelin in the absence of proteolipid protein. Neuron 18: 59-70. [DOI] [PubMed] [Google Scholar]
- Kumpulainen T, Korhonen LK (1982) Immunohistochemical localization of carbonic anhydrase isoenzyme C in the central and peripheral nervous system of the mouse. J Histochem Cytochem 30: 283-292. [DOI] [PubMed] [Google Scholar]
- Lem J, Applebury ML, Falk JD, Flannery JG, Simon MI (1991) Tissue-specific and developmental regulation of rod opsin chimeric genes in transgenic mice. Neuron 6: 201-210. [DOI] [PubMed] [Google Scholar]
- Li XS, Bartlett WP (1991) Developmental expression of glial fibrillary acidic protein and glutamine synthetase mRNAs in normal and jimpy mice. Brain Res Mol Brain Res 9: 313-317. [DOI] [PubMed] [Google Scholar]
- Mallon BS, Shick HE, Kidd GJ, Macklin WB (2002) Proteolipid promoter activity distinguishes two populations of NG2-positive cells throughout neonatal cortical development. J Neurosci 22: 876-885. [DOI] [PMC free article] [PubMed] [Google Scholar]
- Martin JR, Nathanson N (1979) Animal models of virus-induced demyelination. In: Progress in neuropathology (Zimmerman HM, ed), pp 27-50. New York: Raven.
- Mathis C, Hindelang C, LeMeur M, Borrelli E (2000) A transgenic mouse model for inducible and reversible dysmyelination. J Neurosci 20: 7698-7705. [DOI] [PMC free article] [PubMed] [Google Scholar]
- Messing A, Behringer RR, Hammang JP, Palmiter RD, Brinster RL, Lemke G (1992) P0 promoter directs expression of reporter and toxin genes to Schwann cells of transgenic mice. Neuron 8: 507-520. [DOI] [PubMed] [Google Scholar]
- Nagy JI, Ionescu AV, Lynn BD, Rash JE (2003) Connexin29 and connexin32 at oligodendrocyte and astrocyte gap junctions and in myelin of the mouse central nervous system. J Comp Neurol 464: 356-370. [DOI] [PMC free article] [PubMed] [Google Scholar]
- Nave KA (1994) Neurological mouse mutants and the genes of myelin. J Neurosci Res 38: 607-612. [DOI] [PubMed] [Google Scholar]
- Nave KA, Lai C, Bloom FE, Milner RJ (1986) Jimpy mutant mouse: a 74-base deletion in the mRNA for myelin proteolipid protein and evidence for a primary defect in RNA splicing. Proc Natl Acad Sci USA 83: 9264-9268. [DOI] [PMC free article] [PubMed] [Google Scholar]
- Neznanov N, Thorey IS, Cecena G, Oshima RG (1993) Transcriptional insulation of the human keratin 18 gene in transgenic mice. Mol Cell Biol 13: 2214-2223. [DOI] [PMC free article] [PubMed] [Google Scholar]
- Nielsen S, Nagelhus EA, Amiry-Moghaddam M, Bourque C, Agre P, Ottersen OP (1997) Specialized membrane domains for water transport in glial cells: high-resolution immunogold cytochemistry of aquaporin-4 in rat brain. J Neurosci 17: 171-180. [DOI] [PMC free article] [PubMed] [Google Scholar]
- Nishiyama A (2001) NG2 cells in the brain: a novel glial cell population. Hum Cell 14: 77-82. [PubMed] [Google Scholar]
- Palmiter RD, Behringer RR, Quaife CJ, Maxwell F, Maxwell IH, Brinster RL (1987) Cell lineage ablation in transgenic mice by cell-specific expression of a toxin gene. Cell 50: 435-443. [DOI] [PubMed] [Google Scholar]
- Perez Villegas EM, Olivier C, Spassky N, Poncet C, Cochard P, Zalc B, Thomas JL, Martinez S (1999) Early specification of oligodendrocytes in the chick embryonic brain. Dev Biol 216: 98-113. [DOI] [PubMed] [Google Scholar]
- Rash JE, Yasumura T, Davidson KG, Furman CS, Dudek FE, Nagy JI (2001) Identification of cells expressing Cx43, Cx30, Cx26, Cx32 and Cx36 in gap junctions of rat brain and spinal cord. Cell Commun Adhes 8: 315-320. [DOI] [PMC free article] [PubMed] [Google Scholar]
- Readhead C, Schneider A, Griffiths I, Nave KA (1994) Premature arrest of myelin formation in transgenic mice with increased proteolipid protein gene dosage. Neuron 12: 583-595. [DOI] [PubMed] [Google Scholar]
- Roach A, Boylan K, Horvath S, Prusiner SB, Hood LE (1983) Characterization of cloned cDNA representing rat myelin basic protein: absence of expression in brain of shiverer mutant mice. Cell 34: 799-806. [DOI] [PubMed] [Google Scholar]
- Salomon B, Lores P, Pioche C, Racz P, Jami J, Klatzmann D (1994) Conditional ablation of dendritic cells in transgenic mice. J Immunol 152: 537-548. [PubMed] [Google Scholar]
- Salomon B, Maury S, Loubiere L, Caruso M, Onclercq R, Klatzmann D (1995) A truncated herpes simplex virus thymidine kinase phosphorylates thymidine and nucleoside analogs and does not cause sterility in transgenic mice. Mol Cell Biol 15: 5322-5328. [DOI] [PMC free article] [PubMed] [Google Scholar]
- Sanchez I, Hassinger L, Paskevich PA, Shine HD, Nixon RA (1996) Oligodendroglia regulate the regional expansion of axon caliber and local accumulation of neurofilaments during development independently of myelin formation. J Neurosci 16: 5095-5105. [DOI] [PMC free article] [PubMed] [Google Scholar]
- Skoff RP, Ghandour MS (1995) Oligodendrocytes in female carriers of the jimpy gene make more myelin than normal oligodendrocytes. J Comp Neurol 355: 124-133. [DOI] [PubMed] [Google Scholar]
- Skoff RP, Price DL, Stocks A (1976) Electron microscopic autoradiographic studies of gliogenesis in rat optic nerve. I. Cell proliferation. J Comp Neurol 169: 291-312. [DOI] [PubMed] [Google Scholar]
- Skoff RP, Ghandour MS, Knapp PE (1994) Postmitotic oligodendrocytes generated during postnatal cerebral development are derived from proliferation of immature oligodendrocytes. Glia 12: 12-23. [DOI] [PubMed] [Google Scholar]
- Smeyne RJ, Chu T, Lewin A, Bian F, S-Crisman S, Kunsch C, Lira SA, Oberdick J (1995) Local control of granule cell generation by cerebellar Purkinje cells. Mol Cell Neurosci 6: 230-251. [DOI] [PubMed] [Google Scholar]
- Snipes GJ, Suter U, Shooter EM (1993) The genetics of myelin. Curr Opin Neurobiol 3: 694-702. [DOI] [PubMed] [Google Scholar]
- Spassky N, Goujet-Zalc C, Parmantier E, Olivier C, Martinez S, Ivanova A, Ikenaka K, Macklin W, Cerruti I, Zalc B, Thomas JL (1998) Multiple restricted origin of oligodendrocytes. J Neurosci 18: 8331-8343. [DOI] [PMC free article] [PubMed] [Google Scholar]
- St Clair MH, Lambe CU, Furman PA (1987) Inhibition by ganciclovir of cell growth and DNA synthesis of cells biochemically transformed with herpesvirus genetic information. Antimicrob Agents Chemother 31: 844-849. [DOI] [PMC free article] [PubMed] [Google Scholar]
- Stefferl A, Brehm U, Linington C (2000) The myelin oligodendrocyte glycoprotein (MOG): a model for antibody-mediated demyelination in experimental autoimmune encephalomyelitis and multiple sclerosis. J Neural Transm Suppl 58: 123-133. [DOI] [PubMed] [Google Scholar]
- Stohlman SA, Hinton DR (2001) Viral induced demyelination. Brain Pathol 11: 92-106. [DOI] [PMC free article] [PubMed] [Google Scholar]
- Sturrock RR (1981) Electron microscopic evidence for mitotic division of oligodendrocytes. J Anat 132: 429-432. [PMC free article] [PubMed] [Google Scholar]
- Sturrock RR, McRae DA (1980) Mitotic division of oligodendrocytes which have begun myelination. J Anat 131: 577-582. [PMC free article] [PubMed] [Google Scholar]
- Swanborg RH (1995) Experimental autoimmune encephalomyelitis in rodents as a model for human demyelinating disease. Clin Immunol Immunopathol 77: 4-13. [DOI] [PubMed] [Google Scholar]
- Tabuchi S, Kume K, Aihara M, Shimizu T (2000) Expression of lysophosphatidic acid receptor in rat astrocytes: mitogenic effect and expression of neurotrophic genes. Neurochem Res 25: 573-582. [DOI] [PubMed] [Google Scholar]
- Trapp BD, Andrews SB, Cootauco C, Quarles R (1989) The myelin-associated glycoprotein is enriched in multivesicular bodies and periaxonal membranes of actively myelinating oligodendrocytes. J Cell Biol 109: 2417-2426. [DOI] [PMC free article] [PubMed] [Google Scholar]
- Uschkureit T, Sporkel O, Stracke J, Bussow H, Stoffel W (2000) Early onset of axonal degeneration in double (plp-/-mag-/-) and hypomyelinosis in triple (plp-/-mbp-/-mag-/-) mutant mice. J Neurosci 20: 5225-5233. [DOI] [PMC free article] [PubMed] [Google Scholar]
- Wallace H, McLaren K, al-Shawi R, Bishop JO (1994) Consequences of thyroid hormone deficiency induced by the specific ablation of thyroid follicle cells in adult transgenic mice. J Endocrinol 143: 107-120. [DOI] [PubMed] [Google Scholar]
- Xie Y, Skinner E, Landry C, Handley V, Schonmann V, Jacobs E, Fisher R, Campagnoni A (2002) Influence of the embryonic preplate on the organization of the cerebral cortex: a targeted ablation model. J Neurosci 22: 8981-8991. [DOI] [PMC free article] [PubMed] [Google Scholar]
- Yajima K, Suzuki K (1979) Demyelination and remyelination in the rat central nervous system following ethidium bromide injection. Lab Invest 41: 385-392. [PubMed] [Google Scholar]
- Zemskova MY, Fodor I (1991) Transient expression of deletion mutants of the herpes simplex virus thymidine kinase-encoding gene in mouse fibroblast cells. Gene 106: 249-253. [DOI] [PubMed] [Google Scholar]