

Abstract
The organization of multisynaptic projections from the prefrontal cortex to the primary motor cortex (MI) was examined in macaque monkeys by retrograde transneuronal transport of rabies virus. In the first series of experiments, the virus was injected into the MI forelimb region, and the time-dependent distribution patterns of transsynaptic labeling were analyzed in the frontal lobe with various survivals (2-4 d). Two days after the viral injection, neuronal labeling emerged in the caudal aspects of the nonprimary motor-related areas that are known to project to the MI directly. At the same time, the motor thalamus contained labeled neurons. On the third day, cortical labeling extended into the rostral motor-related areas and, also, prearcuate area 8. Moreover, a number of labeled neurons were located in the internal pallidum and the cerebellar nuclei. At the 4 d postinjection period, neuronal labeling occurred widely in prefrontal areas as well as in the putamen and the cerebellar cortex. In the second series of experiments, the viral injection was made into the MI hindlimb region, and the distribution pattern of prefrontal labeling on the fourth day was compared with that in the forelimb-injection case. The labeled neurons in each prefrontal area were much fewer in the hindlimb-injection case than in the forelimb-injection case. Whereas ventral area 46 was most densely labeled from the forelimb region, only sparse labeling from the hindlimb region was observed in this prefrontal area. The present results suggest the importance of ventral area 46 in the cognitive control of forelimb movements.
Keywords: prefrontal cortex, primary motor cortex, cortical motor-related areas, somatotopy, basal ganglia, cerebellum
Introduction
The frontal lobe plays crucial roles in the execution and control of various motor behaviors in humans and nonhuman primates. The primary motor cortex (MI), lying in the caudalmost portion of the lobe, has massive projections to the spinal cord in a strict somatotopic manner (He et al., 1993; Galea and Darian-Smith, 1994; Dum and Strick, 1996). This implies the involvement of the MI in the precise control of somatic movements (Georgopoulos et al., 1982; Kakei et al., 1999). In the primate MI, forelimb representation occupies a large sector in the precentral gyrus, thus reflecting the importance of forelimb movements compared with the movements of other body parts. On the other hand, located at the rostral pole of the frontal lobe is the prefrontal cortex that consists of multiple, anatomically distinct areas. These prefrontal areas receive inputs from the parietal association, temporal association, and limbic-related cortical areas (Barbas and Mesulam, 1985; Barbas, 1988; Pandya and Yeterian, 1990; Carmichael and Price, 1995a) and, in turn, send outputs to the frontal motor-related areas (Barbas and Pandya, 1987; Luppino et al., 1993; Lu et al., 1994). It has been proposed that individual areas of the prefrontal cortex play differential roles in the control of voluntary actions according to distinct types of sensory and emotional information. For example, the dorsolateral prefrontal cortex has been implicated in motor selection based on visual information (Wilson et al., 1993; Sakagami and Tsutsui, 1999), whereas the medial prefrontal cortex seems to have certain roles in reward- or context-dependent motor selection (Paus, 2001; Matsumoto et al., 2003). The orbitofrontal cortex is suggested to participate in the reward-dependent control of motor behaviors (Tremblay and Schultz, 1999; Hikosaka and Watanabe, 2000). However, the somatotopic delineation of these prefrontal areas remains unknown. Which prefrontal areas are more strongly involved in motor actions involving the forelimb? So far, it has been difficult to elucidate the pattern of somatotopic representations in the prefrontal cortex. One possible reason is that body part movements cannot be evoked by electrical stimulation in the prefrontal cortex, nor can responses to somatosensory stimuli be elicited in the prefrontal cortex. In addition, neuronal linkage between the prefrontal cortex and the MI is not well understood, because these two structures are interconnected indirectly by way of nonprimary motor-related areas. To address the issue on the somatotopic aspect of the prefrontal cortex in motor control, it is necessary to analyze the multisynaptic connections between the prefrontal cortex and the MI. For this purpose, transneuronal transport of a neurotropic virus is a useful tool. Rabies virus is known to label neurons through synapses in the retrograde direction (Ugolini, 1995; Kelly and Strick, 2000). In the present study, the virus was injected into forelimb representation of the monkey MI, and the time-dependent distributions of transsynaptic labeling were examined in the frontal lobe with varying survivals (2-4 d). The viral injection was further made into hindlimb representation of the MI, and the pattern of prefrontal labeling was compared with that in the forelimb-injection case.
Materials and Methods
Experimental animals. Ten macaque monkeys (six Japanese and four rhesus monkeys) of either sex weighing 5.5-14 kg were used in this study (see Table 1). Throughout the experimental sessions, the monkeys were kept in individual cages placed inside a special safety cabinet. Food and water were available ad libitum in each cage. The experimental protocol was approved by the Animal Care and Use Committee of the Tokyo Metropolitan Institute for Neuroscience (Fuchu, Tokyo, Japan), and all experiments were conducted according to the Tokyo Metropolitan Institute for Neuroscience Guidelines for the Care and Use of Animals (2000).
Table 1.
Summary of experiments
|
Monkey |
Species |
Sex |
Injection site |
Survival (days) |
Injection volume (μl) |
|---|---|---|---|---|---|
| Ma | J | F | Forelimb | 2 | 8.5 |
| Hu | J | M | Forelimb | 3 | 8 |
| Ke | J | F | Forelimb | 3 | 9 |
| Ir | J | F | Forelimb | 3.5 | 10 |
| Ta | R | M | Forelimb | 3.5 | 9 |
| No | J | M | Forelimb | 4 | 8.5 |
| Ji | R | M | Forelimb | 4 | 10 |
| Qu | R | M | Hindlimb | 3 | 8 |
| Ri | R | M | Hindlimb | 4 | 9 |
| Vi |
J |
F |
Hindlimb |
4 |
10 |
F, Female; J, Japanese monkey (Macaca fuscata); M, male; R, rhesus monkey (Macaca mulatta).
Virus. A stock virus suspension of the challenge-virus-standard (CVS-11) strain was prepared by using mouse neuroblastoma cells of A/J (H-2a) as described previously (Smith et al., 1996). This rabies strain was the same as introduced by Ugolini (1995) and Kelly and Strick (2000) to demonstrate specific retrograde transneuronal transport of the virus. The titer of the stock virus suspension was 1.4 × 10⁸ focus-forming units (FFU)/ml. The virus was derived from the Center for Disease Control and Prevention (Atlanta, GA) and amplified at the National Institute of Infectious Diseases (Tokyo, Japan). A viral suspension was kept in small aliquots at -80°C. Each aliquot was thawed in a safety cabinet just before each injection experiment.
Surgical procedures and electrophysiological mapping. For electrophysiological mapping and the subsequent viral injections, a head holder was surgically attached to the monkey's skull under aseptic conditions. The monkeys were sedated with an intramuscular injection of ketamine hydrochloride (5 mg/kg), anesthetized with an intravenous injection of sodium pentobarbital (20 mg/kg), and then positioned in a stereotaxic apparatus. The head holder was fixed on the skull with anchor screws and dental acrylic resin. After recovery periods of several days, the monkeys were anesthetized with an intramuscular injection of ketamine hydrochloride (5-10 mg/kg) and xylazine hydrochloride (0.5-1 mg/kg) and seated in a primate chair with their head fixed in a stereotaxic frame attached to the chair. After partial removal of the skull over the frontal lobe, the precentral gyrus corresponding to the MI was mapped by intracortical microstimulation. A glass-coated elgiloy-alloy microelectrode (0.5-1.5 MΩ at 1 kHz) attached to a manipulator was inserted perpendicular to the dural surface. When trains of 12 cathodal pulses (200 μs duration at 333 Hz; currents of <50 μA) were delivered through a constant-current stimulator, evoked movements of different body parts were carefully examined. To preserve the exposed dural surface, a rectangular chamber was fixed on the skull with acrylic resin.
Viral injection. A few days after the MI mapping, the monkeys received viral injections into the forelimb or hindlimb region of the MI. Under general anesthesia with ketamine hydrochloride (5-10 mg/kg, i.m.) and xylazine hydrochloride (0.5-1 mg/kg, i.m.), each monkey was set in the primate chair in the same manner as in the mapping. A total of 8-10 μl (0.5-1 μl per penetration) of the viral suspension was injected into the identified forelimb or hindlimb region of the MI through a 10 μl Hamilton microsyringe.
Histological procedures. After survival periods of 2-4 d, the monkeys were anesthetized deeply with sodium pentobarbital (50 mg/kg) and perfused transcardially with 0.1 m PBS, pH 7.4, followed by a mixture of 8% formalin and 15% saturated picric acid in 0.1 m phosphate buffer (PB), pH 7.4. The brains were removed from the skull, postfixed in the same fresh fixative overnight, and immersed in PB containing 30% sucrose. Coronal sections were cut serially at 60 μm thickness on a freezing microtome. Every sixth section was immunohistochemically stained for rabies virus with the standard avidin-biotin-peroxidase complex (ABC) method. The detection of rabies virus was performed using a monospecific rabbit antiserum prepared by immunization of His-tagged recombinant nucleoprotein expressed in Escherichia coli (Inoue et al., 2003).
The sections were washed briefly in PBS, soaked with 1% skim milk in PBS for 2 h, and then incubated overnight with the primary antibody (diluted at 1:10,000) in PBS containing 0.1% Triton X-100 and 1% normal goat serum. Subsequently, the sections were incubated for 2 h in the same fresh medium containing biotinylated goat anti-rabbit IgG antibody (diluted at 1:200; Vector Laboratories, Burlingame, CA) and reacted with the ABC kit (ABC Elite; Vector Laboratories). For visualization of the antigen, the sections were reacted in 0.05 m Tris-HCl buffer, pH 7.6, containing 0.04% diaminobenzidine, 0.04% nickel chloride, and 0.002% hydrogen peroxide. After washes in PBS, the sections were mounted onto gelatin-coated glass slides. A series of the adjacent sections (60 μm apart) were mounted and Nissl stained with 1% Neutral red or cresyl violet. The areal boundaries in the frontal lobe were determined primarily based on cytoarchitectonic criteria. For the nomenclature of the prefrontal and motor-related areas, the classification of Barbas and Pandya (1987, 1989) was adopted with some modifications (Fig. 1). The caudal and rostral parts of the dorsal premotor cortices (PMdc and PMdr) in the present paper correspond to area 6DC or 6DR, respectively. Whereas the caudal part of the ventral premotor cortex (PMvc) includes area 4C and the caudal part of area 6Va (caudal to the genu of the arcuate sulcus), the rostral part of the ventral premotor cortex (PMvr) includes the rostral part of area 6Va and area 6Vb (rostral to the genu of the arcuate sulcus).
Figure 1.

Parcellation of the macaque frontal cortex. A, Classification of the prefrontal and motor-related areas used in the present study. B-D, Classification of Barbas and Pandya [(1989), their Fig. 2A-C, reprinted with permission]. CgS, Cingulate sulcus; CS, centralsulcus; iAS, inferior limb of the arcuate sulcus; OLF, olfactory cortex; P All, limbic periallocortex; Pro, proisocortex; ProM, rostral portion of the ventral premotor cortex; PS, principal sulcus; ros, rostral sulcus; sAS, superior limb of the arcuate sulcus; SPS, superior precentral sulcus; spur, spur of the arcuate sulcus; 8, area 8; 9l, lateral area 9; 9m, medial area 9; 46d, dorsal area 46; 46v, ventral area 46. Numbers correspond to the area numbers defined by Barbas and Pandya (1989).
Data analysis. According to electrophysiological mapping data, we prepared the somatotopic map of the MI, which was viewed from the cortical surface. The injection sites of rabies virus in the MI were charted in tracings of equidistant coronal sections and reconstructed on the map. Neuronal labeling in the frontal cortex, the basal ganglia, and the cerebellum was plotted on tracings of representative coronal sections, whereas that in the thalamus was plotted on photomicrographs of corresponding Nissl-stained sections. The number of labeled neurons in each area of the frontal lobe was counted in every 12th section (720 μm apart) by visual inspection under a light microscope. In addition, the distributions of retrograde labeling in the prefrontal cortex in monkeys No and Vi were reconstructed on the unfolded cortical maps. All the unfolded lines were aligned at the fundus of the principal sulcus or, caudally, at the midpoint between the superior and the inferior limb of the arcuate sulcus (Barbas and Pandya, 1987; Hatanaka et al., 2001).
Safety issues. All experiments were performed in a special laboratory (biosafety level 2) designated for in vivo virus experiments. Throughout the experiments, the monkeys were kept in individual cages that were placed in the laboratory. To avoid accidental infection with the virus, all investigators received immunization before the present series of experiments and wore protective clothes during the experimental procedures, including viral injection, feeding, and perfusion. Equipment was disinfected with 70% ethanol after each experimental session. Waste was autoclaved before disposal.
Results
Injection sites of rabies virus in forelimb and hindlimb representations of MI
In 10 monkeys, multiple injections of rabies virus were made into forelimb or hindlimb representation of the MI that had been identified electrophysiologically (Fig. 2, Table 1). Seven monkeys received the viral injections into the MI forelimb region and were allowed to survive for 2 d (monkey Ma), 3 d (monkeys Hu and Ke), 3.5 d (monkeys Ir and Ta), or 4 d (monkeys No and Ji). On the other hand, the remaining three monkeys received the viral injections into the MI hindlimb region and were allowed to survive for 3 d (monkey Qu) or 4 d (monkey Ri and Vi). At the 2 d survival period, accumulations of labeled neurons were observed around the needle track of each injection site (Fig. 3A). For many labeled neurons, not only their cell bodies but also their dendritic trees were clearly visible (Fig. 3B). At the 3-4 d survival periods, dense cell labeling of the injection sites extended for hundreds of micrometers in diameter from the needle tracks. With the different postinjection periods, the distribution patterns of retrograde labeling were analyzed in the frontal lobe, in comparison with those in the basal ganglia and the cerebellum.
Figure 2.

Results of intracortical microstimulation (ICMS) mapping and the sites of rabies virus injection in forelimb (monkey No) or hindlimb (monkey Vi) representation of the MI. Each letter on the cortical surface map denotes the site of electrode penetration, stimulation of which elicited movement predominantly from one of the following body parts: A, Ankle; D, digit (hand); E, elbow; Kn, knee; L, lip; S, shoulder; Tl, tail; To, toe; Tr, trunk; W, wrist; -, locus in which no body movements were elicited by ICMS. Circles indicate the approximate extents of the injection sites. CS, Central sulcus.
Figure 3.

Low- and high-magnification photomicrographs of the injection site in monkey Ma (2 d after the viral injection). In the low-power image (A), clusters of labeled neurons are seen around the injection needle track, and in the high-power image (B), many neurons are labeled in a Golgi-like manner.
On day 2 after viral injection into MI forelimb region
Two days after the viral injection into the forelimb region of the MI, considerable retrograde labeling occurred in the caudal aspects of the nonprimary motor-related areas, which consist of the dorsal and ventral cingulate motor areas (CMAd and CMAv), the supplementary motor area (SMA), and the PMdc and PMvc (see Figs. 1, 4, 7). In contrast, only a small number of labeled neurons were found more rostrally in the frontal lobe (see Fig. 7). At the 2 d postinjection period, many neurons were labeled in the motor thalamus, including the oral division of the ventrolateral nucleus (VLo) and the oral division of the ventroposterolateral nucleus (VPLo) (Fig. 4I-K). Some labeled neurons were further observed in other thalamic nuclei, such as the reticular nucleus, the center median nucleus, and the centrolateral nucleus. More rostrally, labeled neurons were also observed in the basal forebrain (i.e., the substantia innominata; data not shown). However, virtually no neuronal labeling was seen in either the basal ganglia or the cerebellum.
Figure 4.

Distribution patterns of retrograde labeling in the frontal lobe (A-H) and the thalamus (I-K) 2 d after the viral injection into the MI forelimb region (monkey Ma). Eight representative coronal sections through the motor-related areas are arranged rostrocaudally in A-H. The approximate rostrocaudal levels of the sections are indicated in the lateral view of the brain. The dark area in this view specifies the extent of the injection site. Photomicrographs of three representative coronal sections through the motor thalamus are arranged rostrocaudally in I-K. Each dot in the cortex or the thalamus corresponds to two labeled cells or one labeled cell, respectively. CL, Centrolateral nucleus of the thalamus; CM, center median nucleus of the thalamus; CgS, cingulate sulcus; CS, central sulcus; iAS, inferior limb of the arcuate sulcus; IPS, intraparietal sulcus; MD, mediodorsal nucleus of the thalamus; R, reticular nucleus of the thalamus; sAS, superior limb of the arcuate sulcus; SPS, superior precentral sulcus; spur, spur of the arcuate sulcus; 8, area 8.
Figure 7.

A, Diagrams showing the time-dependent changes in the number of labeled neurons in the frontal lobe. Cell counts were performed in every 12th section (60 μm thick; 720 μm apart). The cell number obtained at the 3, 3.5, or 4 d postinjection period is the average of data in monkeys Hu and Ke, Ir and Ta, or No and Ji, respectively, whereas the cell number at the 2 d postinjection period is taken from monkey Ma (see Table 1). Asterisks indicate the areas in which cell counts were not performed, because a tremendous number of neurons were labeled at the 3.5 and 4 d postinjection periods. B, Exponential increases in labeled neuron number with the postinjection period. The ordinate indicates the logarithm for the number of labeled neurons in each area. Black symbols represent the caudal motor-related areas, blue symbols represent the rostral motor-related areas, and red symbols represent the prefrontal areas. Filled purple circles represent area 8 (FEF). 9l, Lateral area 9; 9m, medial area 9; 46d, dorsal area 46; 46v, ventral area 46. Numbers correspond to the area numbers defined by Barbas and Pandya (1989).
On day 3 after viral injection into MI forelimb region
Three days after the viral injection into the MI forelimb region, many more neurons were labeled in the caudal motor-related areas (see Fig. 7). In addition, areas of dense neuronal labeling in the frontal lobe extended into the rostral aspects of the nonprimary motor-related areas such as the rostral cingulate motor area (CMAr), the presupplementary motor area (pre-SMA), and the PMdr and PMvr (see Figs. 1, 5, 7). On the same day, a number of labeled neurons were also found in prearcuate area 8, corresponding to the frontal eye field (FEF) (Huerta et al., 1987). However, only a few labeled neurons were scattered in the prefrontal cortex. Subcortically, neuronal labeling occurred in both the basal ganglia and the cerebellum (data not shown). The labeled neurons in the basal ganglia were located in the internal segment of the globus pallidus (GPi) ipsilateral to the injection site and, further, in the ventral striatum (Kelly and Strick, 2004). In the cerebellum, the labeled neurons were located in the cerebellar nuclei, especially in the dentate nucleus, contralateral to the injection site.
Figure 5.
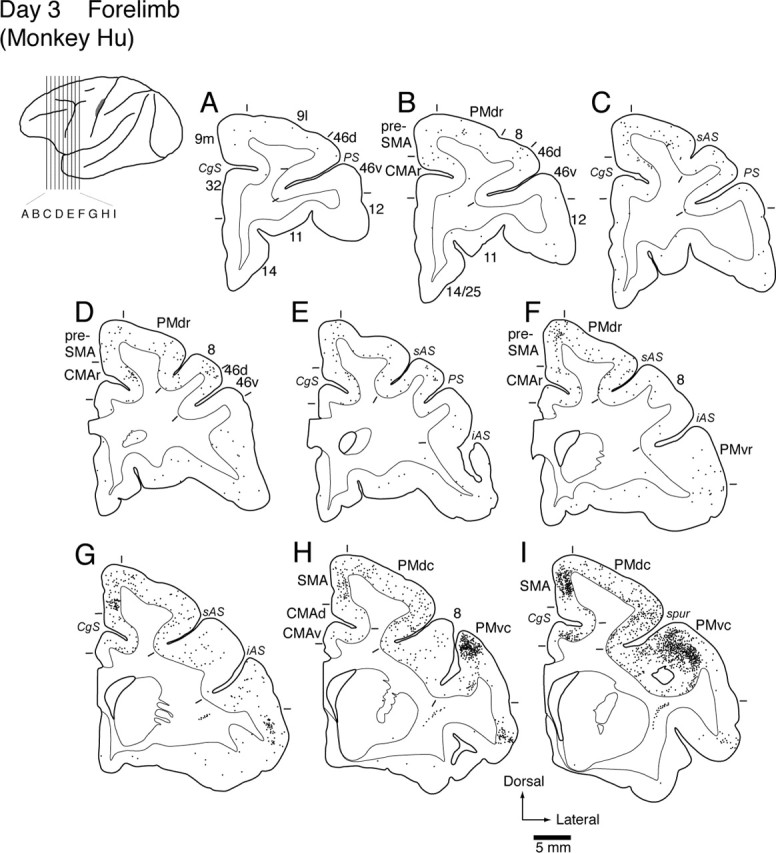
Distribution patterns of retrograde labeling in the frontal lobe 3 d after the viral injection into the MI forelimb region (monkey Hu). Nine representative coronal sections through the motor-related areas and the prefrontal cortex (A-I) are arranged rostrocaudally. The approximate rostrocaudal levels of the sections are indicated in the lateral view of the brain. The dark area in this view specifies the extent of the injection site. Each dot corresponds to two labeled cells. CgS, Cingulate sulcus; iAS, inferior limb of the arcuate sulcus; PS, principal sulcus; sAS, superior limb of the arcuate sulcus; spur, spur of the arcuate sulcus; 9l, lateral area 9; 9m, medial area 9; 46d, dorsal area 46; 46v, ventral area 46. Numbers correspond to the area numbers defined by Barbas and Pandya (1989).
On days 3.5 and 4 after viral injection into MI forelimb region
On day 3.5 after the viral injection into the MI forelimb region, the rostral motor-related areas were much more densely labeled (see Fig. 7). Likewise, neuronal labeling in the FEF became more prominent. At the 3.5 d postinjection period, a substantial number of labeled neurons was seen in many areas of the prefrontal cortex. These areas extensively involved areas 24/32 and medial area 9 on the medial wall, lateral area 9 and dorsal area 46 on the dorsolateral surface, ventral area 46 and area 12 on the ventrolateral surface, and areas 11/13 and 14/25 in the ventral aspect (see Fig. 7; for their cytoarchitectonic divisions, see Fig. 1). In each of the prefrontal areas, the number of labeled neurons was greatly increased 4 d after the viral injection (Figs. 6, 7). Among the prefrontal areas, ventral area 46 was most densely labeled, and, also, dense clusters of labeled neurons were distributed in area 12 and the medial wall areas (i.e., areas 24/32 and medial area 9). Our quantitative analysis revealed that the density of labeled neurons in the frontal lobe, especially in the rostral motor-related and prefrontal areas, went up exponentially at a rate of ∼100 times per day (Fig. 7B).
Figure 6.

A-K, Distribution patterns of retrograde labeling in the frontal lobe 4 d after the viral injection into the MI forelimb region (monkey No). Eleven representative coronal sections through the prefrontal cortex are arranged rostrocaudally (sections G-J represent the levels of the rostral motor-related areas). The approximate rostrocaudal levels of the sections are indicated in the lateral view of the brain. The dark area in this view specifies the extent of the injection site. L, M, Distribution patterns of retrograde labeling in the basal ganglia (L) and the cerebellum (M). In L, clusters of labeled neurons in the internal and external segments of the globus pallidus (GPe) and the putamen (Put) are distributed mainly in their ventral or ventrolateral portions. Note that another cluster of labeled neurons is located far ventromedially within the putamen (Kelly and Strick, 2004). In A-M, each dot corresponds to two labeled cells. CgS, Cingulate sulcus; DN, cerebellar dentate nucleus; iAS, inferior limb of the arcuate sulcus; IN, cerebellar interpositus nucleus; PS, principal sulcus; sAS, superior limb of the arcuate sulcus; spur, spur of the arcuate sulcus; STN, subthalamic nucleus; ZI, zona incerta; 9l, lateral area 9; 9m, medial area 9; 46d, dorsal area 46; 46v, ventral area 46. Numbers correspond to the area numbers defined by Barbas and Pandya (1989).
Moreover, a large number of labeled neurons was located in the basal ganglia and the cerebellum at the postinjection periods of 3.5 and 4 d. Neuronal labeling in the basal ganglia was observed not only in the GPi and the ventral striatum but also in the putamen, the external segment of the globus pallidus, and the subthalamic nucleus (Fig. 6L). In the cerebellar nuclei, the labeled neurons were found predominantly in the dentate nucleus and, to a lesser extent, in the interpositus nuclei (Fig. 6M). Especially at the 4 d postinjection period, Purkinje cells in the cerebellar cortex were labeled to some extent (Fig. 6M).
Differential distributions of neuronal labeling from forelimb versus hindlimb regions of MI
When the virus was injected into the hindlimb region of the MI, many neurons were retrogradely labeled in the frontal motor-related areas with survivals of 3 and 4 d. At the 3 d postinjection period, neuronal labeling was seen abundantly in the caudal motor-related areas. The labeled neurons were distributed mainly in the CMAd and CMAv around the cingulate sulcus and the PMdc medial to the superior precentral sulcus (data not shown). At the 4 d postinjection period, the rostral motor-related areas contained a large number of labeled neurons, especially in the CMAr and PMdr (Fig. 8C-F). Neuronal labeling in the prefrontal cortex was also clearly observed (Fig. 8A,B). The total number of prefrontal neurons labeled from the MI hindlimb region (mean for two monkeys, 3648 cells counted in every 12th section) was 10 times smaller than that in the forelimb-injection case (mean, 38000 cells), although the injected sites in each region covered almost comparable cortical areas (Figs. 2, 9). In addition, the distribution pattern of the labeled neurons from the hindlimb region was different from the distribution pattern of those from the forelimb region (Figs. 9, 10). After the viral injection into the MI hindlimb region, many labeled neurons were located in area 12 and the medial wall areas (i.e., areas 24/32 and medial area 9). Other prefrontal areas exhibited sparse neuron labeling. Of particular interest was that only a few labeled neurons were found in ventral area 46 that was most densely labeled from the MI forelimb region (Figs. 9, 10). Similar findings were obtained in the FEF (i.e., prearcuate area 8). Although strong labeling of FEF neurons was seen 4 d after the viral injection into the MI forelimb region, the FEF was essentially devoid of labeled neurons (Figs. 8, 9).
Figure 8.

Distribution patterns of retrograde labeling in the frontal lobe (A-H), the basal ganglia (I), and the cerebellum (J, K) 4 d after the viral injection into the MI hindlimb region (monkey Vi). Eight representative coronal sections through the prefrontal cortex are arranged rostrocaudally in A-H. The approximate rostrocaudal levels of the sections are indicated in the lateral view of the brain. The dark area in this view specifies the extent of the injection site. In I, clusters of labeled neurons in the GPi, external segments of the globus pallidus (GPe), and the putamen (Put) are distributed more dorsally than those seen after the viral injection into the MI forelimb region (see Fig. 6 L). As in the forelimb-injection case, another cluster of labeled neurons is located far ventromedially within the putamen (Kelly and Strick, 2004). In this case, the labeling of Purkinje cells occurs at the rostral level of the cerebellar cortex (J), and the labeled neurons in the cerebellar dentate nucleus (DN) and cerebellar interpositus nucleus (IN) are distributed more rostrally than in the forelimb-injection case (see Fig. 6 M). Each dot in A-K corresponds to two labeled cells. CgS, Cingulate sulcus; iAS, inferior limb of the arcuate sulcus; PS, principal sulcus; sAS, superior limb of the arcuate sulcus; spur, spur of the arcuate sulcus; STN, subthalamic nucleus; ZI, zona incerta; 9l, lateral area 9; 9m, medial area 9; 46d, dorsal area 46; 46v, ventral area 46. Numbers correspond to the area numbers defined by Barbas and Pandya (1989).
Figure 9.
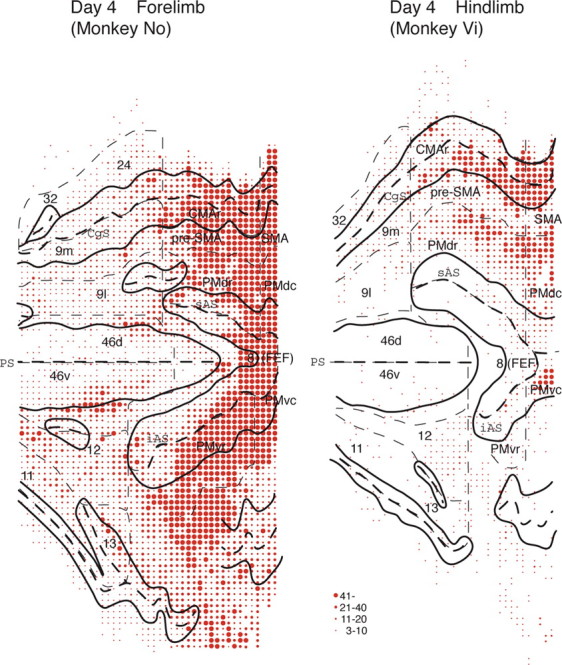
Surface-view reconstructions showing the distribution patterns of labeled neurons in the prefrontal cortex 4 d after the viral injections into the forelimb (monkey No) or hindlimb (monkey Vi) region of the MI. Black solid and dashed lines indicate the gyri and the fundi of the sulci, respectively. Thinner dashed lines denote the boundaries among the prefrontal areas. Four different sizes of filled circles represent the ranges of labeled neuron number. CgS, Cingulate sulcus; iAS, inferior limb of the arcuate sulcus; PS, principal sulcus; sAS, superior limb of the arcuate sulcus; 9l, lateral area 9; 9m, medial area 9; 46d, dorsal area 46; 46v, ventral area 46. Numbers correspond to the area numbers defined by Barbas and Pandya (1989).
Figure 10.

Diagram showing the differential distributions of neuronal labeling in the prefrontal cortex 4 d after the viral injections into the forelimb or hindlimb region of the MI (see also Fig. 9). A, B, Comparison of data obtained in two monkeys that received the injections into the forelimb region (A; monkeys Ji and No) or hindlimb region (B; monkeys Ri and Vi). Each bar represents the ratio of the labeled neuron number to the total number of labeled prefrontal neurons. Note that in each of the forelimb- and hindlimb-injection cases, the data are mostly consistent in the two monkeys. C, Comparison of the forelimb-versus hindlimb-injection cases. Filled and open bars indicate the average of the data obtained in the two monkeys shown in A and B, respectively.
On days 3 and 4 after the viral injection into the MI hindlimb region, neuronal labeling was evident in the basal ganglia on the same side and in the cerebellum on the opposite side. Especially at the postinjection period of 4 d, dense clusters of labeled neurons in the pallidal complex and the putamen were observed more dorsally than those seen after the injection into the MI forelimb region (compare Figs. 6L, 8I). The distribution pattern in the putamen of neuronal labeling from the forelimb and hindlimb regions was in good accordance with the topography of corticostriatal terminals from these MI regions (Flaherty and Graybiel, 1993; Takada et al., 1998; Kelly and Strick, 2004). The labeled neurons in the cerebellar nuclei (i.e., the dentate and interpositus nuclei) were distributed predominantly in their rostral portions, whereas those in the forelimb-injection case were distributed more caudally (compare Figs. 6M, 8K). At the 4 d postinjection period, a number of Purkinje cells were labeled more rostrally in the cerebellar cortex than those in the forelimb-injection case (compare Figs. 6M, 8J). Thus, our findings revealed that the somatotopic arrangement (forelimb vs hindlimb) of the basal ganglia and the cerebellum was in favor of the previously reported patterns (Hoover and Strick, 1999; Dum and Strick, 2003; Kelly and Strick, 2003, 2004).
Discussion
To use rabies virus for visualization of multisynaptic connections, it is crucial to determine the specificity and rate of transneuronal labeling. For this purpose, we first examined the time-dependent spread of subcortical labeling after viral injections into the MI forelimb region. Consistent with the results of the studies of Kelly and Strick (2003, 2004), neuronal labeling occurred sequentially along the known cortico-basal ganglia and corticocerebellar pathways. Two days after the injection, thalamic neurons were labeled mainly in the VLo and VPLo that project to the MI directly. Relatively sparse labeling of these thalamic neurons indicates that a little longer time than 2 d may be needed for sufficient labeling of first-order neurons (for comparison with conventional tracing, see Holsapple et al., 1991; Shindo et al., 1995). At a 3 d postinjection period, both the GPi and the cerebellar nuclei contained labeled neurons. On the fourth day, neuronal labeling in the putamen and the cerebellar cortex became prominent. These results suggest that it takes ∼2 d for first-order neuron labeling and 1 additional day per synapse for the subsequent transneuronal labeling. It should be noted, however, that the time course of transneuronal labeling seems somewhat different among neuron types, as shown in the rat brainstem (Ugolini, 1995). For example, reticular thalamic neurons that have no direct projection to the MI were labeled at a 2 d survival. This may be attributable to exceptionally fast labeling of second-order neurons through the VLo and VPLo, because it has been reported that those neurons are readily labeled in a transsynaptic manner (Itoh et al., 1984). Furthermore, striatal projection neurons tended to be more readily labeled as third-order neurons than cerebellar Purkinje cells. On the other hand, neuronal labeling in the ventral striatum may possibly be attributed to second-order labeling via cholinergic neurons in the basal forebrain that project to the MI monosynaptically, because the basal forebrain labeled initially at a 2 d survival receives input from the ventral striatum, in which labeled neurons were found at a 3 d survival (Haber et al., 1990).
In the frontal cortex, retrograde labeling at a 2 d postinjection period occurred in the caudal motor-related areas, the PMdc, PMvc, SMA, CMAd, and CMAv, that send projection fibers directly to the MI (Muakkassa and Strick, 1979; Tokuno and Tanji, 1993; Hatanaka et al., 2001). At this stage, neurons in the rostral motor-related areas were only sparsely labeled, although part of the areas (i.e., the CMAr) has relatively weak projections to the MI (Dum and Strick, 1991; Takada et al., 2004). On the third day, substantial neuronal labeling extended over the rostral motor-related areas, including the PMdr, PMvr, pre-SMA, and CMAr. Because these areas were labeled simultaneously with the GPi and the cerebellar nuclei, the labeled neurons may probably correspond to second-order neurons. Likewise, many of the labeled neurons in the prefrontal cortex can be considered third-order neurons, because conspicuous labeling of striatal neurons and Purkinje cells appeared coincidently. Our quantitative analysis has revealed that the number of labeled neurons was increased exponentially, first in the caudal motor-related areas, then in the rostral motor-related areas, and finally in the prefrontal areas (Bates and Goldman-Rakic, 1993; Luppino et al., 2003; Takada et al., 2004). In addition, the rapid increase in labeled neuron number could be ascribed to transneuronal labeling through intrinsic and/or bypath circuits. It should also be emphasized here that viral transport might not necessarily be restricted to the frontal lobe. The posterior parietal cortex, for instance, may mediate transport from the MI to the premotor and prefrontal areas (Cavada and Goldman-Rakic, 1989; Stanton et al., 1995). Labeling of prefrontal areas may be achieved via the ventral striatumbasal forebrain-MI link (Haber et al., 1990; Ferry et al., 2000).
The primary goals of the present study were (1) to elucidate whether or not the forelimb might specifically be represented in particular areas of the prefrontal cortex and (2) to explore whether or not the forelimb versus the hindlimb might differentially be represented in the prefrontal cortex.
The present results have demonstrated that ventral area 46 was most strongly labeled with rabies virus injected into forelimb representation of the MI. In contrast, dorsal area 46 exhibited much weaker labeling. This indicates that ventral area 46, but not dorsal area 46, is preferentially involved in the control of forelimb movements, albeit both areas are directly interconnected with the rostral motor-related areas (Arikuni et al., 1980; Barbas and Pandya, 1987; Lu et al., 1994; Takada et al., 2004). Consistent with our findings, previous physiological studies have reported that ventral area 46 neurons were specifically activated during the performance of delayed response tasks, in which monkeys responded manually (di Pellegrino and Wise, 1991; Hoshi et al., 1998; Rainer et al., 1998). On the other hand, both ventral and dorsal area 46 neurons responded to delayed oculomotor tasks (Funahashi et al., 1990, 1991). From an anatomical point of view, ventral area 46 and area 12 receive inputs mainly from the posterior parietal cortex (primarily area 7b) and the inferior temporal cortex, respectively (Barbas and Mesulam, 1985; Barbas, 1988; Cavada and Goldman-Rakic, 1989; Seltzer and Pandya, 1989; Carmichael and Price, 1995b). Moreover, it has been shown that posterior parietal neurons respond to forelimb movements as well as to somatosensory or visual stimuli (Dong et al., 1994; Calton et al., 2002).
The medial prefrontal cortex, including areas 24/32 and medial area 9, was another site of dense labeling from the MI forelimb region. Anatomical data to date indicate that these areas have direct interconnections with the rostral motor-related areas, such as the pre-SMA, CMAr, and PMdr (Barbas and Pandya, 1987; Luppino et al., 1993). Also, the medial prefrontal areas receive limbic (emotional or motivational) information from the amygdala and the parahippocampal cortex, as well as polymodal sensory information from the superior temporal cortex and the granular insular cortex (Barbas, 1988; Seltzer and Pandya, 1989; Barbas et al., 1999). Recently, physiological studies in humans and nonhuman primates have suggested that the medial prefrontal areas, including regions in the anterior cingulate cortex, participate in the selection of motor behaviors based on context or reward (Paus, 2001; Swick and Turken, 2002; Dreher and Grafman, 2003; Isomura et al., 2003; Matsumoto et al., 2003). Thus, the strong connectivity to the MI forelimb region implies that the medial prefrontal areas may be responsible for cognitive control of forelimb movements.
To address the issue on prefrontal representations of the forelimb versus the hindlimb, we compared the distribution patterns of prefrontal labeling from both regions of the MI. In the prefrontal cortex, much fewer neurons were labeled from the hindlimb than forelimb region. Ventral area 46, which had the densest labeling from forelimb representation, displayed only sparse labeling from hindlimb representation. Instead, the strongest labeling from hindlimb representation was located on the medial wall, especially in areas 24/32 and medial area 9. These findings imply that the medial prefrontal areas might closely be associated with the control of not only forelimb but also hindlimb movements.
In the present study, the viral injection into the MI forelimb region yielded labeling in prearcuate area 8, corresponding to the FEF. Substantial labeling of FEF neurons occurred as early as 3 d after the injection. This timing of transneuronal labeling coincides well with the timing for the rostral motor-related areas rather than the timing for the prefrontal areas. In the hindlimb-injection case, on the other hand, only a few neurons were labeled in the FEF even on the fourth day. These data indicate that the FEF is strongly and specifically interconnected, via one synapse, with the MI forelimb region. This seems intriguing given that the FEF has rarely been implicated in the control of forelimb movements. Two pieces of evidence have addressed the issue on the possible involvement of the FEF in somatic motor control. Arikuni et al. (1988) have reported the existence of reciprocal connections between the FEF and the premotor cortex. Oishi and Kubota (1990) have shown that disinhibition of the FEF with the GABA antagonist bicuculline induces forelimb movements in behaving monkeys. Together, the present results suggest that the FEF is likely to play an essential role not only in the control of eye movements per se, but also in the control of eye-hand coordinative behaviors.
The present data define anatomical evidence for the differential patterns of distribution of prefrontal neurons that are multisynaptically connected with forelimb versus hindlimb representations of the MI. Our results favor a notion that cognitive behaviors based on prefrontal signals must be accompanied more frequently by actions manipulated with the forelimb than those with the hindlimb. Thus, the input systems from the prefrontal cortex to the MI might be developed in a use-dependent manner. Furthermore, the present results indicate that the medial prefrontal areas strongly innervate both the forelimb and the hindlimb regions of the MI in a multisynaptic manner. This suggests that movements of not only the forelimb but also the hindlimb could be influenced by signals derived from the prefrontal areas that receive limbic (amygdalar and hippocampal) inputs.
Footnotes
This work was supported by Grants-in-Aid for Scientific Research (B) and for Scientific Research on Priority Areas from the Ministry of Education, Culture, Sports, Science and Technology of Japan. We are grateful to Etsuko Mine for technical assistance.
Correspondence should be addressed to Dr. Shigehiro Miyachi, Department of System Neuroscience, Tokyo Metropolitan Institute for Neuroscience, Tokyo Metropolitan Organization for Medical Research, 2-6 Musashidai, Fuchu, Tokyo 183-8526, Japan. E-mail: miyachi@tmin.ac.jp.
Copyright © 2005 Society for Neuroscience 0270-6474/05/252547-10$15.00/0
References
- Arikuni T, Sakai M, Hamada I, Kubota K (1980) Topographical projections from the prefrontal cortex to the post-arcuate area in the rhesus monkey, studied by retrograde axonal transport of horseradish peroxidase. Neurosci Lett 19: 155-160. [DOI] [PubMed] [Google Scholar]
- Arikuni T, Watanabe K, Kubota K (1988) Connections of area 8 with area 6 in the brain of the macaque monkey. J Comp Neurol 277: 21-40. [DOI] [PubMed] [Google Scholar]
- Barbas H (1988) Anatomic organization of basoventral and mediodorsal visual recipient prefrontal regions in the rhesus monkey. J Comp Neurol 276: 313-342. [DOI] [PubMed] [Google Scholar]
- Barbas H, Mesulam MM (1985) Cortical afferent input to the principalis region of the rhesus monkey. Neuroscience 15: 619-637. [DOI] [PubMed] [Google Scholar]
- Barbas H, Pandya DN (1987) Architecture and frontal cortical connections of the premotor cortex (area 6) in the rhesus monkey. J Comp Neurol 256: 211-228. [DOI] [PubMed] [Google Scholar]
- Barbas H, Pandya DN (1989) Architecture and intrinsic connections of the prefrontal cortex in the rhesus monkey. J Comp Neurol 286: 353-375. [DOI] [PubMed] [Google Scholar]
- Barbas H, Ghashghaei H, Dombrowski SM, Rempel-Clower NL (1999) Medial prefrontal cortices are unified by common connections with superior temporal cortices and distinguished by input from memory-related areas in the rhesus monkey. J Comp Neurol 410: 343-367. [DOI] [PubMed] [Google Scholar]
- Bates JF, Goldman-Rakic PS (1993) Prefrontal connections of medial motor areas in the rhesus monkey. J Comp Neurol 336: 211-228. [DOI] [PubMed] [Google Scholar]
- Calton JL, Dickinson AR, Snyder LH (2002) Non-spatial, motor-specific activation in posterior parietal cortex. Nat Neurosci 5: 580-588. [DOI] [PubMed] [Google Scholar]
- Carmichael ST, Price JL (1995a) Limbic connections of the orbital and medial prefrontal cortex in macaque monkeys. J Comp Neurol 363: 615-641. [DOI] [PubMed] [Google Scholar]
- Carmichael ST, Price JL (1995b) Sensory and premotor connections of the orbital and medial prefrontal cortex of macaque monkeys. J Comp Neurol 363: 642-664. [DOI] [PubMed] [Google Scholar]
- Cavada C, Goldman-Rakic PS (1989) Posterior parietal cortex in rhesus monkey: II. Evidence for segregated corticocortical networks linking sensory and limbic areas with the frontal lobe. J Comp Neurol 287: 422-445. [DOI] [PubMed] [Google Scholar]
- di Pellegrino G, Wise SP (1991) A neurophysiological comparison of three distinct regions of the primate frontal lobe. Brain 114: 951-978. [DOI] [PubMed] [Google Scholar]
- Dong WK, Chudler EH, Sugiyama K, Roberts VJ, Hayashi T (1994) Somatosensory, multisensory, and task-related neurons in cortical area 7b (PF) of unanesthetized monkeys. J Neurophysiol 72: 542-564. [DOI] [PubMed] [Google Scholar]
- Dreher JC, Grafman J (2003) Dissociating the roles of the rostral anterior cingulate and the lateral prefrontal cortices in performing two tasks simultaneously or successively. Cereb Cortex 13: 329-339. [DOI] [PubMed] [Google Scholar]
- Dum RP, Strick PL (1991) The origin of corticospinal projections from the premotor areas in the frontal lobe. J Neurosci 11: 667-689. [DOI] [PMC free article] [PubMed] [Google Scholar]
- Dum RP, Strick PL (1996) Spinal cord terminations of the medial wall motor areas in macaque monkeys. J Neurosci 16: 6513-6525. [DOI] [PMC free article] [PubMed] [Google Scholar]
- Dum RP, Strick PL (2003) An unfolded map of the cerebellar dentate nucleus and its projections to the cerebral cortex. J Neurophysiol 89: 634-639. [DOI] [PubMed] [Google Scholar]
- Ferry AT, Ongur D, An X, Price JL (2000) Prefrontal cortical projections to the striatum in macaque monkeys: evidence for an organization related to prefrontal networks. J Comp Neurol 425: 447-470. [DOI] [PubMed] [Google Scholar]
- Flaherty AW, Graybiel AM (1993) Two input systems for body representations in the primate striatal matrix: experimental evidence in the squirrel monkey. J Neurosci 13: 1120-1137. [DOI] [PMC free article] [PubMed] [Google Scholar]
- Funahashi S, Bruce CJ, Goldman-Rakic PS (1990) Visuospatial coding in primate prefrontal neurons revealed by oculomotor paradigms. J Neurophysiol 63: 814-831. [DOI] [PubMed] [Google Scholar]
- Funahashi S, Bruce CJ, Goldman-Rakic PS (1991) Neuronal activity related to saccadic eye movements in the monkey's dorsolateral prefrontal cortex. J Neurophysiol 65: 1464-1483. [DOI] [PubMed] [Google Scholar]
- Galea MP, Darian-Smith I (1994) Multiple corticospinal neuron populations in the macaque monkey are specified by their unique cortical origins, spinal terminations, and connections. Cereb Cortex 4: 166-194. [DOI] [PubMed] [Google Scholar]
- Georgopoulos AP, Kalaska JF, Caminiti R, Massey JT (1982) On the relations between the direction of two-dimensional arm movements and cell discharge in primate motor cortex. J Neurosci 2: 1527-1537. [DOI] [PMC free article] [PubMed] [Google Scholar]
- Haber SN, Lynd E, Klein C, Groenewegen HJ (1990) Topographic organization of the ventral striatal efferent projections in the rhesus monkey: an anterograde tracing study. J Comp Neurol 293: 282-298. [DOI] [PubMed] [Google Scholar]
- Hatanaka N, Nambu A, Yamashita A, Takada M, Tokuno H (2001) Somatotopic arrangement and corticocortical inputs of the hindlimb region of the primary motor cortex in the macaque monkey. Neurosci Res 40: 9-22. [DOI] [PubMed] [Google Scholar]
- He SQ, Dum RP, Strick PL (1993) Topographic organization of corticospinal projections from the frontal lobe: motor areas on the lateral surface of the hemisphere. J Neurosci 13: 952-980. [DOI] [PMC free article] [PubMed] [Google Scholar]
- Hikosaka K, Watanabe M (2000) Delay activity of orbital and lateral prefrontal neurons of the monkey varying with different rewards. Cereb Cortex 10: 263-271. [DOI] [PubMed] [Google Scholar]
- Holsapple JW, Preston JB, Strick PL (1991) The origin of thalamic inputs to the “hand” representation in the primary motor cortex. J Neurosci 11: 2644-2654. [DOI] [PMC free article] [PubMed] [Google Scholar]
- Hoover JE, Strick PL (1999) The organization of cerebellar and basal ganglia outputs to primary motor cortex as revealed by retrograde transneuronal transport of herpes simplex virus type 1. J Neurosci 19: 1446-1463. [DOI] [PMC free article] [PubMed] [Google Scholar]
- Hoshi E, Shima K, Tanji J (1998) Task-dependent selectivity of movement-related neuronal activity in the primate prefrontal cortex. J Neurophysiol 80: 3392-3397. [DOI] [PubMed] [Google Scholar]
- Huerta MF, Krubitzer LA, Kaas JH (1987) Frontal eye field as defined by intracortical microstimulation in squirrel monkeys, owl monkeys, and macaque monkeys. II. Cortical connections. J Comp Neurol 265: 332-361. [DOI] [PubMed] [Google Scholar]
- Inoue S, Sato Y, Hasegawa H, Noguchi A, Yamada A, Kurata T, Iwasaki T (2003) Cross-reactive antigenicity of nucleoproteins of lyssaviruses recognized by a monospecific anti-rabies virus nucleoprotein antiserum on paraffin sections of formalin-fixed tissues. Pathol Int 53: 525-533. [DOI] [PubMed] [Google Scholar]
- Isomura Y, Ito Y, Akazawa T, Nambu A, Takada M (2003) Neural coding of “attention for action” and “response selection” in primate anterior cingulate cortex. J Neurosci 23: 8002-8012. [DOI] [PMC free article] [PubMed] [Google Scholar]
- Itoh K, Yasui Y, Takada M, Mitani A, Kaneko T, Sugimoto T, Mizuno N (1984) An anterograde-retrograde transneuronal transport of conjugates of wheat germ agglutinin with horseradish peroxidase (WGA-HRP): labeling of neurons in the reticular nucleus of the thalamus with WGA-HRP injected into the posterior column nuclei in the cat. Brain Res 323: 185-187. [DOI] [PubMed] [Google Scholar]
- Kakei S, Hoffman DS, Strick PL (1999) Muscle and movement representations in the primary motor cortex. Science 285: 2136-2139. [DOI] [PubMed] [Google Scholar]
- Kelly RM, Strick PL (2000) Rabies as a transneuronal tracer of circuits in the central nervous system. J Neurosci Methods 103: 63-71. [DOI] [PubMed] [Google Scholar]
- Kelly RM, Strick PL (2003) Cerebellar loops with motor cortex and prefrontal cortex of a nonhuman primate. J Neurosci 23: 8432-8444. [DOI] [PMC free article] [PubMed] [Google Scholar]
- Kelly RM, Strick PL (2004) Macro-architecture of basal ganglia loops with the cerebral cortex: use of rabies virus to reveal multisynaptic circuits. Prog Brain Res 143: 449-459. [DOI] [PubMed] [Google Scholar]
- Lu MT, Preston JB, Strick PL (1994) Interconnections between the prefrontal cortex and the premotor areas in the frontal lobe. J Comp Neurol 341: 375-392. [DOI] [PubMed] [Google Scholar]
- Luppino G, Matelli M, Camarda R, Rizzolatti G (1993) Corticocortical connections of area F3 (SMA-proper) and area F6 (pre-SMA) in the macaque monkey. J Comp Neurol 338: 114-140. [DOI] [PubMed] [Google Scholar]
- Luppino G, Rozzi S, Calzavara R, Matelli M (2003) Prefrontal and agranular cingulate projections to the dorsal premotor areas F2 and F7 in the macaque monkey. Eur J Neurosci 17: 559-578. [DOI] [PubMed] [Google Scholar]
- Matsumoto K, Suzuki W, Tanaka K (2003) Neuronal correlates of goal-based motor selection in the prefrontal cortex. Science 301: 229-232. [DOI] [PubMed] [Google Scholar]
- Muakkassa KF, Strick PL (1979) Frontal lobe inputs to primate motor cortex: evidence for four somatotopically organized “premotor” areas. Brain Res 177: 176-182. [DOI] [PubMed] [Google Scholar]
- Oishi T, Kubota K (1990) Disinhibition in the monkey prefrontal cortex, by injecting bicuculline, induces forelimb movements learned in a GO/NO-GO task. Neurosci Res 8: 202-209. [DOI] [PubMed] [Google Scholar]
- Pandya DN, Yeterian EH (1990) Prefrontal cortex in relation to other cortical areas in rhesus monkey: architecture and connections. Prog Brain Res 85: 63-94. [DOI] [PubMed] [Google Scholar]
- Paus T (2001) Primate anterior cingulate cortex: where motor control, drive and cognition interface. Nat Rev Neurosci 2: 417-424. [DOI] [PubMed] [Google Scholar]
- Rainer G, Asaad WF, Miller EK (1998) Memory fields of neurons in the primate prefrontal cortex. Proc Natl Acad Sci USA 95: 15008-15013. [DOI] [PMC free article] [PubMed] [Google Scholar]
- Sakagami M, Tsutsui K (1999) The hierarchical organization of decision making in the primate prefrontal cortex. Neurosci Res 34: 79-89. [DOI] [PubMed] [Google Scholar]
- Seltzer B, Pandya DN (1989) Frontal lobe connections of the superior temporal sulcus in the rhesus monkey. J Comp Neurol 281: 97-113. [DOI] [PubMed] [Google Scholar]
- Shindo K, Shima K, Tanji J (1995) Spatial distribution of thalamic projections to the supplementary motor area and the primary motor cortex: a retrograde multiple labeling study in the macaque monkey. J Comp Neurol 357: 98-116. [DOI] [PubMed] [Google Scholar]
- Smith JS, Yager PA, Baer GM (1996) A rapid tissue culture test for determining rabies-neutralizing antibody. In: Laboratory techniques in rabies, Ed 4 (Meslin FX, Kaplan MM, Koprowski H, eds), pp 371-373. Geneva: World Health Organization. [PubMed]
- Stanton GB, Bruce CJ, Goldberg ME (1995) Topography of projections to posterior cortical areas from the macaque frontal eye fields. J Comp Neurol 353: 291-305. [DOI] [PubMed] [Google Scholar]
- Swick D, Turken AU (2002) Dissociation between conflict detection and error monitoring in the human anterior cingulate cortex. Proc Natl Acad Sci USA 99: 16354-16359. [DOI] [PMC free article] [PubMed] [Google Scholar]
- Takada M, Tokuno H, Nambu A, Inase M (1998) Corticostriatal projections from the somatic motor areas of the frontal cortex in the macaque monkey: segregation versus overlap of input zones from the primary motor cortex, the supplementary motor area, and the premotor cortex. Exp Brain Res 120: 114-128. [DOI] [PubMed] [Google Scholar]
- Takada M, Nambu A, Hatanaka N, Tachibana Y, Miyachi S, Taira M, Inase M (2004) Organization of prefrontal outflow toward frontal motor-related areas in macaque monkeys. Eur J Neurosci 19: 3328-3342. [DOI] [PubMed] [Google Scholar]
- Tokuno H, Tanji J (1993) Input organization of distal and proximal forelimb areas in the monkey primary motor cortex: a retrograde double labeling study. J Comp Neurol 333: 199-209. [DOI] [PubMed] [Google Scholar]
- Tremblay L, Schultz W (1999) Relative reward preference in primate orbitofrontal cortex. Nature 398: 704-708. [DOI] [PubMed] [Google Scholar]
- Ugolini G (1995) Specificity of rabies virus as a transneuronal tracer of motor networks: transfer from hypoglossal motoneurons to connected second-order and higher order central nervous system cell groups. J Comp Neurol 356: 457-480. [DOI] [PubMed] [Google Scholar]
- Wilson FA, Scalaidhe SP, Goldman-Rakic PS (1993) Dissociation of object and spatial processing domains in primate prefrontal cortex. Science 260: 1955-1958. [DOI] [PubMed] [Google Scholar]