Abstract
Synaptic cell adhesion is central for synapse formation and function. Recently, the synaptic cell adhesion molecules neuroligin 1 (NL1) and SynCAM were shown to induce presynaptic differentiation in cocultured neurons when expressed in a non-neuronal cell. However, it is uncertain how similar the resulting artificial synapses are to regular synapses. Are these molecules isofunctional, or do all neuronal cell adhesion molecules nonspecifically activate synapse formation? To address these questions, we analyzed the properties of artificial synapses induced by NL1 and SynCAM, compared the actions of these molecules with those of other neuronal cell adhesion molecules, and examined the functional effects of NL1 and SynCAM overexpression in neurons. We found that only NL1 and SynCAM specifically induced presynaptic differentiation in cocultured neurons. The induced nerve terminals were capable of both spontaneous and evoked neurotransmitter release, suggesting that a full secretory apparatus was assembled. By all measures, SynCAM- and NL1-induced artificial synapses were identical. Overexpression in neurons demonstrated that only SynCAM, but not NL1, increased synaptic function in immature developing excitatory neurons after 8 d in vitro. Tests of chimeric molecules revealed that the dominant-positive effect of SynCAM on synaptic function in developing neurons was mediated by its intracellular cytoplasmic tail. Interestingly, morphological analysis of neurons overexpressing SynCAM or NL1 showed the opposite of the predictions from electrophysiological results. In this case, only NL1 increased the synapse number, suggesting a role for NL1 in morphological synapse induction. These results suggest that both NL1 and SynCAM act similarly and specifically in artificial synapse induction but that this process does not reflect a shared physiological function of these molecules.
Keywords: neuroligin, SynCAM, synaptogenesis, hippocampal neuron, cell adhesion, neurotransmitter release
Introduction
At a synapse, presynaptic and postsynaptic specializations are thought to be connected by cell adhesion molecules that participate in synaptogenesis, mediate the precise positioning of presynaptic and postsynaptic elements, and contribute to transsynaptic signaling (Rao et al., 2000; Goda and Davis, 2003; Rougon and Hobert, 2003; Scheiffele, 2003; Ziv and Garner, 2004). On the presynaptic side, transsynaptic cell adhesion molecules may organize the nucleation of the presynaptic machinery at nascent active zones and shape the molecular composition of synaptic terminals as shown, for example, for α-neurexins (Missler et al., 2003). On the postsynaptic side, these molecules may enable clustering of neurotransmitter receptors, postsynaptic scaffolding proteins, and associated signal transduction molecules as demonstrated, for example, for stargazins (Chen et al., 2000; Schnell et al., 2002).
Recently, two synaptic cell adhesion molecules, neuroligin 1 (NL1) and SynCAM, were found to be powerful inducers of synapse formation in an artificial system (Scheiffele et al., 2000; Biederer et al., 2002; Dean et al., 2003). NL1 is a postsynaptic cell adhesion molecule whose extracellular sequence is primarily composed of an esterase-like domain (Ichtchenko et al., 1995; Song et al., 1999). Extracellularly, NL1 binds to β-neurexins and presumptive presynaptic cell adhesion molecules and forms a transcellular junction with neurexins (Nguyen and Sudhof, 1997). Intracellularly, NL1 interacts with PSD-95 (postsynaptic density-95) (Irie et al., 1997). NL1 belongs to a family of related proteins (Ichtchenko et al., 1996), some of which are encoded by genes that are mutant in rare families with familial autism (Jamain et al., 2003; Laumonnier et al., 2004). SynCAM, also referred to as IGSF4, is an Ig superfamily protein that is present on both presynaptic and postsynaptic membranes (Biederer et al., 2002). SynCAM is subject to developmentally regulated glycosylation and extracellularly binds to itself, thereby mediating the formation of homotypic transcellular junctions (Biederer et al., 2002). Intracellularly, SynCAM binds to CASK (calcium/calmodulin-dependent serine protein kinase). Thus, although NL1 and SynCAM are both cell adhesion molecules that bind to intracellular PDZ (PSD-95/Discs large/zona occludens-1) domain proteins, they are otherwise very different: they share no sequence similarity and form different types of intercellular junctions, namely heterotypic, Ca2+-dependent junctions for neuroligin in contrast to homotypic, Ca2+-independent junctions for SynCAM.
In the synapse formation assay (Scheiffele et al., 2000; Biederer et al., 2002), non-neuronal cells expressing NL1 or SynCAM are cocultured with neurons. This induces the formation of presynaptic specializations onto the non-neuronal cells. Coexpression of glutamate receptors with SynCAM (Biederer et al., 2002) or NL1 (Fu et al., 2003) in the non-neuronal cells revealed that the artificially induced terminals secrete glutamate. The synapse formation assay thus established that, despite their dissimilarities, both SynCAM and NL1 can act as postsynaptic cell adhesion molecules and induce a presynaptic signaling cascade. However, it is unclear how similar these molecules are in their synapse-inducing activity and how this activity relates to normal synapse formation between neurons. Is the assay specific? Does the assay reflect a physiological function of these molecules? To begin to address these questions, we directly compared the activities of overexpressed SynCAM and NL1 in human embryonic kidney 293 (HEK293) cells and in neurons and tested other putative neuronal cell adhesion molecules (NCAM-140, L1, and N-cadherin) in the same assay.
Materials and Methods
Cell culture. Dissociated hippocampal cultures were prepared from 1- to 2-d-old Sprague Dawley rats as described previously (Kavalali et al., 1999). For the overexpression of synaptic cell adhesion molecules (see Figs. 5, 6, 7), neurons were transfected after 6 d in vitro (DIV) using a calcium phosphate transfection protocol. Recordings were obtained at 10-11 DIV 4-5 d after transfections. Some cultures were transfected at 8 DIV, and recordings were obtained at 14 DIV. For optical imaging of presynaptic terminals and electrophysiological recordings in coculture assays, transfected HEK293 cells were seeded onto 8-d-old hippocampal cultures and cocultured in 1 μm cytosine arabinoside for 1-3 d before analysis, as described previously (Biederer et al., 2002).
Figure 5.
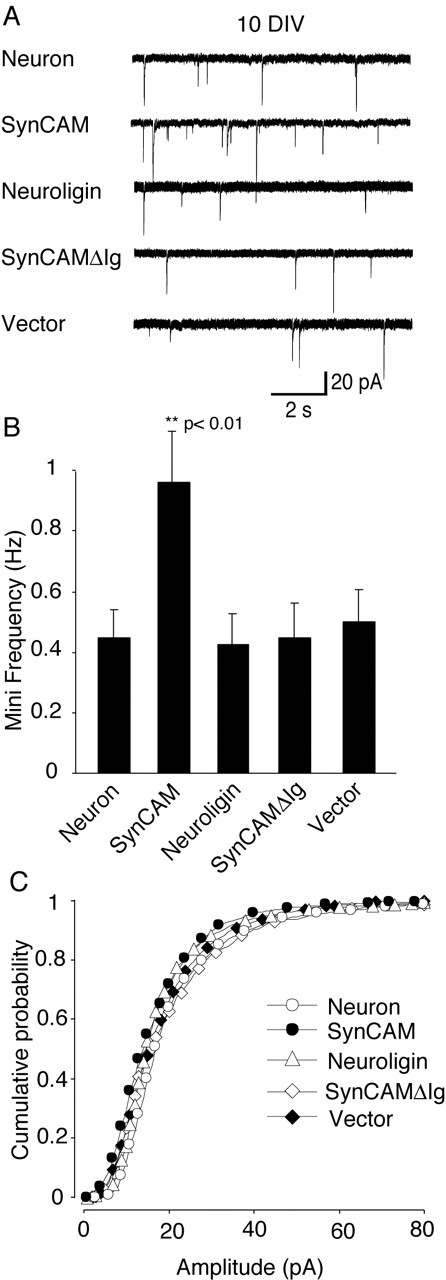
Overexpression of NL1 and SynCAM in hippocampal neurons. A, Representative recording traces from experiments from neurons without any previous treatment (control) and from the neurons transfected with SynCAM, NL1, SynCAMΔIg, or vector. B, SynCAM-overexpressing neurons showed an almost twofold higher spontaneous miniature frequency (n = 45; p < 0.01), whereas other cell adhesion molecules (NL1, n = 27; SynCAM Δ Ig, n = 27) yielded similar average frequencies with controls (n = 32) and vector alone (n = 37). C, Cumulative amplitude distributions were identical for all of the groups tested. All of the recordings were done in the presence of 1 μm TTX to isolate the spontaneous miniature events.
Figure 6.
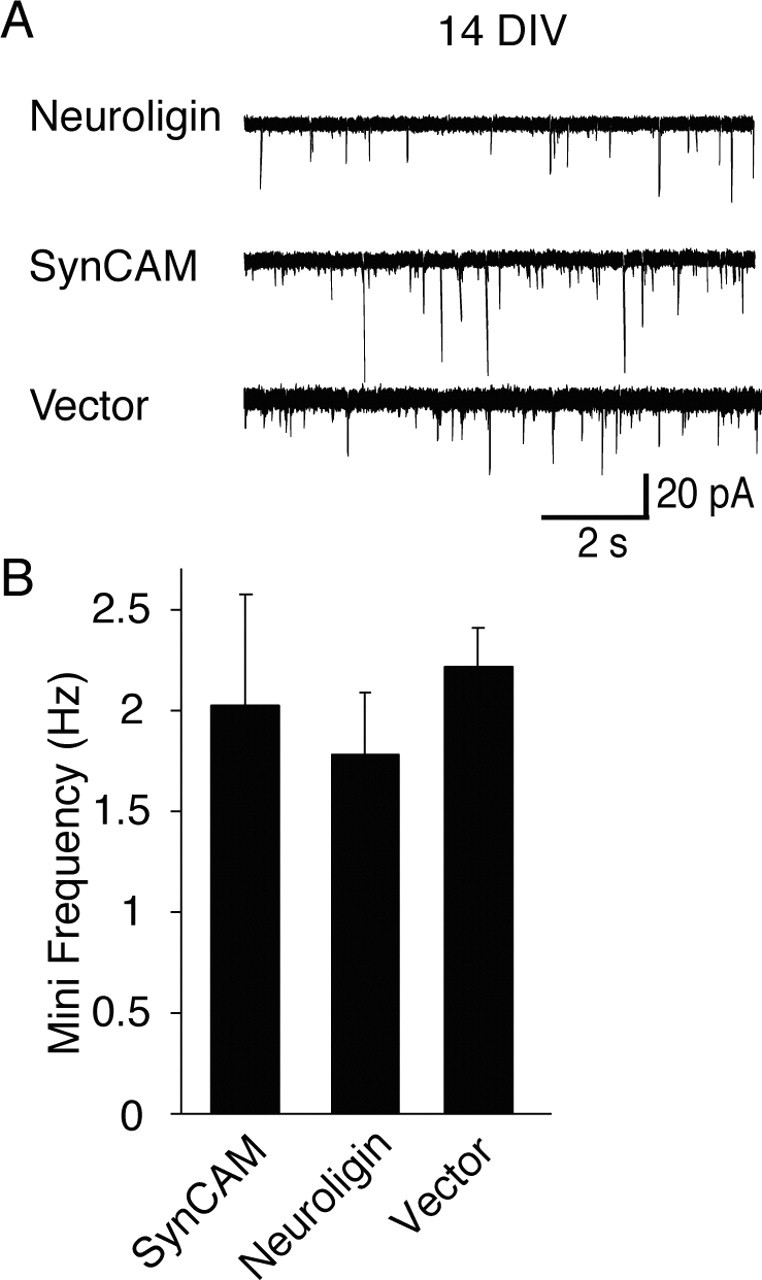
SynCAM-induced increase in mini frequency is limited to immature synapses. A, Representative recording traces (in the presence of 1 μm TTX) obtained from NL1, SynCAM, or expression vector (control) transfected hippocampal neurons. B, Spontaneous events detected on cells transfected with SynCAM and NL1 at 8 DIV did not show a significant difference in their frequencies when analyzed at 14 DIV (NL1, n = 16; SynCAM, n = 11; vector alone, n = 13).
Figure 7.
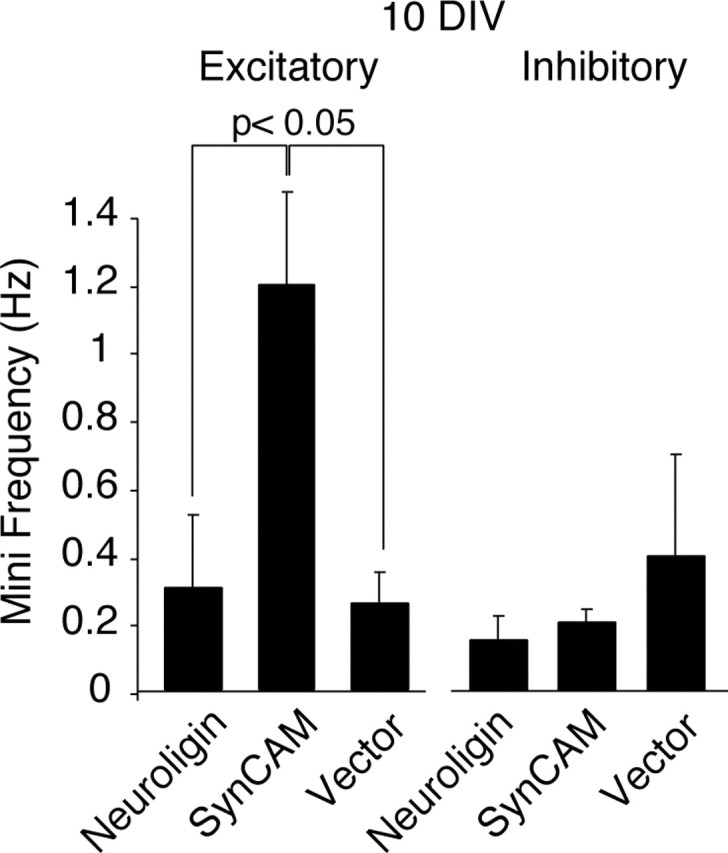
SynCAM-induced increase in mini frequency is specific to excitatory synapses. Bar graphs depict the mean frequencies of spontaneous miniature synaptic events recorded in the presence of TTX. Excitatory events (left) were isolated by the addition of 50 μm picrotoxin to the recording medium. Inhibitory events (right) were recoded after the addition of 10 μm CNQX (NL1, n = 3; SynCAM, n = 7; vector alone, n = 6).
Fluorescence imaging. Synaptic boutons were loaded with FM5-95 (16 μm; Molecular Probes, Eugene, OR) for 90 sec using 47 mm hyperkalemic stimulation. Modified Tyrode's solution used in all of the experiments contained the following (in mm): 150 NaCl, 4 KCl, 2 CaCl2, 2 MgCl2,10 glucose, and 10 HEPES-NaOH, pH 7.4 (310 mOsm). The hyperkalemic solution contained an equimolar substitution of KCl for NaCl. All of the staining and washing protocols were performed with 10 μm CNQX and 50 μm AP-5 to prevent recurrent activity. Images were obtained by a cooled intensified digital CCD camera (Roper Scientific, Trenton, NJ) during illumination (1 Hz, 15 msec) via an optical switch (Sutter Instruments, Novato, CA) controlled using Metafluor software (Universal Imaging, Downingtown, PA). To identify transfected cells, cultures were illuminated at 480 ± 20 nm [505 dichroic long pass (DCLP); 535 ± 25 nm bandpass (BP)] through a Nikon (Tokyo, Japan) 40× 1.3 numerical aperture oil-immersion objective. To image FM5-95-labeled puncta, we used excitation at 560 ± 27 nm (595 DCLP; 645 ± 37 nm BP). All of the statistical comparisons were performed with the two-tailed unpaired t test; values are given as means ± SEM.
Electrophysiology. For neuronal recordings, cultures were superfused in a recording chamber with extracellular solution containing the following (in mm): 150 NaCl, 4 KCl, 4 MgCl2, 10 glucose, 10 HEPES, and 4 CaCl2, pH 7.4 (310 mOsm at room temperature). To detect spontaneous neurotransmitter release, 1 μm tetrodotoxin (TTX) (Sankyo, Tokyo, Japan) was added to suppress action potential firing. Pyramidal neurons were whole-cell voltage clamped to -70 mV by using pipettes filled with the following (in mm): 115 Cs-MeSO3, 10 CsCl, 5 NaCl, 10 HEPES-NaOH, pH 7.38, 0.6 EGTA, 20 TEA-Cl, 4 Mg-ATP, 0.3 Na2GTP, and 10 QX-314 (lidocaine N-ethyl bromide) (295 mOsm; Sigma, St. Louis, MO). For HEK293 cell recordings, a patch pipette internal solution was used, containing the following (in mm): 140 CsCl, 10 HEPES, 0.6 EGTA, and 2 Mg-ATP, pH 7.38 (295 mOsm).
Vector construction and protein expression. The full-length eukaryotic expression vectors encoding either SynCAM or NL1 and soluble ECFP (enhanced cyan fluorescent protein) coexpressed from an internal ribosomal entry site (IRES) sequence, as well as the pCMV5 (cytomegalovirus) mammalian expression vector encoding SynCAM with an SalI site introduced at bp 1123, were described previously by Biederer et al. (2002). GFP-GluR2 (green fluorescent protein-glutamate receptor subunit 2) in the pTet7 vector was a gift from R. Malenka (Stanford University, Stanford, CA). For construction of the vector coexpressing N-cadherin and soluble ECFP (pCMV N-cadherin-IRES-ECFP), fulllength mouse N-cadherin was PCR amplified using the oligos TC-CCCCGGGATGTGCCGGATAGCGG and CCTGAATTCTCAGTCGT-CACCACCGC from the pBAT-MNC (p-β actin thymidine kinase murine N-cadherin) vector, a gift from M. Takeichi (RIKEN Center for Developmental Biology, Kobe, Japan), the PCR product was subcloned into the pTOPO vector (Invitrogen, Carlsbad, CA), and the insert was subcloned via SmaI-EcoRI into pIRES-ECFP (Biederer et al., 2002). The expression vector coexpressing NCAM-140 and soluble ECFP (pCMV NCAM-140 -IRES-ECFP) was constructed after excision of the insert encoding full-length NCAM-140 from pcDNA NCAM-140 (without variable alternative spliced exon), a gift from P. Maness (University of North Carolina, Chapel Hill, NC), using the HindIII-EcoRV sites and subcloning of the insert into pIRES-ECFP. For construction of the vector coexpressing L1 and soluble ECFP (pCMV hL1-IRES-ECFP), the insert encoding full-length human L1 was excised from phL1, a gift from V. Lemmon (University of Miami, Miami, FL), using the SalI-EcoRI sites with the SalI site being filled in, and the insert was subcloned into the SmaI-EcoRI sites of pIRES-ECFP. Control cells were transfected with pIRES-ECFP alone. HEK293 cells were transfected using FuGene 6 (Roche, Basel, Switzerland) according to the instructions of the manufacturer.
To generate the cytosolic tail-swap mutants, the construct pCMV mSynCAM*SpeI-IRES-ECFP was generated via introduction of an SpeI site at bp 1196, and the construct pCMV NL1*SpeI-IRES-ECFP was generated via introduction of an SpeI site at bp 2149 by PCR mutagenesis using the QuikChange mutagenesis kit (Stratagene, La Jolla, CA). The SpeI-SalI fragment was excised from pCMV mSynCAM*SpeI-IRES-ECFP and subcloned into the respective sites of pCMV NL1*SpeI-IRES-ECFP to generate pCMV NL1-cytoplasmic tail (C-tail) SynCAM1-IRES-ECFP. The vector pCMV mSynCAM1-C-tail NL-IRES-ECFP was generated analogously by excising the SpeI-SalI fragment from pCMV NL1*SpeI-IRES-ECFP and subcloning it into pCMV mSynCAM*SpeI-IRES-ECFP. Constructs were confirmed by sequencing, and expression was confirmed by transfection of these vectors into HEK293 cells, using FuGene 6 (Roche), followed by immunoblotting.
Immunocytochemistry and structural analysis. For structural analysis, hippocampal neurons were either transfected with NL1-EGFP (or EGFP alone as control) or cotransfected with EGFP-actin and NL1 or SynCAM constructs at 8 DIV. Cells were fixed and immunostained with rabbit polyclonal antibodies against synapsin at 10 or 15 DIV. The coverslips were then mounted onto frosted uncharged slides. Images were obtained with a Leica (Nussloch, Germany) TCS confocal microscope, and the data were analyzed with the Leica confocal software. The same confocal acquisition settings were applied to all samples of the experiment. Collected z-section images were converted to maximal projection images and analyzed blindly using the NIH Image and ImageJ programs (National Institutes of Health, Bethesda, MD). Images of EGFP-positive neurons collected with the 63× objective, with different channels corresponding to EGFP and synapsin signals, were thresholded to outline spines and presynaptic terminals correspondingly. Subsequently, the length of the analyzed region of a particular dendrite was measured. Spines and synapses were detected using the “analyze particle” module of the ImageJ program. Area size and fluorescent intensity of each spine or presynaptic terminal and number of particles per 50 μm of a dendrite were measured automatically. In each experiment, between 300 and 1000 spines from 8-12 neurons were analyzed per condition. Statistical significance was determined by Student's t test. All of the data shown are mean ± SEM. We thank Y. Goda (University College, London, UK) for kindly providing the pPDGF-EYFP (enhanced yellow fluorescent protein)-bactin construct. pCMV5-NL1-EGFP construct was made using PCR. The DNA sequence encoding EGFP was inserted inside the C-terminal part of NL1 after T776 and was followed by the rest of NL1 sequence.
Results
Specificity of synapse induction by SynCAM and neuroligin 1
We first compared the activity of NL1 and SynCAM in inducing artificial synapses with each other and with the activity of three other neuronal cell adhesion molecules, N-cadherin, NCAM-140, and L1 (Inoue and Sanes, 1997; Bliss et al., 2000; Bozdagi et al., 2000; Rafuse et al., 2000; Polo-Parada et al., 2001, 2004; Demyanenko and Maness, 2003). We transfected HEK293 cells separately with these cell adhesion molecules, seeded the transfected cells onto 8-d-old dissociated hippocampal cultures, and cocultured the cells for 1-3 d in the presence of cytosine arabinoside to prevent HEK293 cell overgrowth. Transfected HEK293 cells robustly expressed all constructs, as detected by Western blotting (Fig. 1A). Furthermore, the relative expression levels of all constructs (SynCAM, NL1, N-cadherin, NCAM-140, and L1) were comparable, because the fluorescence signal originating from ECFP coexpression was virtually the same. This is expected, because all constructs were expressed from the same promoter.
Figure 1.
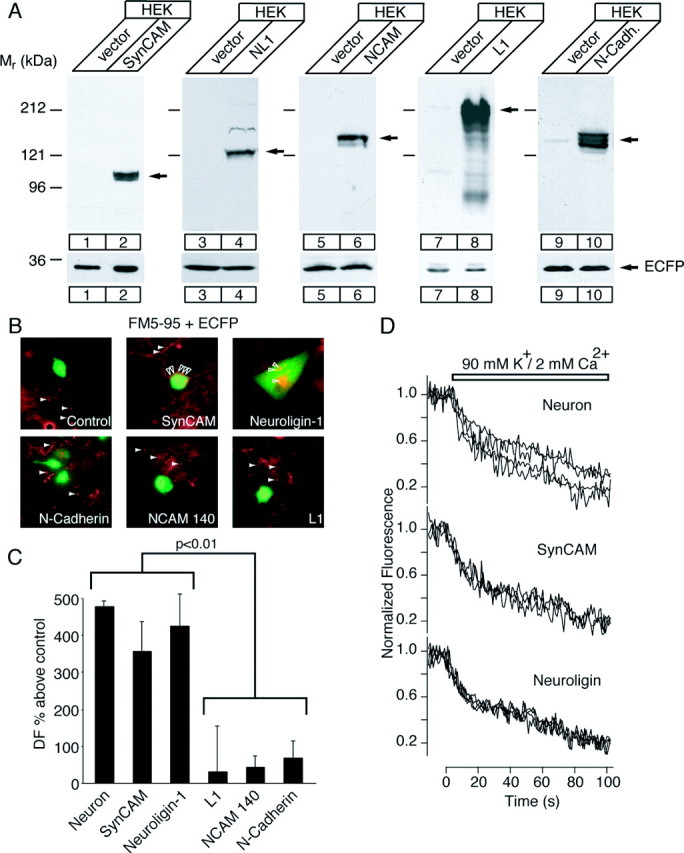
Analysis of synapse formation on HEK293 cells expressing neuronal adhesion molecules. A, Western blots depicting similar expression of cell adhesion molecules SynCAM, NL1, N-CAM, L1, and N-cadherin (N-Cadh.) in transfected HEK293 cells. Note that the molecular weight of SynCAM in heterologous expression is larger than brain SynCAM. This is attributable to differences in glycosylation (Biederer et al., 2002). Vector control denotes the pCMV-IRES-ECFP vector expressing ECFP. Bottom lanes, ECFP expression from each construct and equal loading of HEK293 cell lysate in the lanes containing preparations from either control or adhesion molecule-transfected cells. Arrows, Detected bands of the protein indicated at the top of each blot. B, FM5-95 staining of active nerve terminals formed on HEK293 cells that express the indicated neuronal adhesion molecules together with ECFP after coculture with hippocampal neurons. Fluorescence pictures derived by subtracting the FM5-95 images before and after high K+ stimulation to selectively visualize active nerve terminals (red, FM5-95 signal; green, ECFP signal; open and filled arrowheads indicate active terminals on or apart from transfected cells, respectively). Note that the relative expression levels of all constructs were comparable because the fluorescence signals originating from ECFP coexpression were virtually the same. C, Bars depict the quantification of the extent of fluorescence retention on HEK293 cells transfected with SynCAM, NL1, L1, NCAM-140, and N-cadherin (NL1, n = 10; SynCAM, n = 4; N-cadherin, n = 6; NCAM-140, n = 5; L1, n = 4). DF, Difference in fluorescence. These values are compared with fluorescence retention in interneuronal synapses present in the same culture. To reliably compare fluorescence values from multiple experiments, they are normalized with respect to background fluorescence detected on cells transfected with vector alone in the same culture (background, 0%). D, Synaptic vesicle recycling in neuron-HEK293 cell synapses evaluated by FM5-95 dye staining. Example traces of FM5-95 destainings in neuron-neuron and SynCAM- or NL1-induced synapses. A 90 mm concentration of K+ was applied to destain the synapses completely. Synaptic terminals detected on HEK293 cells transfected with SynCAM or NL1 had destaining kinetics similar to interneuronal synapses.
We then measured synapse formation by imaging the activity-dependent uptake of the styryl dye FM5-95 into nerve terminals that are formed onto the transfected cells. Terminals were labeled with FM5-95 by depolarization with 47 mm K+ solution for 90 sec. This strong stimulation ensured maximal labeling of synapses between neurons and of synapses formed onto transfected HEK293 cells. After labeling, the FM5-95 dye was washed out by superfusion with dye-free solution for 10-15 min, and FM5-95 that was specifically taken up into synaptic vesicles was released by stimulating neurons with a maximally depolarizing solution (90 mm K+ for 90 sec). We acquired fluorescence pictures before and after high K+ stimulation and subtracted the images from each other to selectively visualize spots of stimulus-dependent labeling that correspond to nerve terminals (Fig. 1B).
Quantification of the absolute fluorescence change observed over transfected HEK293 cells compared with transfected control HEK293 cells revealed that only HEK cells expressing NL1 (n = 10; 18 ± 2 puncta per cell) and SynCAM (n = 4; 39 ± 24 puncta per cell) showed strong FM5-95 labeling (Fig. 1C). HEK293 cells expressing the adhesion molecules N-cadherin (n = 6), NCAM-140 (n = 5), and L1 (n = 4) did not display significant FM5-95 labeling. The levels of FM5-95 labeling on N-cadherin-, NCAM-140-, and L1-expressing HEK293 cells were comparable with the levels seen on control cells.
To quantify the efficacy of synaptic vesicle turnover in synapses induced by SynCAM or NL1, we determined the magnitude of FM5-95 fluorescence trapped during strong high K+ stimulation (Fig. 1C). The characteristics of high K+-induced FM5-95 destaining traces from NL1- or SynCAM-induced synapses were similar to interneuronal synapses of the same age in vitro (Fig. 1D). Most traces displayed both fast and slow destaining kinetics, suggesting rapid vesicle mobilization typically seen at early stages of synapse maturation (Biederer et al., 2002; Mozhayeva et al., 2002; Mohrmann et al., 2003). Releasable FM5-95 dye fluorescence sequestered in synapses during massive high K+ stimulation can be taken as a measure of the size of the total recycling vesicle pool (Harata et al., 2001). Synapses on SynCAM- or NL1-transfected HEK293 cells had similar recycling pool sizes compared with the interneuronal synapses (Fig. 1C). In contrast, fluorescence values detected on N-cadherin-, NCAM-140-, or L1-expressing HEK293 cells were fourfold to fivefold lower in magnitude and were not significantly different from the background fluorescence detected on HEK293 cells transfected with ECFP alone. Figure 1C depicts the releasable fluorescence trapped in induced nerve terminals normalized to background fluorescence detected in HEK293 transfected with ECFP alone. Together, these results indicate that SynCAM and NL1 are similarly active in synapse formation, whereas three other putative synaptic cell adhesion molecules (N-cadherin, NCAM-140, and L1) are not.
Electrophysiological detection of evoked neurotransmitter release on HEK293 cells
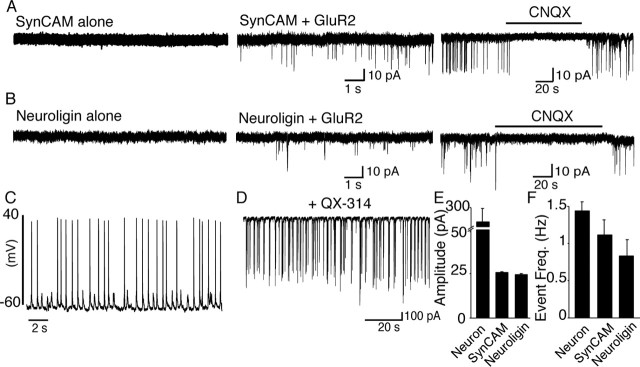
To investigate the properties of neurotransmitter release in artificial synapses induced by SynCAM or NL1, we cotransfected HEK293 cells with GFP-tagged GluR2 subunits and NL1 or SynCAM. We then performed coculture experiments as described above, followed by electrophysiological recordings. HEK293 cells expressing the glutamate receptor, SynCAM, or NL1 alone did not exhibit any electrical activity, as measured by whole-cell patch-clamp recordings (Fig. 2A,B and data not shown). In contrast, HEK293 cells coexpressing SynCAM or NL1 with the glutamate receptor displayed spontaneous electrical activity when cocultured with neurons. This activity reflected glutamate release from presynaptic neurons, because spontaneous currents were completely inhibited by the glutamate receptor antagonist CNQX (Fig. 2A,B).
Figure 2.
Reconstitution of glutamatergic transmission on HEK293 cells. The recordings obtained from the cocultures of neurons and HEK293 cells expressing GluR2 alone or with adhesion molecules SynCAM-NL1. A, B, Examples of whole-cell recordings from SynCAM- or NL1-expressing HEK293 cells exhibit absence of spontaneous electrical activity (left). Spontaneous activity was present in both SynCAM and NL1 coexpression with GluR2 (middle) and completely inhibited by CNQX, indicating that this activity was glutamatergic (right). C, Current-clamp recordings from neurons in cocultures displayed spontaneously firing neurons as a result of spontaneous network activity (1.3 ± 0.2 Hz; n = 6). D, Large synaptic activities observed in the neurons under whole-cell voltage clamp with electrodes filled with QX-314 to eliminate action potential firing (n = 6). E, Average amplitude was significantly larger in neurons than in the HEK293 cells (neurons, n = 6; SynCAM, n = 23; NL1, n = 17; p < 0.01). F, Spontaneous event frequency (Event Freq.) in neurons was in the same order as that of the HEK293 activity (neurons, n = 6; SynCAM, n = 23; NL1, n = 17; p > 0.05).
The robust spontaneous activity detected on HEK293 cells was too large to correspond to spontaneous miniature synaptic events (“minis”) released from nerve terminals but resembled action potential-evoked responses observed in regular interneuronal synapses. Consistent with this hypothesis, current-clamp recordings from neurons in the same culture with the HEK293 cells revealed abundant spontaneous action potential firing (1.3 ± 0.2 Hz; n = 6) (Fig. 2C). To ensure that these action potentials are generated by neuronal network activity and do not reflect spontaneous firing of unstable neurons that are possibly impaired, we recorded synaptic currents in neurons in the presence of intracellular QX-314 (Fig. 2D). QX-314 blocks Na+ channels internally and thus prevents action potential firing in the neuron. Large synaptic currents of a frequency similar to the action potential activity were observed in neurons containing QX-314 (Fig. 2, compare C, D). These currents were of sufficient strength to trigger action potentials, which in turn support the positive-feedback loop that drives the network and maintains the large spontaneous synaptic activity observed, indicating that synapses formed on both NL1- and SynCAM-expressing HEK293 cells provide a readout for spontaneous synaptic activity in the culture system used. Consistent with this conclusion, the spontaneous synaptic activity that we recorded in neurons and in transfected HEK293 cells in the coculture experiments was suppressed by application of 1 μm TTX, a potent Na+ channel blocker, and only spontaneous miniature activity remained after TTX application (see below).
Quantitatively, the properties of artificial synapses were very similar, independent of whether they were induced by SynCAM or NL1, but were different from those of neurons in magnitude but not in frequency. The synaptic amplitudes were ∼10-fold larger in neurons (258.6 ± 37 pA) than in either SynCAM-induced (26.6 ± 0.4 pA) or NL1-induced artificial synapses (24.9 ± 0.7 pA) (Fig. 2E). The frequencies of synaptic events, however, were similar for SynCAM- and NL1-induced synapses in HEK293 cells (SynCAM, 1.11 ± 0.2 Hz, n = 45; NL1, 0.83 ± 0.2 Hz, n = 27; p > 0.3) and for regular synapses in neurons (1.43 ± 0.1 Hz, n = 32) (Fig. 2F). A slightly larger frequency of spontaneous activity in neurons compared with HEK293 cells can be attributable to the fact that neuronal activity includes inhibitory events, whereas transfected HEK293 cells can only respond to excitatory inputs. Together, these data show that the synaptic events recorded from the HEK293 cells reflect evoked neurotransmitter release triggered by action potentials supported by spontaneous network activity, suggesting that artificially induced presynaptic terminals on the transfected cells are fully capable of such a similar release to regular synapses.
Spontaneous neurotransmitter release from the heterologous synapses
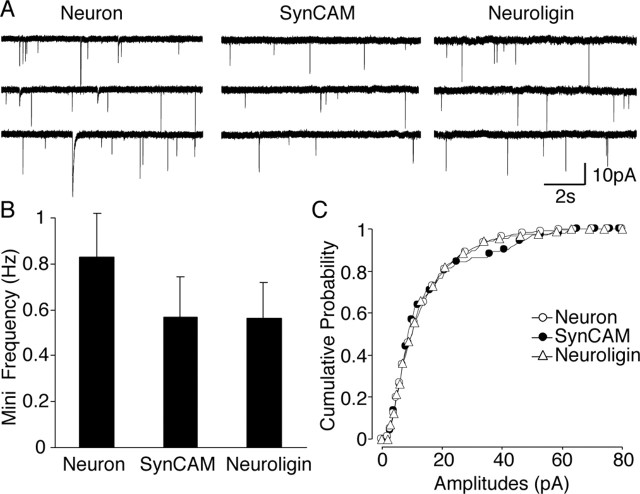
Subsequently, we examined in artificial synapses spontaneous miniature synaptic activity that remains after action potentials have been blocked with 1 μm TTX. Twenty percent of SynCAM- or NL1-expressing HEK293 cells with evoked electrical activity displayed spontaneous minis closely resembling neuronal miniature synaptic currents (Fig. 3A). The mean frequency of spontaneous minis in HEK293 cells expressing NL1 (0.57 ± 0.17 Hz; n = 5) or SynCAM (0.56 ± 0.16 Hz; n = 3) were similar to each other and to the frequency detected on neurons in the same culture (0.83 ± 0.20 Hz; n = 11) (Fig. 3B). Moreover, the amplitude distributions of miniature events from SynCAM- or NL1-induced synapses and interneuronal synapses revealed no significant difference (Fig. 3C), and the rise and decay times of individual synaptic currents from all of the groups were indistinguishable (data not shown).
Figure 3.
A subset of heterologous synapses displayed spontaneous miniature activity. Whole-cell patch-clamp recordings from HEK293 cells revealed spontaneous miniature events in the presence of TTX. A, Example traces of miniature activity obtained from neurons and heterologous synapses induced by SynCAM or NL1. B, Event frequencies of neuron-HEK293 synapses were comparable with the neuronal counterparts (n = 11). C, Cumulative amplitude histograms also overlapped with each other, showing that these heterologous synapses have similar quantal sizes (neurons, n = 11; SynCAM, n = 3; NL1, n = 5).
Miniature spontaneous currents were absent from 80% of the HEK293 cells with evoked activity. Several factors may contribute to this difference. For instance, miniature events in the remaining cells may have been masked by noise (<4 pA), or insufficient clustering of glutamate receptors may have increased the detection threshold for quantal events with low concentrations of glutamate present in the synaptic cleft. Therefore, during these recordings, we may have inadvertently selected for heterologous synapses with higher synaptic efficacy. This premise can explain why HEK293 cells with miniature spontaneous activity had a frequency comparable with neurons despite the fewer numbers of synapse present on their surface.
Heterologous synapses respond to hypertonic sucrose application
To determine whether synapses induced by cell adhesion molecules possess a set of readily releasable vesicles, we tested the effectiveness of hypertonic sucrose to stimulate exocytosis. Rapid hyperosmotic stimulation mobilizes vesicles in the readily releasable pool (Rosenmund and Stevens, 1996). In neuronal and artificial synapses, hypertonic sucrose produced the same response pattern, which is characterized by an initial fast peak followed by a lower but sustained release phase (Fig. 4A). Hypertonic sucrose was applied in the presence of TTX to monitor responses that are not contaminated by concurrent spontaneous synaptic activity. Interestingly, two of five cells in the SynCAM group and one of five cells in the NL1 group were electrically silent after TTX application (no miniature events) but responded to hypertonicity with bursting activity, whereas neurons always displayed miniature activity after TTX perfusion. Furthermore, the amplitude of sucrose responses in artificial synapses was 6% of that of interneuronal synapses (SynCAM, 73.6 ± 38.6 pA, n = 5; NL1, 119.8 ± 60.3 pA, n = 5 vs neurons, 1545.8 ± 437.0 pA, n = 6) (Fig. 4B). This difference is similar to the difference in the size of action potential-evoked responses (Fig. 2) and may be attributable to a lower number of artificial synapses on HEK293 cells than of regular synapses on neurons or to functional differences between artificial and interneuronal synapses.
Figure 4.
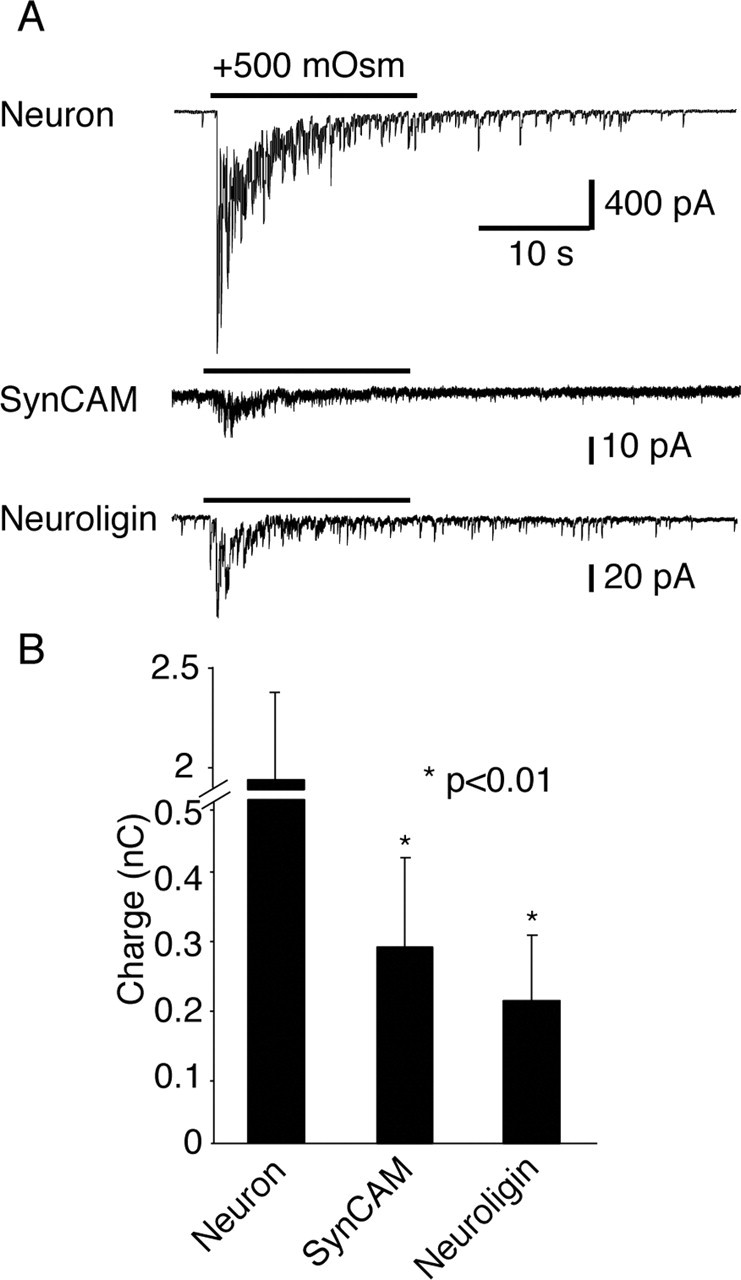
Hypertonicity-induced neurotransmitter release from the heterologous synapses. A, Representative whole-cell patch-clamp recordings showing hypertonic sucrose-induced vesicular release manifested by a fast peak and a lower plateau phase. During these recordings, 1 μm TTX was present throughout the experiments. B, Total charge transfer achieved during sucrose perfusion was significantly higher in neurons (n = 5) with respect to SynCAM (n = 5) or NL1 (n = 5) responses (neuron vs NL1, p = 0.008; neuron vs SynCAM, p = 0.008).
The impact of NL1 and SynCAM expression in hippocampal neurons
The experiments so far show that non-neuronal HEK293 cells expressing NL1 or SynCAM, when cocultured with neurons, induce the formation of functional presynaptic terminals that have indistinguishable physiological properties. To test whether the similar activity of SynCAM and NL1 in artificial synapse formation reflects a comparable function of these proteins in neuronal synaptogenesis, we examined the effects of NL1 and SynCAM on synapse formation in cultured hippocampal neurons, using electrophysiological recordings.
We first probed the effect of NL1 and SynCAM on minis. Minis recorded in the presence of TTX are thought to reflect the spontaneous release of transmitter quanta from presynaptic terminals on the recorded neuron. We transfected hippocampal neurons with various expression vectors at 6 d in vitro and recorded spontaneous event frequencies at 10 d in vitro. Consistent with previous results (Biederer et al., 2002), we found that SynCAM overexpression in neurons (n = 45) at 10 d in vitro caused an almost twofold increase in the frequency of spontaneous minis. In contrast, NL1 overexpression had no effect on mini frequency (n = 27). The specificity of the dominant-positive action of SynCAM was attested by the inactivity of a SynCAM mutant (SynCAMΔIg) that lacks the Ig domains and is unable to undergo extracellular homophilic interactions. ECFP was coexpressed as a reporter of transfection in all of the experiments, and ECFP alone also had no effect (p < 0.01 compared with SynCAM; n = 37) (Fig. 5A,B). Furthermore, the amplitudes of minis were identical in all of the groups (Fig. 5C), indicating that it is unlikely that higher frequency in the SynCAM group can be a result of an increased postsynaptic sensitivity that improves the signal-to-noise ratio and in turn increases the number of events detected.
Subsequently, we examined whether the developmental stage of synapses plays a role in the SynCAM-induced increase in spontaneous minis. We transfected hippocampal neurons with SynCAM, NL1, or the ECFP alone at 8 d in vitro and recorded spontaneous event frequencies at 14 d in vitro. At this time point, the mini frequency in control neurons was five times higher than at the earlier time point measured above, and no difference among control neurons (n = 13), SynCAM-expressing neurons (n = 11), and NL1-expressing neurons (n = 16) was apparent (Fig. 6A,B). Because previous studies showed that, in the culture system used here, mature cultures have a higher number and density of synapses (Kavalali et al., 1999; Mozhayeva et al., 2002; Mohrmann et al., 2003), the lack of a SynCAM effect at 14 d in vitro may be a result of the limited dynamic range available for additional increases in spontaneous event frequency at this developmental stage (Fig. 6A,B).
SynCAM specifically promotes excitatory synaptic function
Does SynCAM uniformly promote synaptic function during synaptogenesis, or is this effect selective? As an initial test of this question, we tested whether SynCAM-induced increase in spontaneous event frequency was selectively mediated by a change in excitatory or inhibitory events. When we examined excitatory transmission in isolation by application of picrotoxin to block inhibitory events, we observed an approximately fourfold increase in event frequency in SynCAM-overexpressing cells (Fig. 7). In contrast, isolated inhibitory events measured in the same cells after application of CNQX and washing out of picrotoxin displayed no significant change.
The dominant-positive effect of SynCAM is mediated by its cytoplasmic tail
The differential effects of SynCAM versus NL1 on mini frequency in transfected neurons (Figs. 5, 7) suggest that these two molecules perform distinct functions in neurons, different from their similar activities in the artificial synapse formation assay (Figs. 1, 2, 3, 4). To dissect the molecular determinants of the dominant-positive effect by SynCAM (extracellular cell adhesion versus intracellular signaling), we generated chimeric constructs in which the cytoplasmic tails of NL1 and SynCAM are exchanged (Fig. 8A). We found that overexpression of the chimera containing the NL1 extracellular domain with SynCAM cytoplasmic tail in-creased mini frequency similar to SynCAM, whereas overexpression of the converse chimera (extracellular sequences of SynCAM with NL1 cytoplasmic tail) had no effect on mini frequency (SynCAM vs NL1, p < 0.001; NL1-SynCAM tail vs SynCAM-NL1 tail, p < 0.01) (Fig. 8B,C). The amplitudes of individual miniature events again were unaffected by the expression of any of these constructs (Fig. 8D). These data indicate that the specific postsynaptic cytoplasmic interactions mediated by the SynCAM tail are essential for an increase in presynaptic mini frequency on the neurons expressing SynCAM.
Figure 8.
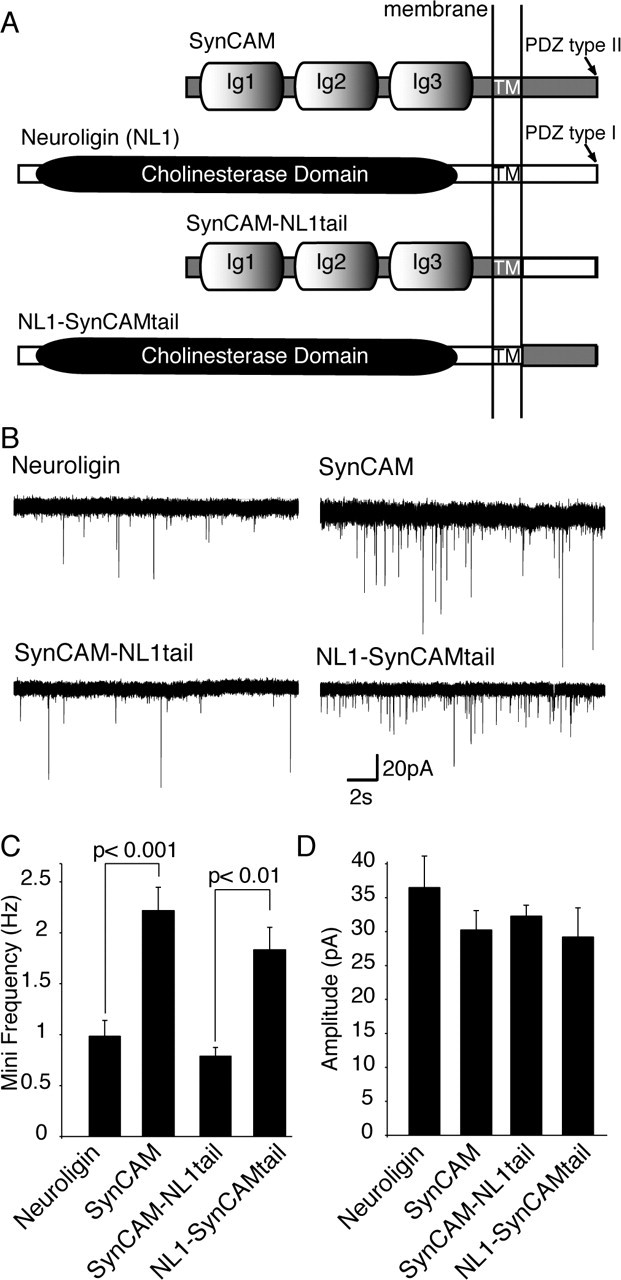
SynCAM-induced increase in mini frequency requires SynCAM C-tail. A, Schematic drawings of SynCAM, NL1, and the SynCAM-NL1 chimeric constructs used to assess the role of SynCAM cytoplasmic tail in the increase in mini frequency induced by SynCAM. B, Representative traces of spontaneous miniature synaptic events recorded from cells transfected with NL1 (n = 9), SynCAM(n = 7), SynCAM-NL1 tail (n = 6), or NL1-SynCAM tail (n = 6). C, Bar graphs depict the mean frequencies of spontaneous excitatory events recorded in the presence of TTX. Excitatory events were isolated by the addition of 50 μm picrotoxin to the recording medium. C, Amplitudes of spontaneous excitatory events do not show a significant difference.
In a final set of experiments, we tested whether the effect of SynCAM on mini frequency reflects an overall augmentation of synaptic inputs on the transfected neurons or represents an isolated change in the mini frequency only. The latter possibility was raised by the observation that, in artificial synapses, the effect of SynCAM on mini frequency is relatively larger than its effect on overall synaptic parameters, as measured by the amplitude of evoked release (Figs. 2, 3, 4). Therefore, we examined synaptic responses evoked by hypertonic sucrose application in neurons transfected with SynCAM, NL1, or the two SynCAM-NL1 chimeras (Fig. 9). We observed again a specific enhancement of synaptic responses by SynCAM and by the NL1-SynCAM chimera containing the SynCAM cytoplasmic tail (SynCAM vs NL1, p < 0.001; NL1-SynCAM tail vs SynCAM-NL1 tail, p < 0.02; NL1, n = 9; SynCAM, n = 6; SynCAM-NL1 tail, n = 9; or NL1-SynCAM tail, n = 7). Together, these results indicate that the facilitatory effect of SynCAM on miniature excitatory currents and synaptic responses evoked by hypertonic sucrose application is attributable to the distinct interactions of the cytoplasmic tail of SynCAM.
Figure 9.

SynCAM-induced increase in responses to hypertonic sucrose application requires SynCAM C-tail. A, Synaptic responses evoked by hypertonic sucrose application (+500 mOsm). B, Expression of SynCAM and NL1-SynCAM tail chimera caused a larger response to hypertonic sucrose application compared with expression of NL1 or SynCAM-NL1 tail chimera (SynCAM vs NL1, p < 0.001; NL1-SynCAM tail vs SynCAM-NL1 tail chimera, p < 0.02; NL1, n = 9; SynCAM, n = 6; SynCAM-NL1 tail, n = 9; or NL1-SynCAM tail, n = 7).
Morphological analysis of synaptogenesis after overexpression of NL1 and SynCAM in hippocampal neurons
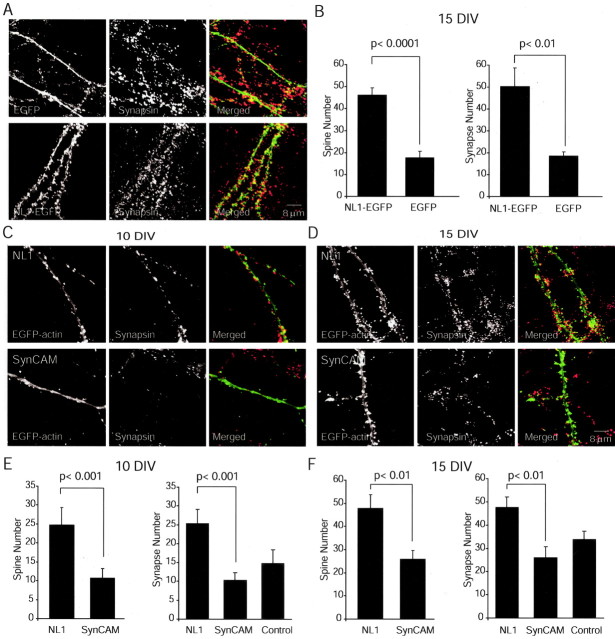
The following sets of experiments were designed to identify the morphological counterparts to our electrophysiological observations. First, we transfected hippocampal cultures with the NL1-EGFP construct to visualize NL1 expression and localization. In NL1-EGFP-transfected neurons, fluorescence labeling was localized to dendrites and spines, suggesting proper expression and targeting of NL1 (Fig. 10A). To visualize presynaptic terminals, we fixed and immunostained cells with an antibody against the synaptic vesicle protein synapsin. Compared with neurons expressing EGFP alone, NL1 overexpression caused more than a twofold increase in the number of spines and synapses detected per 50 μm dendritic length (NL1-EGFP vs EGFP alone, p < 0.0001 for synapses, p < 0.01 for synapses, n = 10 dendrites) (Fig. 10B). This finding is in agreement with recent observations by Dean et al. (2003).
Figure 10.
Overexpression of NL1, but not SynCAM, increases spine and synapse density. A, Hippocampal cultures transfected with NL1-EGFP (or EGFP alone as control) construct to visualize NL1 expression and localization. In NL1-EGFP-transfected neurons, fluorescence labeling was localized to dendrites and spines, suggesting proper expression and targeting of NL1. To visualize presynaptic terminals, cells were immunostained with an antibody against the synaptic vesicle protein synapsin. B, Compared with neurons expressing EGFP alone, NL1 overexpression caused more than a twofold increase in the number of spines and synapses detected per 50 μm dendritic length. C, D, Primary hippocampal neurons were cotransfected with EGFP-actin and NL1 or SynCAM. Cells were fixed and immunostained with antibodies against synapsin at 10 DIV (C) and 15 DIV (D). Overexpression of NL1 resulted in a twofold to threefold increase in spine and synapse number. Scale bar applies to all of the images. E, F, Quantitation of synapse formation in cultured hippocampal neurons overexpressing NL1 and SynCAM constructs. Quantitation of spines and synapse number was performed blindly using the ImageJ program. Control refers to synapsin-positive puncta counted on untransfected cells in the same culture [in this case, dendrites were visualized with MAP2 (microtubule-associated protein 2) staining].
Subsequently, we compared this synaptogenic effect of NL1 expression with that of SynCAM by transfecting hippocampal cultures with SynCAM or NL1 together with EGFP-actin to visualize dendrites and spines (Fig. 10C,D). To identify presynaptic terminals, we again stained fixed cells with the synapsin antibody. Interestingly, morphological analysis of neurons overexpressing SynCAM or NL1 showed the opposite of the predictions from electrophysiological results. When transfected at 6 DIV and analyzed at 10 DIV, NL1 increased spine number and synapse number compared with SynCAM, suggesting a role for NL1 in morphological synapse induction [NL1 vs SynCAM, p < 0.001 for synapses and spines, n = 10 dendrites (per 50 μm dendritic length)] (Fig. 10C,E). We also observed the same trend in neurons transfected at 8 DIV and analyzed at 15 DIV. However, in these mature cultures, the baseline spine and synapse density was high (∼30 per 50 μm dendrite), and the increases induced by the NL1 construct were less significant (p < 0.01) (Fig. 10 D, F). These results suggest that NL1 has a distinct ability to recruit new synapses and trigger the formation of associated spines, although these new synapses seem to be silent with the measures we used in this study. In contrast, SynCAM overexpression cannot induce morphological changes despite its functional effect on synaptic transmission. Therefore, the two molecules may play complementary roles in ensuring structural assembly of synapses versus establishment of proper functional glutamatergic neurotransmission.
Discussion
Our data show that, when expressed in non-neuronal cells, SynCAM and NL1 are similarly effective in seducing cocultured neurons to form artificial synapses onto non-neuronal cells. This action of SynCAM and NL1 was specific: N-cadherin, N-CAM, and L1 did not mediate synapse formation (Fig. 1). Our results are consistent with the notion that cadherins are involved in establishing synapse specificity by strengthening the initial contacts between neurons that are destined to become synaptically connected but do not actually participate in the real synaptic junction (Fannon and Colman, 1996; Benson and Tanaka, 1998; Miskevich et al., 1998; Sanes and Yamagata, 1999; Zhu and Luo, 2004). This conclusion also agrees with the localization of cadherins outside of synapses (Uchida et al., 1996). Similarly, N-CAM and L1 are prominent neuronal cell adhesion molecules that affect synaptic function (Bliss et al., 2000; Rafuse et al., 2000; Polo-Parada et al., 2001, 2004; Demyanenko and Maness, 2003) but are probably not obligatory components of synapses. In summary, these molecules may need certain cofactors to induce synapses in this assay, or, alternatively, they may act at different stages of synapse maturation rather than during initial synapse assembly.
When we coexpressed glutamate receptors with SynCAM or NL1 in the non-neuronal cells, we found that the induced “artificial” synapses were surprisingly similar to those formed between neurons in the same cultures: both action potential- and sucrose-induced release were observed (Figs. 2, 4), spontaneous minis with properties identical to those of neurons were detected (Fig. 3), and the size of the nerve terminal vesicle pools was found to be similar (Fig. 1). Overall, these results together with previous studies (Scheiffele et al., 2000; Biederer et al., 2002; Dean et al., 2003; Fu et al., 2003) demonstrate that SynCAM and NL1 can act as postsynaptic cell adhesion molecules that transsynaptically induce a presynaptic neuron to differentiate a nerve terminal. These artificially induced nerve terminals are comparable with nerve terminals present in regular interneuronal synapses. It is unexpected that two distinct molecules, SynCAM or NL1, are each sufficient to induce such differentiation. Although these molecules are very different, they nevertheless seem to trigger the same complex signaling cascade that orchestrates presynaptic differentiation. These results attract attention to intracellular interactions of SynCAM and β-neurexins, presynaptic partners of neuroligins, because these molecules seem to have a unique capability to drive synapse formation.
Among the various properties of the artificial SynCAM- or NL1-induced synapses that we analyzed, the characteristics of spontaneous minis may be the most interesting. In those HEK293 cells in which spontaneous minis could be measured, their properties were surprisingly “normal” when compared with the minis in regular neurons. The amplitude and shape of minis presumably depends on the size and neurotransmitter content of presynaptic vesicles, on the width of the synaptic cleft, and on the composition and properties of postsynaptic receptors. Therefore, the similarity in the properties of minis suggests that the synaptic vesicle content and the width of the synaptic cleft are identical for regular and artificial synapses. However, this similarity does not extend to postsynaptic glutamate receptors, which are expressed in various subunit combinations in neurons, but which are present in HEK293 cells only as a single transfected receptor type. Moreover, the fact that the mini frequency is similar between artificial and regular synapses despite the fact that evoked release, either during spontaneous action potential network activity or during hypertonic sucrose application, is ∼10 times lower in artificial than in regular synapses neurons suggests that the presynaptic nerve terminals of the artificial synapses, although similar to “regular” terminals, are not identical to such terminals. The cells that did not exhibit miniature synaptic currents may have a high detection threshold for quantal events resulting from the low detection efficacy of GluR2 receptors or differences in the architecture of the synaptic cleft. For instance, similar experiments performed with NMDA receptors as higher-affinity glutamate sensors may resolve this apparent discrepancy (Fu et al., 2003).
The fact that the actions of SynCAM and NL1 in artificial synapse formation are indistinguishable is puzzling given their molecular differences. To test whether these two molecules have a similar physiological function, we examined neurons that overexpress SynCAM or NL1. We found that SynCAM caused a selective twofold increase in overall mini frequency that depended on the developmental stage of the culture, whereas NL1 did not cause a change (Figs. 5, 6). The effect of SynCAM did not reflect a general synapse-promoting activity of SynCAM but was restricted to excitatory synapses in which we measured an approximately fourfold increase in mini frequency (Fig. 7). Unexpectedly, the selective action of SynCAM depended on its cytoplasmic tail: attaching the SynCAM cytoplasmic tail to NL1 conferred onto NL1 the same activity (Fig. 8). The dominant-positive synaptic effect of SynCAM was not restricted to mini frequency but was also reflected in an increase of release evoked by hypertonic sucrose (Fig. 9). Here, we note that these effects were limited to immature neurons.
Interestingly, morphological analysis of neurons overexpressing SynCAM or NL1 showed the opposite of the predictions from electrophysiological results. In this case, NL1 increased synapse number and spine density, suggesting a specific role for NL1 in morphological synapse induction. This apparent contradiction between the two sets of results may suggest that SynCAM overexpression increases synaptic efficacy by increasing the vesicle pool size of previously existing synapses (as evidenced by the increase of hypertonic sucrose responses). In contrast, NL1 overexpression leads to de novo synapse and spine formation without adequate recruitment of AMPA receptors in the postsynaptic site or proper assembly of presynaptic secretory apparatus. Together, these results suggest that, in contrast to the minimal requirements for functional synapse assembly on HEK293 cells, in neurons, proper synaptogenesis requires the synergistic action of two or more cell adhesion molecules, each ensuring adequate formation of distinct aspects of synaptic junctions.
Together, our findings may have several important implications. (1) The artificial synapse formation assay is a valuable tool to test the candidacy of postsynaptic cell adhesion molecules and to probe mechanisms of presynaptic differentiation but may not reflect a physiological function of a protein in synaptogenesis because, in this assay, SynCAM and NL1 are identical, whereas in transfected neurons, they have very different effects. (2) SynCAM differentially changes the activity of excitatory versus inhibitory synapses, suggesting that, as a transsynaptic cell adhesion molecule, SynCAM discriminates between different types of synapses. (3) The effect of SynCAM in enhancing presynaptic activity involves an unidentified postsynaptic signal that depends on the cytoplasmic tail of SynCAM. (4) The effect of SynCAM seems to be purely functional (presumably of presynaptic origin, suggesting retrograde signaling by the cytoplasmic tail) because SynCAM overexpression does not cause a significant increase in synapse or spine numbers when compared with NL1. (5) NL1 is particularly effective in promoting synaptogenesis and spine morphogenesis when overexpressed in cultured neurons. However, this structural effect does not translate into an augmentation of synaptic transmission when assayed in immature developing neurons.
The present experiments only begin to address a long list of complex questions on the role of synaptic cell adhesion in synaptogenesis and synaptic function. They confirm the similar transsynaptic role of SynCAM and NL1 but extend the description of this role to a differential activity in neurons that, at least in the case of SynCAM, is selective for a particular type. The differences in SynCAM and NL1 function when overexpressed in neurons provide a striking example of uncoupling between functional and structural synaptogenesis. In view of these differences, the action of the two molecules may complement each other in situ. Future experiments that test other putative synaptic cell adhesion molecules, as well as analysis of heterologous synapses beyond their basic properties, will be instrumental in understanding the mechanisms of synapse assembly and factors that regulate synapse heterogeneity in the mammalian CNS.
Footnotes
This work was supported by National Institute of Mental Health Grants MH052804 (T.C.S.), MH066198, and MH068437 (E.T.K.) and by the Rett Syndrome Research Foundation (E.T.K). We thank K. Huber, H. Krämer, L. Monteggia, and T. Virmani for helpful discussions.
Correspondence should be addressed to Ege T. Kavalali, Center for Basic Neuroscience, University of Texas Southwestern Medical Center, 5323 Harry Hines Boulevard, Dallas, TX 75390-9111. E-mail: ege.kavalali@utsouthwestern.edu.
Copyright © 2005 Society for Neuroscience 0270-6474/05/250260-11$15.00/0
References
- Benson DL, Tanaka H (1998) N-cadherin redistribution during synaptogenesis in hippocampal neurons. J Neurosci 18: 6892-6904. [DOI] [PMC free article] [PubMed] [Google Scholar]
- Biederer T, Sara Y, Mozhayeva M, Atasoy D, Liu X, Kavalali ET, Sudhof TC (2002) SynCAM, a synaptic adhesion molecule that drives synapse assembly. Science 297: 1525-1531. [DOI] [PubMed] [Google Scholar]
- Bliss T, Errington M, Fransen E, Godfraind JM, Kauer JA, Kooy RF, Maness PF, Furley AJ (2000) Long-term potentiation in mice lacking the neural cell adhesion molecule L1. Curr Biol 10: 1607-1610. [DOI] [PubMed] [Google Scholar]
- Bozdagi O, Shan W, Tanaka H, Benson DL, Huntley GW (2000) Increasing numbers of synaptic puncta during late-phase LTP: N-cadherin is synthesized, recruited to synaptic sites, and required for potentiation. Neuron 28: 245-259. [DOI] [PubMed] [Google Scholar]
- Chen L, Chetkovich DM, Petralia RS, Sweeney NT, Kawasaki Y, Wenthold RJ, Bredt DS, Nicoll RA (2000) Stargazin regulates synaptic targeting of AMPA receptors by two distinct mechanisms. Nature 408: 936-943. [DOI] [PubMed] [Google Scholar]
- Dean C, Scholl FG, Choih J, DeMaria S, Berger J, Isacoff E, Scheiffele P (2003) Neurexin mediates the assembly of presynaptic terminals. Nat Neurosci 6: 708-716. [DOI] [PMC free article] [PubMed] [Google Scholar]
- Demyanenko GP, Maness PF (2003) The L1 cell adhesion molecule is essential for topographic mapping of retinal axons. J Neurosci 23: 530-538. [DOI] [PMC free article] [PubMed] [Google Scholar]
- Fannon AM, Colman DR (1996) A model for central synaptic junctional complex formation based on the differential adhesive specificities of the cadherins. Neuron 17: 423-434. [DOI] [PubMed] [Google Scholar]
- Fu Z, Washbourne P, Ortinski P, Vicini S (2003) Functional excitatory synapses in HEK293 cells expressing neuroligin and glutamate receptors. J Neurophysiol 90: 3950-3957. [DOI] [PubMed] [Google Scholar]
- Goda Y, Davis GW (2003) Mechanisms of synapse assembly and disassembly. Neuron 40: 243-264. [DOI] [PubMed] [Google Scholar]
- Harata N, Pyle JL, Aravanis AM, Mozhayeva M, Kavalali ET, Tsien RW (2001) Limited numbers of recycling vesicles in small CNS nerve terminals: implications for neural signaling and vesicular recycling. Trends Neurosci 24: 637-643. [DOI] [PubMed] [Google Scholar]
- Ichtchenko K, Hata Y, Nguyen T, Ullrich B, Missler M, Moomaw C, Sudhof TC (1995) Neuroligin 1: a splice site-specific ligand for beta-neurexins. Cell 81: 435-443. [DOI] [PubMed] [Google Scholar]
- Ichtchenko K, Nguyen T, Sudhof TC (1996) Structures, alternative splicing, and neurexin binding of multiple neuroligins. J Biol Chem 271: 2676-2682. [DOI] [PubMed] [Google Scholar]
- Inoue A, Sanes JR (1997) Lamina-specific connectivity in the brain: regulation by N-cadherin, neurotrophins, and glycoconjugates. Science 276: 1428-1431. [DOI] [PubMed] [Google Scholar]
- Irie M, Hata Y, Takeuchi M, Ichtchenko K, Toyoda A, Hirao K, Takai Y, Rosahl TW, Sudhof TC (1997) Binding of neuroligins to PSD-95. Science 277: 1511-1515. [DOI] [PubMed] [Google Scholar]
- Jamain S, Quach H, Betancur C, Rastam M, Colineaux C, Gillberg IC, Soderstrom H, Giros B, Leboyer M, Gillberg C, Bourgeron T (2003) Mutations of the X-linked genes encoding neuroligins NLGN3 and NLGN4 are associated with autism. Nat Genet 34: 27-29. [DOI] [PMC free article] [PubMed] [Google Scholar]
- Kavalali ET, Klingauf J, Tsien RW (1999) Activity-dependent regulation of synaptic clustering in a hippocampal culture system. Proc Natl Acad Sci USA 96: 12893-12900. [DOI] [PMC free article] [PubMed] [Google Scholar]
- Laumonnier F, Bonnet-Brilhault F, Gomot M, Blanc R, David A, Moizard MP, Raynaud M, Ronce N, Lemonnier E, Calvas P, Laudier B, Chelly J, Fryns JP, Ropers HH, Hamel BC, Andres C, Barthelemy C, Moraine C, Briault S (2004) X-linked mental retardation and autism are associated with a mutation in the NLGN4 gene, a member of the neuroligin family. Am J Hum Genet 74: 552-557. [DOI] [PMC free article] [PubMed] [Google Scholar]
- Miskevich F, Zhu Y, Ranscht B, Sanes JR (1998) Expression of multiple cadherins and catenins in the chick optic tectum. Mol Cell Neurosci 12: 240-255. [DOI] [PubMed] [Google Scholar]
- Missler M, Zhang W, Rohlmann A, Kattenstroth G, Hammer RE, Gottmann K, Sudhof TC (2003) Alpha-neurexins couple Ca2+ channels to synaptic vesicle exocytosis. Nature 423: 939-948. [DOI] [PubMed] [Google Scholar]
- Mohrmann R, Lessmann V, Gottmann K (2003) Developmental maturation of synaptic vesicle cycling as a distinctive feature of central glutamatergic synapses. Neuroscience 117: 7-18. [DOI] [PubMed] [Google Scholar]
- Mozhayeva MG, Sara Y, Liu X, Kavalali ET (2002) Development of vesicle pools during maturation of hippocampal synapses. J Neurosci 22: 654-665. [DOI] [PMC free article] [PubMed] [Google Scholar]
- Nguyen T, Sudhof TC (1997) Binding properties of neuroligin 1 and neurexin 1beta reveal function as heterophilic cell adhesion molecules. J Biol Chem 272: 26032-26039. [DOI] [PubMed] [Google Scholar]
- Polo-Parada L, Bose CM, Landmesser LT (2001) Alterations in transmission, vesicle dynamics, and transmitter release machinery at NCAM-deficient neuromuscular junctions. Neuron 32: 815-828. [DOI] [PubMed] [Google Scholar]
- Polo-Parada L, Bose CM, Plattner F, Landmesser LT (2004) Distinct roles of different neural cell adhesion molecule (NCAM) isoforms in synaptic maturation revealed by analysis of NCAM 180 kDa isoform-deficient mice. J Neurosci 24: 1852-1864. [DOI] [PMC free article] [PubMed] [Google Scholar]
- Rafuse VF, Polo-Parada L, Landmesser LT (2000) Structural and functional alterations of neuromuscular junctions in NCAM-deficient mice. J Neurosci 20: 6529-6539. [DOI] [PMC free article] [PubMed] [Google Scholar]
- Rao A, Harms KJ, Craig AM (2000) Neuroligation: building synapses around the neurexin-neuroligin link. Nat Neurosci 3: 747-749. [DOI] [PubMed] [Google Scholar]
- Rosenmund C, Stevens CF (1996) Definition of the readily releasable pool of vesicles at hippocampal synapses. Neuron 16: 1197-1207. [DOI] [PubMed] [Google Scholar]
- Rougon G, Hobert O (2003) New insights into the diversity and function of neuronal immunoglobulin superfamily molecules. Annu Rev Neurosci 26: 207-238. [DOI] [PubMed] [Google Scholar]
- Sanes JR, Yamagata M (1999) Formation of lamina-specific synaptic connections. Curr Opin Neurobiol 9: 79-87. [DOI] [PubMed] [Google Scholar]
- Scheiffele P (2003) Cell-cell signaling during synapse formation in the CNS. Annu Rev Neurosci 26: 485-508. [DOI] [PubMed] [Google Scholar]
- Scheiffele P, Fan J, Choih J, Fetter R, Serafini T (2000) Neuroligin expressed in nonneuronal cells triggers presynaptic development in contacting axons. Cell 101: 657-669. [DOI] [PubMed] [Google Scholar]
- Schnell E, Sizemore M, Karimzadegan S, Chen L, Bredt DS, Nicoll RA (2002) Direct interactions between PSD-95 and stargazin control synaptic AMPA receptor number. Proc Natl Acad Sci USA 99: 13902-13907. [DOI] [PMC free article] [PubMed] [Google Scholar]
- Song JY, Ichtchenko K, Sudhof TC, Brose N (1999) Neuroligin 1 is a postsynaptic cell-adhesion molecule of excitatory synapses. Proc Natl Acad Sci USA 96: 1100-1105. [DOI] [PMC free article] [PubMed] [Google Scholar]
- Uchida N, Honjo Y, Johnson KR, Wheelock MJ, Takeichi M (1996) The catenin/cadherin adhesion system is localized in synaptic junctions bordering transmitter release zones. J Cell Biol 135: 767-779. [DOI] [PMC free article] [PubMed] [Google Scholar]
- Zhu H, Luo L (2004) Diverse functions of N-cadherin in dendritic and axonal terminal arborization of olfactory projection neurons. Neuron 42: 63-75. [DOI] [PubMed] [Google Scholar]
- Ziv NE, Garner CC (2004) Cellular and molecular mechanisms of presynaptic assembly. Nat Rev Neurosci 5: 385-399. [DOI] [PubMed] [Google Scholar]


