

Abstract
Although gyral and sulcal patterns are highly heritable, and emerge in a tightly controlled sequence during development, very little is known about specific genetic contributions to abnormal gyrification or the resulting functional consequences. Williams syndrome (WS), a genetic disorder caused by hemizygous microdeletion on chromosome 7q11.23 and characterized by abnormal brain structure and striking cognitive (impairment in visuospatial construction) and behavioral (hypersocial/anxious) phenotypes, offers a unique opportunity to study these issues. We performed a detailed analysis of sulcal depth based on geometric cortical surface representations constructed from high-resolution magnetic resonance imaging scans acquired from participants with WS and from healthy controls who were matched for age, sex, and intelligence quotient, and compared between-group differences with those obtained from a voxel-based morphometry analysis. We found bilateral reductions in sulcal depth in the intraparietal/occipitoparietal sulcus (PS) in the brains of participants with WS, as well as in the collateral sulcus and the orbitofrontal region in the left hemisphere. The left-hemisphere PS in the WS group averaged 8.5 mm shallower than in controls. Sulcal depth findings in the PS corresponded closely to measures of reduced gray matter volume in the same area, providing evidence that the gray matter volume loss and abnormal sulcal geometry may be related. In the context of previous functional neuroimaging findings demonstrating functional alterations in the same cortical regions, our results further define the neural endophenotype underlying visuoconstructive deficits in WS, set the stage for defining the effects of specific genes, and offer insight into genetic mechanisms of cortical gyrification.
Keywords: Williams syndrome, brain imaging, sulcal depth, visuospatial construction, intraparietal sulcus, MRI, cortical surface models
Introduction
The study of associations between human genetics, brain structure and function, and cognition represents one of the important challenges of modern science. Williams syndrome (WS) is a rare disorder that offers an exceptional opportunity to study a well characterized genetic defect, a hemizygous microdeletion on chromosome 7q11.23 (Morris and Mervis, 2000), which is associated with a specific neurobehavioral phenotype (Metcalfe, 1999; Mervis and Klein-Tasman, 2000). Individuals with WS show severe deficits in visuospatial construction (i.e., the ability to visualize a compound object as a set of parts or to construct a copy) (Frangiskakis et al., 1996; Mervis et al., 2000), are hypersocial, and evidence anticipatory anxiety and specific phobia. Current neuroimaging methods are uniquely positioned to help discover “intermediate phenotypes” characterizing underlying abnormalities on the neural systems level. Among potential endophenotypes, cortical folding is an attractive candidate, because brain structure is highly heritable (Thompson et al., 2001b; Wright et al., 2002), and the emergence of folding patterns is under tight developmental control (Mima and Mikawa, 2004). Several studies have addressed the macroscopic cortical abnormalities found in WS, using qualitative/descriptive (Galaburda and Bellugi, 2000; Galaburda et al., 2001), volumetric (Reiss et al., 2000), and voxel-based morphometry (VBM) (Meyer-Lindenberg et al., 2004; Reiss et al., 2004) approaches. However, these methods do not directly characterize what is arguably the most salient feature of the cortex: its highly convoluted surface geometry. This geometry can be studied with surface models created from high-resolution magnetic resonance imaging (MRI), using recently developed software tools such as FreeSurfer (Dale et al., 1999; Fischl et al., 1999a) and Surefit (Van Essen et al., 2001; Van Essen, 2004), which allow comparison of morphometric properties such as sulcal depth at each node of a polygonal-mesh cortical representation. Surface-based registration based on gyral and sulcal patterns allows the comparison of such measures between groups. This approach has been shown to improve the power of group-comparison analyses relative to traditional volume-based registration methods (Fischl et al., 1999b) and should be free of bias, provided that the analysis uses a customized brain template (Good et al., 2001; Thompson et al., 2001a). Because gray matter is contained in the convoluted cortical sheet, it can be expected that sulcal geometry may be related to differences in local gray matter volume.
Because WS is associated with mild-to-moderate retardation, inferential power is limited when typical participants with WS are compared with normal controls. This is particularly relevant to studies of the cortex, because general intelligence has been shown to be associated with brain structure in healthy humans (Thompson et al., 2001b). To avoid this problem, we studied a selected group of high-functioning participants with WS and normal intelligence quotient (IQ). We recently found localized gray matter volume reductions in this type of group (relative to matched controls) in the intraparietal/occipitoparietal sulcus (PS) and orbitofrontal cortex (OFC) using VBM (Meyer-Lindenberg et al., 2004). Because surface-based cortical measures have been shown to be sensitive to age (Chung et al., 2003; Sowell et al., 2004) and gender (Luders et al., 2004), we controlled for these parameters as well.
Materials and Methods
Overview. We constructed cortical surface models from high-resolution MRI images and then computed the distributions of sulcal depth in a group of participants with WS and in a group of matched healthy controls. For group analyses, we created a customized cortical surface template, performed surface-based registration to this template for each participant, and compared sulcal depth measures across the two groups on a standardized average surface. To aid in our analyses, and for visualization purposes, we also created average cortical surface representations for the individual groups. Results were visualized on these average surfaces, and further analyzed on individual surfaces. Finally, changes in cortical geometry were compared with local reductions in gray matter volume, as measured by VBM.
Participants. We studied an exceptional group of 14 participants with WS [seven female (F), seven male (M); mean age, 27.6 years; SD, 9.6] and normal IQs (mean, 91.2; SD, 9.7) and a group of 13 demographically matched (6 F, 7 M; mean age, 31.2 years; SD, 7.1; mean IQ, 95.7; SD, 5.5) healthy controls (Table 1). Participants with WS were genetically tested with fluorescence in situ hybridization to verify the WS diagnosis. All participants with WS in this study had typical hemideletions in the WS-critical area (Morris and Mervis, 2000) of chromosome 7q11.23. Healthy controls were screened for medical and psychiatric conditions and for drug or alcohol abuse. All participants provided written informed consent as specified by the National Institute of Mental Health Internal Review Board and were compensated for their time.
Table 1.
Participant demographics
|
|
Gender |
Age |
Handedness |
IQ |
|---|---|---|---|---|
| Controls | 6 F, 7 M | 31.2 | 100% right | 95.7 |
| WS | 7 F, 7 M | 27.6 | 100% right | 91.2 |
|
p value |
0.84a
|
0.29b
|
|
0.18b
|
χ2 test.
t test.
Image acquisition and preprocessing. For each participant, six axial high-resolution structural images (spoiled gradient-recalled acquisition in a steady-state sequence, 124 slices; echo time, 5.2 ms; repetition time, 12 ms; field of view, 24 mm; resolution, 0.9375 × 0.9375 × 1.2 mm) were acquired on a 1.5 T scanner (GE Signa, Milwaukee, WI). These structural images were intensity normalized (Sled et al., 1998), registered using the Analysis of Functional NeuroImages (AFNI) (Cox, 1996) 3dvolreg tool, and averaged using the AFNI 3dMean tool to improve the signal-to-noise ratio. The brain extraction tool from the Oxford Centre for Functional Magnetic Resonance Imaging of the Brain (Oxford, UK) (Smith, 2002) was used in combination with Interactive Segmentation of MEDx (Medical Numerics, Sterling, VA) to remove extracranial matter from the averaged image. FreeSurfer version 0.9 (Dale et al., 1999; Fischl et al., 1999a) was used to segment gray and white matter and to create white matter, “inflated white matter,” and pial surface representations for each participant. Segmentations and surface meshes were subjected to careful visual inspection, and segmentations were manually corrected when necessary. The resulting surface representations consisted of large numbers (typically 150,000) of points, or nodes, connected in a triangular mesh. In the course of creating inflated surfaces, FreeSurfer computed sulcal depth measures as described previously (Fischl et al., 1999a), by integrating the dot product of the movement vector during inflation with the surface normal vector at each node.
Sulcal depth analysis. To avoid bias in the normalization procedure, a custom template was created using the FreeSurfer mris_make_template tool, based on cortical surfaces from all 27 participants. Individual surface representations were then spherically registered to this template, and the resulting surface-to-surface mappings were used to project individual sulcal depth data onto common surfaces for purposes of visualization, group data averaging, and statistical comparisons. The FreeSurfer mris_make_average tool was used to create within-group average surfaces and a combined average surface. These average surfaces contained equal numbers of nodes that were in correspondence because of their icosahedral sampling.
Between-group statistical comparisons of sulcal depth were made using the FreeSurfer mris_glm tool with 200 iterations of nearest-neighbor spatial smoothing. Analyses were restricted to regions identified as sulcal in both group averages, based on the sign of the sulcal depth. Thresholds were based on a false discovery rate (FDR) value of p = 0.01, thus limiting the expected proportion of false positives among suprathreshold voxels to 1 in 100 (Genovese et al., 2002). These results were confirmed with nonparametric permutation tests (using custom software developed by the authors) on data that were subjected to surface-based diffusion smoothing (Chung et al., 2003) with a full width at half-maximum of 25 mm [in keeping with recent surface-smoothing guidelines (Lerch and Evans, 2005)]. Statistical testing consisted of randomly permuting the members of the two groups 1000 times and comparing the difference between group-average sulcal depth values in each case to the difference in the canonical case (in which WS and control participants were properly labeled). The p value for this test corresponded to the rank position of the difference in the canonical case within the distribution of differences generated from all 1000 permutations.
The AFNI SurfMeasures tool was used to compute sulcal depth differences within selected regions of interest (ROIs). Volumetric VBM data were overlaid onto the overall average surface using the AFNI 3dVol2Surf tool. Surface-based figures presented here were produced using SUMA (Saad et al., 2004), the AFNI surface-visualization tool.
VBM analysis. The averaged MRI scans described above were processed using an optimized VBM protocol (Good et al., 2001), which included creating group-specific (volumetric) templates. An initial 12- parameter affine spatial normalization was performed, followed by nonlinear spatial normalization using an optimal linear combination of 4 × 5 × 4 spatial basis functions. The Jacobian-modulated gray matter maps were smoothed using a 10 mm isotropic Gaussian filter. Results were thresholded at a level of p = 0.01 (corrected for multiple comparisons on the voxel level). Additional details of our VBM methods were provided previously (Meyer-Lindenberg et al., 2004).
Results
Group analyses: sulcal depth and VBM
Between-group comparisons of sulcal depth revealed several areas of localized sulcal depth reduction in WS. Figure 1 shows sulcal depth measures that were averaged by group and then displayed on the composite average inflated surface. Because the depth measures obtained from FreeSurfer were normalized with zero mean and unit variance, the scale of 0-2, shown in Figure 1, represents 2 SDs. For ease of visualization, sulcal depth values were used to modulate the height of the inflated surface in an outwardly normal direction, and gyral regions are not shown. Striking reductions in sulcal depth, as highlighted in the maps of statistical difference (Fig. 1 B, C, bottom rows), were found in the PS regions bilaterally, and reductions were also seen in the left collateral sulcus and OFC. The statistical threshold for these maps was based on an FDR threshold of p = 0.01. Significant differences were confirmed by nonparametric permutation testing. The differences indicated by the statistical analysis are clearly visible when inspecting the within-group average surfaces side by side. The PS is shallower for WS than for controls, as shown in Figure 2, which depicts posterior views of within-group averaged white matter surfaces for both hemispheres.
Figure 1.
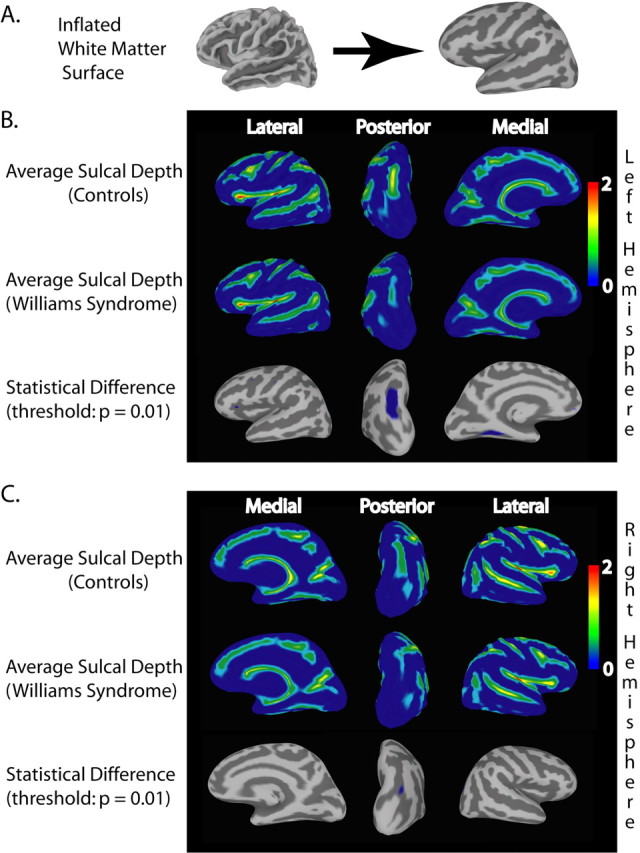
Average sulcal depth measures for the WS and control groups and areas of statistically significant difference. Maps of average normalized (depths on individual surfaces were normalized with zero mean and unit variance) sulcal depth were constructed after all participants' surface representations underwent spherical registration to a custom template to align gyral and sulcal patterns. For ease of visualization, sulcal depth values were used to modulate the height of the surface in an outwardly normal direction. A, Correspondence of folded white matter and inflated surface, illustrating how sulcal patterns are displayed on the inflated surface. B, Views of average sulcal depth for the left hemisphere in healthy control (top row) and WS (middle row) groups. The last row shows the statistical difference map, which is thresholded using a false discovery rate of p = 0.01. The largest regions of significant difference were found in the PS and the collateral sulcus. C, Similar views for sulcal depth data on the right hemisphere. Note the significant difference in the PS in this hemisphere as well.
Figure 2.
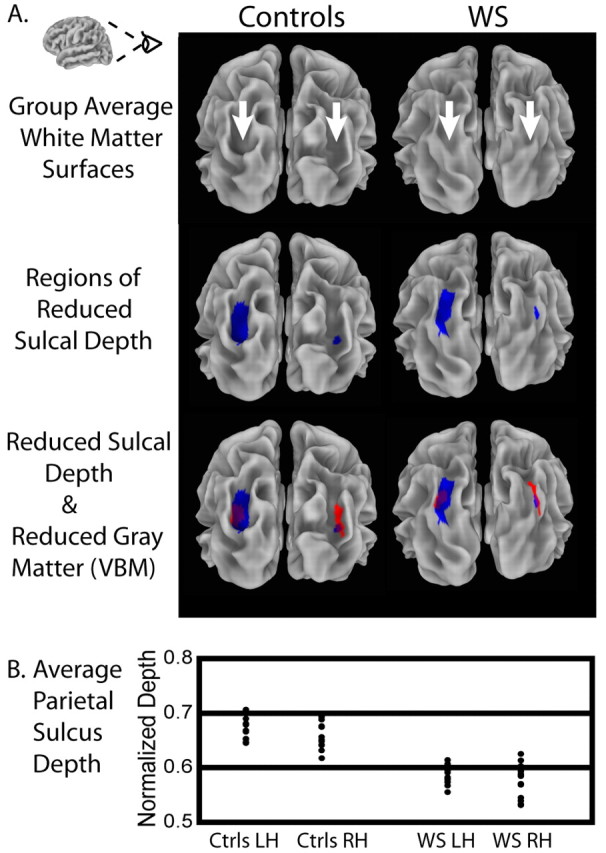
Illustration of significantly shallower PS found in WS. A, Top row shows posterior views of within-group average cortical surface models for control and WS groups, showing the visibly deeper sulci (indicated by arrows) in the average representation of the brains of controls. The middle row highlights the regions of significant group differences in normalized sulcal depth (shown in blue) on these average surface models. The bottom row additionally overlays the results (shown in red) of a VBM analysis for the same group of participants (thresholded at p = 0.01 corrected), showing regions of significant reduction in local gray matter volume. Overlapping regions are shown in purple. B, Plot of individual participants' sulcal depth measures within the ROI defined by the thresholded sulcal depth statistics (i.e., the regions shown in blue) in the PS region. Each point in the plot represents the average sulcal depth within the back-projected version of the ROI (using the inverse of the spherical registration transformation) on an individual participant's surface. RH, Right hemisphere; LH, left hemisphere.
Our VBM analysis indicated regions of significantly reduced gray matter volume bilaterally in the PS as well. The third row of Figure 2 provides a visual comparison of the results of the sulcal depth and VBM analyses, demonstrating the high degree of spatial concordance between the PS abnormalities found using these two methods. Figure 2 also shows a plot of individual participants' normalized sulcal depth measures within the ROIs defined by the thresholded sulcal depth statistics (i.e., the regions shown in blue) in the PS region bilaterally. Each point in the plot represents the average sulcal depth within the back-projected version of the ROI on an individual surface. The overall averages within the region were naturally lower than the peak values shown in Figure 1, but the average depths for the WS participants were consistently less, indicating relatively shallower sulci. There was, in fact, no overlap between the groups in the left hemisphere on this measure, and only a single participant with WS overlapped the control group in the right hemisphere. We quantified this difference in absolute terms in the left hemisphere by calculating the node-by-node position differences between the two group-average surfaces within the left-hemisphere ROI: on average, the PS was 8.5 mm deeper (SD, 2.0 mm) in controls than in participants with WS.
Figure 3 shows an inferiomedial viewpoint of the left hemisphere of the overall average surface, showing the significant (p = 0.01) differences in sulcal depth (in blue) within the collateral sulcus as well as on the medial aspect of the OFC region. The VBM statistical map (threshold was p = 0.01 corrected) is overlaid as well (Fig. 3, in red), illustrating a small region of gray matter volume reduction in the OFC. Although it is somewhat near the blue region of reduced sulcal depth in the OFC, the spatial correspondence is not nearly as strong here as in the PS. The regions of gray matter volume reduction and reduced sulcal depth do not overlap at p value thresholds of either 0.01 or 0.05. The VBM analysis did not indicate a gray matter volume reduction in the collateral sulcus.
Figure 3.

Inferiomedial views of overall average surfaces (white matter and inflated), illustrating regions of significant (p = 0.01) sulcal depth difference and significant (p = 0.01 corrected) local gray matter volume reduction (based on VBM analysis). Significantly shallower sulcal regions (shown in blue) were found within the collateral sulcus and in the orbitofrontal region. The orbitofrontal region also shows a small near by region of significant local gray matter volume reduction (in red).
Single-subject analyses
To investigate both group variability and individual contributions to our result in the PS, we examined single-subject surfaces. Figure 4 shows the sulcal depth group difference statistics (displayed in Figs. 1, 2) back-projected to individual inflated left hemisphere surfaces of participants with WS. We used inflated surfaces to ensure that the region, which typically lies at the bottom of a sulcus, was visible in all cases. Back-projecting the ROI from the standard surface in this way shows that individual PS regions were generally well mapped to the template, with very few “interruptions” of the back-projected sulcus by gyral regions. The individual surface maps additionally provide an indication of the anatomical variability dealt with by the surface-based registration. Figure 4 also shows the variance of the sulcal depth measures for the WS group, mapped onto the group's average white matter surface to allow for a more familiar visual anatomic interpretation. The variance in sulcal depth was found to be the highest within the central region of the PS on the average surface.
Figure 4.

Regions of significant group differences in PS sulcal depth (shown in blue), projected (using the inverse of the spherical registration transformation) onto individual WS participants' inflated left hemisphere surfaces, illustrating the range of anatomical variability dealt with by the surface-based registration and also showing that the projected blue regions lie within PS regions on the individual surfaces in their native space. At bottom right, the variance of the sulcal depth measures for the WS group is mapped onto the group's average white matter representation (to allow a more familiar visual anatomic interpretation), illustrating a high degree of variance (up to 0.08 in normalized units) in sulcal depth within the PS region for the WS group.
Figure 5 shows equivalent views for individual healthy controls (i.e., sulcal-depth statistics back-projected to individual inflated left hemisphere surfaces of the control participants) and the variance in sulcal depth for the control group mapped onto the white matter surface of the average controls. In this case, the variance on the white matter surface is additionally shown from a posterior viewpoint to properly visualize the (deeper, in this case) PS. These visualizations also demonstrate a typical amount of anatomical variability and show that individual PS regions were generally well registered with respect to the PS region for healthy controls of the template. In contrast to the WS group, however, the variance in sulcal depth within the PS region for controls was quite low.
Figure 5.

Regions of significant (p = 0.01) group differences in PS sulcal depth (shown in blue), projected (using the inverse of the registration transformation) onto individual control participants' inflated left hemisphere surfaces. These images demonstrate anatomical variability as in Figure 4 and show that the projected blue regions lie within PS regions on the individual surfaces in their native space as well. The surface shown at bottom right is the control group's average white matter representation, onto which the group variance in sulcal depth is projected. The variance on the white matter surface is also shown from a directly posterior viewpoint to properly visualize the (deeper, in the case of healthy controls) PS. Note that the variance within the PS region is much lower than the variance in the same region for the WS group (shown in Fig. 4).
Discussion
Our analysis of sulcal geometry in a selected group of high-functioning participants with WS relative to a healthy, IQ-matched control group revealed significant depth reductions bilaterally in the PS, with additional significant reductions observed in the left orbitofrontal region and in the left collateral sulcus. The most pronounced finding was in the left PS, which was 8.5 mm shallower in the WS group. In addition to the striking depth reduction, we also observed locally higher variance of this parameter within this region in WS participants than in controls, as shown in Figure 4, consistent with increased variability attributable to a pathological process. In a previous study comparing groups similar to these (smaller by one WS and two control participants), we found that the PS played a crucial role in the visuoconstructive deficit that is the hallmark neuropsychological feature of WS (Meyer-Lindenberg et al., 2004). A reduction in gray matter density, based on VBM analysis, was also recently observed in a locale very similar in persons with WS and mental retardation (Reiss et al., 2004). Together with supporting functional imaging results from typical WS participants (Mobbs et al., 2004; Eckert et al., 2005) and convergent neuropsychological evidence (Mervis et al., 2000; Nakamura et al., 2001; Galaburda et al., 2002; Paul et al., 2002; Atkinson et al., 2003), our results emphasize the importance of this region in the pathophysiology of WS. Importantly, recently presented data from a different group of participants (of typically lower IQ) with WS (Van Essenet al., 2004) directly support the current findings by also identifying a circumscribed depth reduction in PS as the most pronounced sulcal depth abnormality in WS. It is also noteworthy that previous measurements of gyrification indices subdivided by lobe (Schmitt et al., 2002), although not directly referable to depth measurements on the cortical surface, showed significant parietal abnormality. Our examinations of single-subject surfaces did not reveal gross qualitative abnormalities in the PS region. Rather, we found that the sulci were reliably shallower in the WS group, arguing for a consistent (although variable in magnitude) genetically driven pathological process in an anatomically defined region that underlies both the sulcal depth and VBM finding.
To our knowledge, this is the first study in which results from VBM and surface-based analysis of sulcal depth have been directly compared. It is therefore encouraging that the largest area of gray matter volume reduction identified by VBM was also shown to have abnormally reduced sulcal depth. The findings in the PS region are consistent with a geometric interpretation in which the gray matter volume within the cortical sheet in the sulcal “valley” is reduced in proportion to the reduction in surface area of the shallower valley. This interpretation is compatible with the results of a recent study of cortical thickness in WS participants with mental retardation (Thompson et al., 2005), which did not show regional cortical thickness change (by unit surface) in PS, supporting the concept that our observed gray matter volume and sulcal depth reductions in this region are proportionate and perhaps causally linked by one of the biological mechanisms discussed below.
Our study used a customized spherical template for surface registration, enabling reliable unbiased statistical assessment of depth differences across the entire cortical surface based on alignment of all surface features. Given our findings of increased variability in regions of abnormal gyrification, it might be useful to explore new matching techniques that employ restricted sets of surface features that may be more robust to pathology (Van Essen et al., 2004). Additionally, we limited our study to an examination of sulcal depth. Additional analyses, taking into account measures of cortical thickness and its interaction with the geometry of the cortical sheet, should help to complete the picture of abnormal gray matter distribution in WS.
With respect to the OFC, the convergent evidence for structural abnormalities presented here emphasizes the need for additional study of this region, which has been shown to be important in social cognition and in the regulation of emotion (Adolphs, 2003). In addition, we identified a region of abnormal sulcal depth in the collateral sulcus, for which VBM analysis did not indicate a gray matter volume reduction. It is interesting to note that this region has been implicated as a zone of converging dorsal and ventral visual-stream information subserving spatial navigation (Suzuki and Amaral, 1994; Epstein et al., 1999). Because dorsal stream function (Meyer-Lindenberg et al., 2004) and spatial cognition (O'Hearn et al., 2005) are both deficient in WS, this might indicate subtle dysfunction in this region that should be studied further.
Our findings are in agreement with current theories on cortical gyrification and its pathological alteration. During development, the human cortex changes from a smooth (lissencephalic) structure to one that is highly convoluted (Chi et al., 1977). It is commonly assumed that a major determinant of the size of a cortical area is the number of cells it contains and the volume of their (dendritic and synaptic) interconnections. Because each region acquires its mature complement of cells through combinations of cell division, cell death, and cell migration, the total number of divisions among the progenitor cells of a region is a major determinant of its eventual size, along with removal of postmitotic cells by apoptosis and migration (Mima and Mikawa, 2004). Thus, the theory by Mima and Mikawa (2004) predicts that the pattern of cortical folding depends, at least partly, on nonuniform distribution of neuronal differentiation and neurite growth. Our results in the PS support this theory by showing concurrent reductions of gray matter volume and sulcal depth. Remarkably, in the rhesus monkey, it has been shown that, over the entire cortex, the maximal degree of cortical folding occurs in the posterior parietal-anterior occipital region (Armstrong et al., 1991), suggesting a potential mechanical reason that a genetically determined reduction in gray matter volume might lead to pronounced changes in gyrification in this region. Armstrong et al. (1991) also observed that the occipitoparietal region had the largest ratio of supragranular laminas to the lower granular and infragranular layers and that this parameter was related to cortical folding. It would be of interest to determine whether an alteration of this cellular ratio could be found postmortem in WS.
According to the radial unit hypothesis (Rakic, 2003), cortical neurons originate in proliferative zones lining the cerebral cavity and migrate to their proper positions guided by transient scaffolds formed by shafts of elongated radial glial cells that appear to be under genetic control in humans (Rakic, 2004). Interestingly, this approach indicates different cellular mechanisms determining cortical thickness and sulcal depth (Rakic, 2004), which could explain our findings of reduced PS sulcal depth in WS, whereas others find PS thickness to be unaffected in WS (Thompson et al., 2005). It has also been shown that changes in subcortical connectivity patterns can effect gyral patterns (Rakic, 1988), which complements Van Essen's (1997) theory that tension along axons in white matter can explain how and why the cortex folds in characteristic species-specific patterns. Our results are consistent with these proposals assuming that a reduced population of neurons in PS would result in a reduction in local white matter connections. Additional investigation, particularly diffusion tensor-based imaging, would be helpful in testing this hypothesis. Preliminary data in a subgroup of five participants with WS in fact showed abnormal white matter integrity, using the trace and fractional anisotropy parameters, in the region immediately underlying PS (Marenco et al., 2004).
Because general IQ (Thompson et al., 2001b) and neuropsychological function (Fornito et al., 2004) have both been linked to cortical folding patterns in humans, our use of high-functioning participants with WS removed an important potential problem in interpreting our results: because they cannot be explained by between-group IQ differences, they are likely to be closely related to the genetic determinants of WS. Of course, additional abnormalities may emerge in the study of typical WS participants with mental retardation. It would be particularly interesting to compare high- and low-IQ WS groups to determine whether some aspects of cortical folding might be differentially related to intelligence.
The convergent evidence for a key role of PS in WS leads to the question of molecular mechanisms underlying the observed structural abnormality, which would, in turn, point to genetic pathways leading to visuoconstructive deficits. Two important candidate genes that lie within the WS critical region are LIM (a cysteine- and histidine-rich, zinc-coordinating domain composed of two tandemly repeated zinc fingers) kinase 1 (LIMK1), implicated by linkage in the genesis of the visuospatial constructive deficit (Frangiskakis et al., 1996), and cytoplasmic linker 2 (CYLN2) (Hoogenraad et al., 2002). Both genes regulate dynamic aspects of the cytoskeleton of the cell (Hoogenraad et al., 2004), either via the actin filament system (LIMK1), or through the microtubule network (CYLN2), suggesting cellular mechanisms by which the observed alterations in cortical folding could arise. Subsequent knockout mice studies (Hoogenraad et al., 2002; Meng et al., 2002) have confirmed abnormal neural development and structure, making the study of these genes, particularly in small deletion families (Frangiskakis et al., 1996; Morris et al., 2003), a promising strategy for future identification of genetic mechanisms that underlie general visuoconstructive abilities.
Footnotes
This work was supported by Department of Health and Human Services-National Institutes of Health-National Institute of Mental Health-Intramural Research Program and National Institute of Neurological Disorders and Stroke Grant NS35102 (C.B.M., principal investigator). We thank our participants with Williams syndrome and their families.
Correspondence should be addressed to J. Shane Kippenhan, Section on Integrative Neuroimaging, Clinical Brain Disorders Branch, National Institute of Mental Health, Intramural Research Program, National Institutes of Health, Department of Health and Human Services, Building 10, Room 4C101, Bethesda, MD 20892-1365. E-mail: shane_kippenhan@nih.gov.
Copyright © 2005 Society for Neuroscience 0270-6474/05/257840-07$15.00/0
A.M.-L. and K.F.B. contributed equally to this work.
References
- Adolphs R (2003) Cognitive neuroscience of human social behaviour. Nat Rev Neurosci 4: 165-178. [DOI] [PubMed] [Google Scholar]
- Armstrong E, Curtis M, Buxhoeveden DP, Fregoe C, Zilles K, Casanova MF, McCarthy WF (1991) Cortical gyrification in the rhesus monkey: a test of the mechanical folding hypothesis. Cereb Cortex 1: 426-432. [DOI] [PubMed] [Google Scholar]
- Atkinson J, Braddick O, Anker S, Curran W, Andrew R, Wattam-Bell J, Braddick F (2003) Neurobiological models of visuospatial cognition in children with Williams syndrome: measures of dorsal-stream and frontal function. Dev Neuropsychol 23: 139-172. [DOI] [PubMed] [Google Scholar]
- Chi JG, Dooling EC, Gilles FH (1977) Gyral development of the human brain. Ann Neurol 1: 86 93. [DOI] [PubMed] [Google Scholar]
- Chung MK, Worsley KJ, Robbins S, Paus T, Taylor J, Giedd JN, Rapoport JL, Evans AC (2003) Deformation-based surface morphometry applied to gray matter deformation. NeuroImage 18: 198-213. [DOI] [PubMed] [Google Scholar]
- Cox RW (1996) AFNI: software for analysis and visualization of functional magnetic resonance neuroimages. Comput Biomed Res 29: 162-173. [DOI] [PubMed] [Google Scholar]
- Dale AM, Fischl B, Sereno MI (1999) Cortical surface-based analysis. I. Segmentation and surface reconstruction. NeuroImage 9: 179-194. [DOI] [PubMed] [Google Scholar]
- Eckert MA, Hu D, Eliez S, Bellugi U, Galaburda A, Korenberg J, Mills D, Reiss AL (2005) Evidence for superior parietal impairment in Williams syndrome. Neurology 64: 152-153. [DOI] [PubMed] [Google Scholar]
- Epstein R, Harris A, Stanley D, Kanwisher N (1999) The parahippocampal place area: recognition, navigation, or encoding? Neuron 23: 115-125. [DOI] [PubMed] [Google Scholar]
- Fischl B, Sereno MI, Dale AM (1999a) Cortical surface-based analysis. II. Inflation, flattening, and a surface-based coordinate system. NeuroImage 9: 195-207. [DOI] [PubMed] [Google Scholar]
- Fischl B, Sereno MI, Tootell RB, Dale AM (1999b) High-resolution inter-subject averaging and a coordinate system for the cortical surface. Hum Brain Mapp 8: 272-284. [DOI] [PMC free article] [PubMed] [Google Scholar]
- Fornito A, Yucel M, Wood S, Stuart GW, Buchanan JA, Proffitt T, Anderson V, Velakoulis D, Pantelis C (2004) Individual differences in anterior cingulate/paracingulate morphology are related to executive functions in healthy males. Cereb Cortex 14: 424-431. [DOI] [PubMed] [Google Scholar]
- Frangiskakis JM, Ewart AK, Morris CA, Mervis CB, Bertrand J, Robinson BF, Klein BP, Ensing GJ, Everett LA, Green ED, Proschel C, Gutowski NJ, Noble M, Atkinson DL, Odelberg SJ, Keating MT (1996) LIM-kinase1 hemizygosity implicated in impaired visuospatial constructive cognition. Cell 86: 59-69. [DOI] [PubMed] [Google Scholar]
- Galaburda AM, Bellugi U (2000) V. Multi-level analysis of cortical neuroanatomy in Williams syndrome. J Cogn Neurosci 12 [Suppl 1]: 74-88. [DOI] [PubMed] [Google Scholar]
- Galaburda AM, Schmitt JE, Atlas SW, Eliez S, Bellugi U, Reiss AL (2001) Dorsal forebrain anomaly in Williams syndrome. Arch Neurol 58: 1865-1869. [DOI] [PubMed] [Google Scholar]
- Galaburda AM, Holinger DP, Bellugi U, Sherman GF (2002) Williams syndrome: neuronal size and neuronal-packing density in primary visual cortex. Arch Neurol 59: 1461-1467. [DOI] [PubMed] [Google Scholar]
- Genovese CR, Lazar NA, Nichols T (2002) Thresholding of statistical maps in functional neuroimaging using the false discovery rate. NeuroImage 15: 870-878. [DOI] [PubMed] [Google Scholar]
- Good CD, Johnsrude IS, Ashburner J, Henson RN, Friston KJ, Frackowiak RS (2001) A voxel-based morphometric study of ageing in 465 normal adult human brains. NeuroImage 14: 21-36. [DOI] [PubMed] [Google Scholar]
- Hoogenraad CC, Koekkoek B, Akhmanova A, Krugers H, Dortland B, Miedema M, van Alphen A, Kistler WM, Jaegle M, Koutsourakis M, Van Camp N, Verhoye M, van der Linden A, Kaverina I, Grosveld F, De Zeeuw CI, Galjart N (2002) Targeted mutation of Cyln2 in the Williams syndrome critical region links CLIP-115 haploinsufficiency to neurodevelopmental abnormalities in mice. Nat Genet 32: 116-127. [DOI] [PubMed] [Google Scholar]
- Hoogenraad CC, Akhmanova A, Galjart N, De Zeeuw CI (2004) LIMK1 and CLIP-115: linking cytoskeletal defects to Williams syndrome. BioEssays 26: 141-150. [DOI] [PubMed] [Google Scholar]
- Lerch JP, Evans AC (2005) Cortical thickness analysis examined through power analysis and a population simulation. NeuroImage 24: 163-173. [DOI] [PubMed] [Google Scholar]
- Luders E, Narr KL, Thompson PM, Rex DE, Jancke L, Steinmetz H, Toga AW (2004) Gender differences in cortical complexity. Nat Neurosci 7: 799-800. [DOI] [PubMed] [Google Scholar]
- Marenco S, Meyer-Lindenberg A, Kippenhan S, Olsen R, Mervis CB, Morris C, Pierpaoli C, Berman KF (2004) Preliminary diffusion tensor imaging (DTI) observations in 5 individuals with Williams syndrome (WS). Proc Hum Brain Mapp 4: M03630. [Google Scholar]
- Meng Y, Zhang Y, Tregoubov V, Janus C, Cruz L, Jackson M, Lu WY, MacDonald JF, Wang JY, Falls DL, Jia Z (2002) Abnormal spine morphology and enhanced LTP in LIMK-1 knockout mice. Neuron 35: 121-133. [DOI] [PubMed] [Google Scholar]
- Mervis CB, Klein-Tasman BP (2000) Williams syndrome: cognition, personality, and adaptive behavior. Ment Retard Dev Disabil Res Rev 6: 148-158. [DOI] [PubMed] [Google Scholar]
- Mervis CB, Robinson BF, Bertrand J, Morris CA, Klein-Tasman BP, Armstrong SC (2000) The Williams syndrome cognitive profile. Brain Cogn 44: 604-628. [DOI] [PubMed] [Google Scholar]
- Metcalfe K (1999) Williams syndrome: an update on clinical and molecular aspects. Arch Dis Child 81: 198-200. [DOI] [PMC free article] [PubMed] [Google Scholar]
- Meyer-Lindenberg A, Kohn P, Mervis CB, Kippenhan JS, Olsen RK, Morris CA, Berman KF (2004) Neural basis of genetically determined visuospatial construction deficit in Williams syndrome. Neuron 43: 623-631. [DOI] [PubMed] [Google Scholar]
- Mima T, Mikawa T (2004) Folding of the tectal cortex by local remodeling of neural differentiation. Dev Dyn 229: 475-479. [DOI] [PubMed] [Google Scholar]
- Mobbs D, Garrett AS, Menon V, Rose FE, Bellugi U, Reiss AL (2004) Anomalous brain activation during face and gaze processing in Williams syndrome. Neurology 62: 2070-2076. [DOI] [PubMed] [Google Scholar]
- Morris CA, Mervis CB (2000) Williams syndrome and related disorders. Annu Rev Genomics Hum Genet 1: 461-484. [DOI] [PubMed] [Google Scholar]
- Morris CA, Mervis CB, Hobart HH, Gregg RG, Bertrand J, Ensing GJ, Sommer A, Moore CA, Hopkin RJ, Spallone PA, Keating MT, Osborne L, Kimberley KW, Stock AD (2003) GTF2I hemizygosity implicated in mental retardation in Williams syndrome: genotype-phenotype analysis of five families with deletions in the Williams syndrome region. Am J Med Genet 123A: 45-59. [DOI] [PubMed] [Google Scholar]
- Nakamura M, Watanabe K, Matsumoto A, Yamanaka T, Kumagai T, Miyazaki S, Matsushima M, Mita K (2001) Williams syndrome and deficiency in visuospatial recognition. Dev Med Child Neurol 43: 617-621. [DOI] [PubMed] [Google Scholar]
- O'Hearn K, Landau B, Hoffman J (2005) Multiple object tracking in people with Williams syndrome and in normally developing children. Psychol Sci, in press. [DOI] [PMC free article] [PubMed]
- Paul BM, Stiles J, Passarotti A, Bavar N, Bellugi U (2002) Face and place processing in Williams syndrome: evidence for a dorsal-ventral dissociation. NeuroReport 13: 1115-1119. [DOI] [PubMed] [Google Scholar]
- Rakic P (1988) Specification of cerebral cortical areas. Science 241: 170-176. [DOI] [PubMed] [Google Scholar]
- Rakic P (2003) Developmental and evolutionary adaptations of cortical radial glia. Cereb Cortex 13: 541-549. [DOI] [PubMed] [Google Scholar]
- Rakic P (2004) Neuroscience. Genetic control of cortical convolutions. Science 303: 1983-1984. [DOI] [PubMed] [Google Scholar]
- Reiss AL, Eliez S, Schmitt JE, Straus E, Lai Z, Jones W, Bellugi U (2000) IV. Neuroanatomy of Williams syndrome: a high-resolution MRI study. J Cogn Neurosci 12 [Suppl 1]: 65-73. [DOI] [PubMed] [Google Scholar]
- Reiss AL, Eckert MA, Rose FE, Karchemskiy A, Kesler S, Chang M, Reynolds MF, Kwon H, Galaburda A (2004) An experiment of nature: brain anatomy parallels cognition and behavior in Williams syndrome. J Neurosci 24: 5009-5015. [DOI] [PMC free article] [PubMed] [Google Scholar]
- Saad Z, Reynolds R, Cox R, Argall B, Japee S (2004) SUMA: an interface for surface-based intra- and inter-subject analysis with AFNI. Proc IEEE Int Symp Biomed Imaging 4: 1510-1511. [Google Scholar]
- Schmitt JE, Watts K, Eliez S, Bellugi U, Galaburda AM, Reiss AL (2002) Increased gyrification in Williams syndrome: evidence using 3D MRI methods. Dev Med Child Neurol 44: 292-295. [DOI] [PubMed] [Google Scholar]
- Sled JG, Zijdenbos AP, Evans AC (1998) A nonparametric method for automatic correction of intensity nonuniformity in MRI data. IEEE Trans Med Imaging 17: 87-97. [DOI] [PubMed] [Google Scholar]
- Smith SM (2002) Fast robust automated brain extraction. Hum Brain Mapp 17: 143-155. [DOI] [PMC free article] [PubMed] [Google Scholar]
- Sowell ER, Thompson PM, Leonard CM, Welcome SE, Kan E, Toga AW (2004) Longitudinal mapping of cortical thickness and brain growth in normal children. J Neurosci 24: 8223-8231. [DOI] [PMC free article] [PubMed] [Google Scholar]
- Suzuki WA, Amaral DG (1994) Perirhinal and parahippocampal cortices of the macaque monkey: cortical afferents. J Comp Neurol 350: 497-533. [DOI] [PubMed] [Google Scholar]
- Thompson PM, Mega MS, Woods RP, Zoumalan CI, Lindshield CJ, Blanton RE, Moussai J, Holmes CJ, Cummings JL, Toga AW (2001a) Cortical change in Alzheimer's disease detected with a disease-specific population-based brain atlas. Cereb Cortex 11: 1-16. [DOI] [PubMed] [Google Scholar]
- Thompson PM, Cannon TD, Narr KL, van Erp T, Poutanen VP, Huttunen M, Lonnqvist J, Standertskjold-Nordenstam CG, Kaprio J, Khaledy M, Dail R, Zoumalan CI, Toga AW (2001b) Genetic influences on brain structure. Nat Neurosci 4: 1253-1258. [DOI] [PubMed] [Google Scholar]
- Thompson PM, Lee AD, Dutton RA, Geaga JA, Hayashi KM, Eckert MA, Bellugi U, Galaburda A, Korenberg JR, Mills D, Toga AW, Reiss AL (2005) Abnormal cortical complexity and thickness profiles mapped in Williams syndrome. J Neurosci 25: 4146-4158. [DOI] [PMC free article] [PubMed] [Google Scholar]
- Van Essen DC (1997) A tension-based theory of morphogenesis and compact wiring in the central nervous system. Nature 385: 313-318. [DOI] [PubMed] [Google Scholar]
- Van Essen DC (2004) Surface-based approaches to spatial localization and registration in primate cerebral cortex. NeuroImage 23: S97-S107. [DOI] [PubMed] [Google Scholar]
- Van Essen DC, Drury HA, Dickson J, Harwell J, Hanlon D, Anderson CH (2001) An integrated software suite for surface-based analyses of cerebral cortex. J Am Med Inform Assoc 8: 443-459. [DOI] [PMC free article] [PubMed] [Google Scholar]
- Van Essen DC, Snyder AZ, Raichle ME, Rose FE, Bellugi U (2004) Differences in cortical shape in Williams syndrome subjects compared to normal humans revealed by surface-based analysis. Soc Neurosci Abstr 30: 239.12. [Google Scholar]
- Wright IC, Sham P, Murray RM, Weinberger DR, Bullmore ET (2002) Genetic contributions to regional variability in human brain structure: methods and preliminary results. NeuroImage 17: 256-271. [DOI] [PubMed] [Google Scholar]