

Abstract
Many studies of neuromodulators have focused on changes in the magnitudes of neural responses, but fewer studies have examined neuromodulator effects on response latency. Across sensory systems, response latency is important for encoding not only the temporal structure but also the identity of stimuli. In the auditory system, latency is a fundamental response property that varies with many features of sound, including intensity, frequency, and duration. To determine the extent of neuromodulatory regulation of latency within the inferior colliculus (IC), a midbrain auditory nexus, the effects of iontophoretically applied serotonin on first-spike latencies were characterized in the IC of the Mexican free-tailed bat. Serotonin significantly altered the first-spike latencies in response to tones in 24% of IC neurons, usually increasing, but sometimes decreasing, latency. Serotonin-evoked changes in latency and spike count were not always correlated but sometimes occurred independently within individual neurons. Furthermore, in some neurons, the size of serotonin-evoked latency shifts depended on the frequency or intensity of the stimulus, as reported previously for serotonin-evoked changes in spike count. These results support the general conclusion that changes in latency are an important part of the neuromodulatory repertoire of serotonin within the auditory system and show that serotonin can change latency either in conjunction with broad changes in other aspects of neuronal excitability or in highly specific ways.
Keywords: latency, inferior colliculus, auditory, serotonin, neuromodulation, sensory
Introduction
The latency of the responses of sensory neurons, or the time between the stimulus onset and the neural response, encodes many features of sensory stimuli. The time of arrival is the most direct of these, and the latencies of sensory neurons accordingly vary with the properties that shape stimulus onset, such as the rise trajectory and stimulus intensity (Heil and Irvine, 1997; Barsz et al., 1998; Galazyuk and Feng, 2001). In addition to timing information, response latencies encode features that are less obviously related to the temporal properties of stimuli. For example, latency can vary with stimulus characteristics that define the receptive field of a neuron, such as the frequencies of auditory stimuli or the locations of somatosensory stimuli (Aitkin et al., 1970; Kitzes et al., 1978; Panzeri et al., 2001; Foffani et al., 2004). First-spike latencies can also represent different stimulus parameters than spike count does (Oram et al., 2002; Heil, 2004). For example, in striate cortex neurons, latency varies more directly with visual contrast than does spike count, whereas spike count varies more with stimulus orientation (Gawne et al., 1996; Reich et al., 2001; Oram et al., 2002). In some auditory cortex neurons, latency provides more information about the location of a stimulus than does spike count (Furukawa and Middlebrooks 2002). However, response latency is not always invariant for a given sensory stimulus. The latencies of sensory neurons vary in response to neuromodulators such as norepinephrine or serotonin (Bras et al., 1989; Jankowska et al., 1995, 1998; Saruhashi et al., 1997; Hammar et al., 2002; Shay and Hochman, 2002; Devilbiss and Waterhouse, 2004). This is unsurprising, because many of the factors that establish latencies, such as membrane conductances and the convergence of excitatory and inhibitory inputs, also show neuromodulator-gated plasticity.
In the auditory system, there are also several reports that neuromodulators change the timing of responses to sound (Kossl and Vater, 1989; Leao and Von Gersdorff, 2002). However, despite this evidence, there has been little focus within the auditory system or other sensory systems on the specific ways that neuromodulators change latencies and whether these vary for different cell types or occur independently from neuromodulatory effects on response strength. In the experiments described here, we addressed these issues by applying serotonin iontophoretically while recording from single neurons in the inferior colliculus (IC), a nucleus in which the stimulus features that influence latency (Park and Pollak, 1993; Fuzessery and Hall, 1996; Barsz et al., 1998; Klug et al., 2000; Galazyuk and Feng, 2001; Faure et al., 2003) and the modulation of response properties by serotonin (Hurley and Pollak, 1999, 2001; Hurley et al., 2002, 2004) have been well studied. With this approach, we characterized serotonergic effects on latency by (1) quantifying serotonergic effects on the latency and precision of spikes, (2) comparing serotonin-evoked changes in latency with changes in spike count and other response properties, and (3) determining the dependence of serotonin-evoked latency shifts on features of the stimulus.
Materials and Methods
Experimental subjects. Experiments were performed on Mexican free-tailed bats (Tadarida brasiliensis). Like other microchiropteran bats, these animals have hypertrophied and hence relatively accessible auditory systems. At the same time, much of the circuitry projecting to the IC is similar to that in other mammals (Grothe et al., 1994, 1997; Klug et al., 1999; Bauer et al., 2000). This circuitry creates many of the same latency-dependent response characteristics in Mexican free-tailed bats that are observed in other vertebrates. These response characteristics include paradoxical latency shifts, time-intensity trading, and latency-dependent binaural interactions (Kuwada and Yin, 1983; Pollak, 1988; Melssen et al., 1990; Park et al., 1998; Klug et al., 2000). Importantly, the similarities between the IC of free-tailed bats and other mammals extend to the pattern of innervation by serotonergic fibers, which is similar across species (Kaiser and Covey, 1997; Hurley and Thompson, 2001).
Surgical and recording procedures. Surgical and electrophysiological procedures were conducted as described previously (Hurley and Pollak, 1999, 2001). Briefly, animals were anesthetized by methoxyflurane or isoflurane inhalation (Metofane, Mallinckrodt, Mundelein, IL; IsoFlo, Abbott Laboratories, Chicago, IL) and injected intraperitoneally with ketamine (120 mg/kg) and xylazine (5 mg/kg). The skin and muscle overlying the skull was reflected, and 2% Lidocaine (Elkins-Sinn, Cherry Hill, NJ) was topically applied. A small hole was then drilled over the IC. The bat was transferred to a heated, sound-attenuated recording chamber, in which it was placed in a restraining foam cushion. The cushion was placed in a cradle mounted on a custom-made stereotaxic instrument (Schuller et al., 1986). A small metal rod was cemented to the skull and then attached to a bar mounted on the stereotaxic instrument to ensure a uniform and stable positioning of the head. A ground electrode was placed between the reflected muscle and the skin. A multibarreled electrode was positioned over the IC under visual guidance using a dissecting microscope. The electrode was subsequently advanced through the brain from outside of the recording chamber using a piezoelectric microdrive (model 6000; Burleigh Instruments, Fishers, NY). Recordings were begun after the bats recovered from the anesthetic as judged by response to gentle touch. Surgical recording sessions lasted 5-8 h. Water was provided with a dropper, and local anesthesia was refreshed with Lidocaine every 1-2 h. Light doses of the anesthetic (35 mg/kg ketamine, 1 mg/kg xylazine) were given if the bat struggled or otherwise appeared in discomfort. If the bat continued to show signs of discomfort, recordings were terminated and the bat was returned to its cage. All experimental procedures were in accordance with a protocol approved by the University of Texas Institutional Animal Care and Use Committee.
Electrodes. Recordings were made with multibarreled electrodes in a “piggyback” configuration (Havey and Caspary, 1980). A five-barreled blank was pulled, and the tip was blunted to 10-15 μm. Recordings were made with a single-barreled micropipette glued to the multibarreled array so that the tip of the recording electrode was 10-20 μm from the blunted end of the multibarreled pipette. The recording electrodes had resistances of 8-15 MΩ. The recording pipette and the central barrel of the multibarreled pipette were filled with 1 m NaCl, pH 7.4. The remaining barrels were filled with serotonin creatinine sulfate (20 mm in 200 mm NaCl, pH 4) or with carrier vehicle (200 mm NaCl, pH 4). The barrels of the multibarreled pipette were connected via silver-silver chloride wires to a six-channel microiontophoresis constant-current generator (Neurophore BH-2; Medical Systems, Greenvale, NY). The central barrel was used to eject sum current, to minimize direct effects of the iontophoresis current on the recorded neuron. When a drug was not being iontophoresed, a retention current of -15 nA was applied to each drug barrel to prevent leakage. The recording electrode was connected via a silver-silver chloride wire to a Dagan (Minneapolis, MN) alternating-current amplifier (model 2400).
Acoustic stimulation, processing of spike trains, and iontophoresis. At the start of each experiment, a loudspeaker was placed in the ear contralateral to the side from which recordings were made. The loudspeaker was either a  inch Brüel & Kjær (Norcross, GA) microphone biased with 200 V of direct current and driven as a speaker or a custom-made earphone (Schuller, 1997). The Brüel & Kjær loudspeaker was flat within ±5 dB from 18 kHz to at least 60 kHz. The custom-made earphone had a frequency response that was flat ±6 dB from 10-110 kHz, with harmonic distortions at least 34 dB below the fundamental frequency. The Brüel & Kjær loudspeaker with the windscreen attached or the custom earphone were inserted into the funnel formed by the bat's pinna and positioned adjacent to the external auditory meatus. The pinna was folded over the housing of the loudspeaker and wrapped with Scotch tape. The binaural crosstalk with this arrangement was attenuated by 35-40 dB. Auditory stimuli consisted of tones generated by custom-made software and hardware (Carl Resler, University of Texas, Austin, TX) presented in the contralateral ear. Tones were 0.5 ms in rise time, 5-20 ms in duration, and were presented at a repetition rate of four per second. A total of 145 neurons were recorded from 59 bats. For 64 neurons, tones were presented at best frequency and varied in intensity from threshold to 40-60 dB above threshold. For 70 neurons, tones varied in frequency to encompass the entire excitatory ranges of the neurons.
Neural traces recorded through the extracellular amplifier were enhanced (spike signal enhancer; Frederick Haer Company, Bowdoinham, ME) before being digitized into the custom software (Carl Resler). Only single neurons with signal-to-noise ratios of 10 or higher were analyzed. Spikes were fed to a window discriminator and then to a Macintosh (Apple Computers, Cupertino, CA) 7100 computer controlled by a real-time clock. Peristimulus time histograms (PSTHs) and rate-level functions were generated from the discharges evoked by 20 presentations of a signal at a fixed intensity. A neuron was considered to respond to a sound if it fired at least five action potentials to these 20 presentations. Only neurons that responded to sound in both the control pre-serotonin and serotonin conditions were analyzed for changes in spike latency.
To ensure that the responses of the neurons to sound remained stable over time, repeated measurements were taken of the responses by neurons to tones at best frequency before serotonin iontophoresis. Neurons with unstable response latencies or unstable spike counts over time were rejected from the data set. After the acquisition of control data, serotonin was iontophoretically applied. Iontophoresis current ranged from 25 to 90 nA, values that induced maximal serotonergic effects on spike count in previous studies (Hurley and Pollak, 1999, 2001). Current never exceeded 90 nA to minimize the possibility of direct effects of the current on neuronal responses. How the concentration of serotonin ejected by these currents compares with endogenously released serotonin has not been measured, but these levels of iontophoretic current are near the upper end of the dynamic range of serotonin responsiveness for many IC neurons (Hurley and Pollak 2001).
During serotonin application, responses to tones were monitored until spike counts stabilized, usually 3-10 min. Once spike counts were stable, the same stimuli were presented again, and responses were obtained for comparison with control pre-serotonin responses. The ejection current was then switched off and retention current was reapplied. If contact with the neuron was maintained, recovery data were obtained by presenting the same suite of stimuli until the responses were similar to those obtained before serotonin was applied. Neurons typically recovered within 5-15 min. To control for effects of the drug carrier saline (200 mm NaCl) and of iontophoresis current, the carrier was iontophoresed onto a group of 23 neurons onto which serotonin was also iontophoresed. Although the iontophoresis of serotonin significantly changed the first-spike latencies of some of these neurons, iontophoresis of the carrier did not significantly change the latencies of any.
Measurement and statistical analysis. High levels of spontaneous activity could potentially interfere with correctly determining the latency of a first spike. Thus, although the incidence of spontaneous activity with our recording configuration is low (Hurley and Pollak, 1999), we additionally excluded neurons that showed spontaneous activity of >12 spikes/100 ms in 20 stimulus presentations. This rendered the latencies of the first spikes unambiguous, allowing us to measure latency directly and also to obtain measures of variance in latency. Latencies were calculated as the mean ± SEM latency to the first spike in response to 20 presentations of a given auditory stimulus. Whether serotonin significantly affected the mean latency of each neuron was determined by using unpaired t tests to compare the latency of the neuron to the 20 stimulus presentations in the control pre-serotonin condition with its latency to the 20 stimulus presentations in the presence of serotonin. First-spike latencies during serotonin iontophoresis were required to be significantly different from two measurements of latency taken at different time points before iontophoresis to be considered significant. This criterion excluded neurons with unstable latencies over time. Median first-spike latencies were examined in addition to mean latencies in all neurons recorded. For the great majority of neurons, serotonin altered median first-spike latencies in the same way that it altered mean first-spike latencies. The effects of serotonin on mean latency as measured with a t test and on median latency as measured with a two-sample Wilcoxon's test (Mann-Whitney U test) reached the same criterion for significance (p < 0.05) in 90.5% of neurons.
The precision of spike latency was measured as the coefficient of variation (CV) [(SD/mean) × 100, in percent] of spike count over the 20 stimulus presentations, and F tests were used to measure the significance of serotonergic effects on spike variance for each neuron before versus during serotonin iontophoresis. The significance of correlations between different response properties was measured with multiple regression analyses. Statistical tests were performed in either Microsoft Excel (Microsoft, Redmond, WA) or Statistica (StatSoft, Tulsa, OK).
To determine whether anesthetic state altered the effects of serotonin, 106 neurons were grouped into two categories based on whether the bat had received a dose of anesthetic within the last 2 h (n = 41) or not (n = 65). The latencies of these groups were not significantly different (p = 0.45, two-tailed unpaired t test), an unsurprising result given the wide range of latencies found within the IC. In addition, the effects of serotonin on the mean latencies of neurons did not differ between these groups (p = 0.89, two-tailed unpaired t test).
Results
Serotonin changes first-spike latencies of IC neurons
Latencies of 145 neurons were recorded at depths within the IC ranging from 186 to 1891 μm. The characteristics of the 145 neurons sampled matched those seen in other studies of the IC of the Mexican free-tailed bat and other mammals (Bodenhamer and Pollak, 1981; Park et al., 1998). Best frequencies ranged from 10.5 to 48.5 kHz, but 73.8% of neurons (107 of 145) had best frequencies falling between 20 and 30 kHz. Latencies were measured as the time between the stimulus onset and the first spike of the response (first-spike latency) at best frequency, 10-20 dB above the threshold. The first-spike latencies of responses to 20 identical stimulus presentations were averaged to obtain a value for each neuron. Control pre-serotonin latencies for each neuron ranged from 5.04 to 28.41 ms, but most neurons had latencies in the lower part of this range, so that the mean latency for the entire population of IC neurons was 11.22 ± 0.41 ms (Fig. 1A). Such a wide range is typical of IC neurons in the free-tailed bat and in other species (Bodenhamer and Pollak, 1981; Klug et al., 2000, Syka et al., 2000). Latency varied with recording depth, such that neurons recorded at shallower depths along the dorsoventral axis of the IC had longer latencies (multiple regression, p < 0.01; r2 = 0.24) and also exhibited a greater range of latencies than neurons deeper in the dorsoventral axis (Fig. 1B). Similar patterns of latency variation with either recording depth or best frequency have been reported previously in the IC (Park and Pollak, 1993; Haplea et al., 1994; Hattori and Suga, 1997; Ferragamo et al., 1998).
Figure 1.

Control latencies of recorded neurons. A, Numbers of neurons with different mean first-spike latencies. IC neurons show a wide range of latencies, although most latencies are under 15 ms. B, First-spike latencies vary with recording depth, with neurons showing a wider range of latencies at shallower depths (p < 0.01; r2 = 0.24).
Serotonin iontophoresis changed latencies in 24.1% (35 of 145) of neurons (two-tailed unpaired t tests, p < .05), but iontophoresis of control saline did not significantly change latency in any neuron (n = 23; two-tailed unpaired t tests, p > 0.05). A majority of the 35 neurons whose latencies were shifted (29 of 35, 82.9%) had longer latencies in serotonin, and a minority (6 of 35, 17.1%) had shorter latencies. Figure 2 shows examples of neurons for which serotonin increased and decreased latencies. Figure 2A shows PSTHs and raster displays of a neuron whose mean latency was significantly increased from 8.25 to 11.5 ms by serotonin. The latency of the neuron partly recovered to 9.1 ms when serotonin iontophoresis was halted. This value was significantly different from the serotonin latency but not significantly different from the control pre-serotonin latency. Figure 2B shows a similar plot for a neuron displaying a significant serotonin-evoked decrease in mean latency from 11.83 to 9.25 ms. The neuron in Figure 2B was not held for long enough to obtain a recovery.
Figure 2.

Two neurons showing opposite changes in first-spike latency. A, PSTH and raster plot data of a neuron whose latency was increased in the presence of serotonin. Plots show responses in the pre-serotonin condition (control), in the presence of serotonin, and after cessation of serotonin iontophoresis (recovery). For this neuron, serotonin also decreased the spike count. B, PSTH and raster plot data of a neuron whose latency was decreased in the presence of serotonin. The spike counts of this neuron were not greatly altered by serotonin. For both neurons, black squares denote first spikes, and gray squares denote subsequent spikes. Latency values refer to the mean ± SE first-spike latencies.
Figure 3 illustrates population trends in serotonergic effects on latency. Figure 3A plots the cumulative proportion of neurons with different latency shifts for neurons with significant serotonin-evoked changes in latency (open triangles) versus shifts in neurons without serotonin-evoked changes in latency, for comparison (filled squares). Although the curve for nonshifting neurons has its greatest slope near zero latency shift, as expected, the slope of the curve for neurons with significant latency shifts is displaced. At the positive values indicating latency increases, the curve is shifted to the right, indicating that most of the neurons with serotonin-evoked latency shifts showed increases to longer latencies, as described above. A smaller displacement occurs in the region of latency decreases, indicating the smaller number of neurons with shorter latencies in serotonin. Figure 3B illustrates how serotonin changed the distribution of latencies in the population by plotting the cumulative proportion of neurons with different latencies in 1 ms bins, in the control (open bars) versus serotonin (filled bars), for all neurons showing significant latency changes. In serotonin, the curve is shifted to the right, indicating that latencies shifted to later times across the population. The mean latency increase in this group was 0.84 ms (p < 0.01, two-tailed paired t test).
Figure 3.

Population effects of serotonin on first-spike latencies. A, Cumulative proportions of serotonin-evoked latency shifts in neurons without significant latency shifts (filled squares) versus neurons with significant latency shifts (open triangles). The plot for neurons without latency shifts has the steepest slope around zero. In contrast, the plot of neurons showing significant latency changes is displaced to the right, indicating the high number of neurons showing latency increases. A smaller displacement also occurs to the left at latency decreases of 1-2 ms, indicating the smaller number of neurons showing latency decreases in serotonin. B, Cumulative proportions of neurons with different latencies in the control (open bars) versus serotonin (filled bars) for neurons showing significant latency changes. The cumulative proportion of neurons in the presence of serotonin is displaced to later time bins than in the control. Serotonin shifted latency by 0.84 ms later on average.
To determine whether latency increases and decreases occurred in neurons with different response properties, we compared the size of serotonergic effects on latency with the (1) control latency, (2) best frequency, and (3) recording depth, in the 35 neurons whose latencies were shifted by serotonin. Figure 4 shows plots of the absolute values of serotonin-evoked changes in latency versus these three variables. In Figure 4A, although it seems as though neurons with longer control latencies also show larger latency shifts, the correlation between these values was not significant (r = 0.35; p = 0.35). There was also no significant correlation between the absolute value of serotonin-evoked latency shifts and best frequency (Fig. 4B) (p = 0.16) or depth (Fig. 4C) (p = 0.27).
Figure 4.

Correlation plots of the magnitude of serotonin-evoked changes in latency expressed as: absval ((5-HT latency - control latency)/control latency) versus control latency (A), best frequency (BF; B), and recording depth (C). Absval, Absolute value.
Serotonin alters spike precision
In addition to spike latency, the precision of spike timing is an important temporal response feature of auditory neurons (Covey and Casseday, 1991; Golding et al., 1995). Hence, in addition to examining first-spike latency, we measured the CV, the SD of the latency divided by the mean latency (in percent), of first spikes. Similar to first-spike latency, the CV ranged widely between different IC neurons, from 1.3 to 42.2%. However, unlike latency, the CV was not significantly correlated with recording depth (r = .004; p = 0.648) or best frequency (r = -0.07; p = 0.382) across the population of neurons. The effects of serotonin on the precision of spikes did not parallel those on first-spike latency. Serotonin significantly changed the variance of first spikes in only 12.4% (18 of 145) of neurons, as judged by two-tailed F tests. Serotonin-evoked changes in the variance were also more equally divided between increases and decreases than serotonin-evoked changes in latency, with nine neurons showing increases in variance and seven neurons showing decreases in variance. Figure 5 shows an example of each type of neuron. Figure 5A illustrates a neuron that decreased the CV in the timing of its first spikes in response to serotonin. For the neuron in Figure 5A, the decrease in CV was accompanied by an apparent increase in mean latency, but this latency change was not statistically significant. Figure 5B shows a neuron that responded to serotonin with an increase in the first-spike CV but also without a significant change in mean first-spike latency. Figure 6 plots the cumulative changes in CV for all 145 neurons in a plot similar to the cumulative plot of latency shifts in Figure 3A. As described above, changes in variance were fairly evenly distributed between increases and decreases, as demonstrated by the deflections of the line representing neurons with serotonin-evoked CV shifts (open triangles) relative to neurons without serotonin-evoked CV shifts (filled squares). A comparison of Figures 6 and 3A shows that serotonin-evoked changes in first-spike latency and in first-spike variance did not reflect each other in the population of neurons we recorded.
Figure 5.

Serotonin alters the precision of first spikes. A, PSTH and raster plots of a neuron whose first-spike CV decreased in the presence of serotonin and recovered after serotonin iontophoresis was stopped. B, A neuron whose first-spike CV increased in the presence of serotonin and recovered after serotonin iontophoresis was stopped.
Figure 6.

Cumulative proportions of serotonin-evoked CV shifts in neurons without significant CV shifts (filled squares) versus neurons with significant CV shifts (open triangles). The plot of neurons showing significant CV changes is displaced relative to the control plot in the direction of both CV increases and decreases, indicating that approximately the same numbers of neurons showed CV increases and decreases in the presence of serotonin.
The effects of serotonin on latency versus spike count and interspike interval
In several studies, neuromodulator-induced changes in first-spike latency have been inversely associated with changes in response strength. Thus, decreases in latency occur in conjunction with increases in spike count or firing rate, and increases in latency occur in conjunction with decreases in spike count or firing rate (Bras et al., 1989; Jankowska et al., 1995, 1998; Saruhashi et al., 1997; Hammar et al., 2002; Shay and Hochman, 2002). Such coordinated changes in multiple response properties could indicate a mechanism that changes general neural responsiveness. To determine whether this type of association also occurs in the IC, we compared the effects of serotonin on first-spike latency and on spike count or interspike interval. As shown in Figure 7, there was a weak correlation between the effects of serotonin on latency and spike count across the population of IC neurons whose latencies were shifted by serotonin. For many neurons, spike count decreases and latency increases occurred together, and spike count increases and latency decreases also occurred together. This relationship was significant for the 35 neurons displaying significant effects of serotonin on latency (p = 0.008; r2 = -0.19), which supports the hypothesis that serotonin-evoked changes in spike count and latency could be related to each other through changes in neuron excitability. However, for some neurons, serotonin-evoked changes in latency and spike count did not concur, as exemplified by the two neurons in Figure 7B. For the neuron on the left, serotonin induced a latency increase but no change in spike count. For the neuron on the right, serotonin did not induce a latency change but did decrease spike count by eliminating later spikes but not earlier spikes. For all neurons recorded, serotonin significantly changed both spike count and latency in 15, only changed latency in 20, and only changed magnitude in 32 (two-tailed unpaired t tests). The disjunction between serotonergic effects on latency and spike count in many of these neurons demonstrates that serotonergic effects on latency are not always associated with overall changes in response strength.
Figure 7.

Relationship between serotonin effects on first-spike latency and spike count. A, Plot of serotonin-evoked latency changes versus normalized spike count changes in neurons with significant changes in latency. Open squares represent single neurons depicted in B. B, Two neurons that do not show a correlation between serotonin-evoked changes in first-spike latency and spike count. The neuron on the left increased in latency in the presence of serotonin but had similar numbers of both first spikes and all spikes in the control and in the presence of serotonin. The neuron on the right decreased its spike count in serotonin but showed little change in its first-spike latency.
To further examine the issue of correlated effects of serotonin on latency and other temporal response properties, we measured the effects of serotonin on interspike interval in a group of 40 neurons that responded with multiple spikes to the relatively brief stimuli we administered, analyzing the interval between the first and second spike. Just as for latency, serotonin increased the interspike interval in some neurons and decreased it in others. Of the 40 neurons recorded, first-spike latency increased in seven. A typical example is seen in Figure 8A, which plots the first-spike latency versus interspike interval for each of 20 stimulus presentations. For this neuron, the presence of serotonin did not simply cause an increase in first-spike latency but also a coordinated increase in the interspike interval and variance. Of the seven neurons showing serotonin-evoked increases in latency, the interspike interval also increased significantly in five. Such coordinated effects were not seen in another five neurons of our sample of 40 that decreased their latencies in the presence of serotonin. Of these five neurons, one of which is plotted in Figure 8B, the interspike interval did not significantly change in four. Thus, of all of the 12 neurons of the sample of 40 that showed serotonin-evoked latency changes, six also showed interspike interval changes, but six did not. Two neurons of our sample of 40 also showed increases in interspike interval without accompanying changes in latency or variance. The effects of serotonin on latency versus interspike interval for all 14 neurons showing significant changes in either of these variables is shown in Figure 8C. Note the lack of correlation between serotonin-evoked latency and interspike interval changes, which is partly attributable to the absence of decreases in interspike interval in neurons with latency decreases. This suggests that serotonin may act through different mechanisms to increase latency and interspike interval in some neurons and to decrease latency alone in other neurons.
Figure 8.

Serotonin changes interspike interval. A, Plot of latency versus the interval between the first and second spike for multiple tone presentations to a single neuron. Values for responses to single tone presentations are shown in the control (filled squares) and in the presence of serotonin (open circles). For this neuron, serotonin increased the interspike interval (ISI) and variance in conjunction with first-spike latency. B, A second neuron for which serotonin decreased the average first-spike latency but did not decrease the interspike interval. C, Serotonin-evoked changes in mean interspike interval versus mean first-spike latency in neurons for which serotonin significantly increased latency (gray diamonds; n = 7), significantly decreased latency (black diamonds; n = 5), or changed interspike interval without changing latency (gray circles; n = 2). The letters A and B denote neurons detailed in A and B, respectively.
Of additional interest are several neurons with great regularity in their interspike intervals (Fig. 9). For neuron 1 in Figure 9, serotonin evoked a complex set of changes in the spiking pattern as seen in both the plot of first-spike latency versus interspike interval (left) and in the raster plot (right). Serotonin caused a clear increase in the first-spike latency and also decreased the spike count, by decreasing the number of cycles during which the neuron fired. At the same time, serotonin increased the precision of the first spike by making the neuron more likely to fire on the first cycle but did not change the interspike interval, at least between the first and second spike. The three values of interspike interval that are exceptionally high in the presence of serotonin are the result of spikes skipping the second cycle and firing during the third. However, neuron 2 in Figure 9, which also fired regularly in the control, was affected differently by serotonin. Although serotonin likewise increased the latency and decreased the spike count, the firing pattern became more irregular, and the first spike occurred over a greater range of latencies. These results emphasize the fact that serotonin may have divergent effects even on neurons with similar initial temporal response properties.
Figure 9.
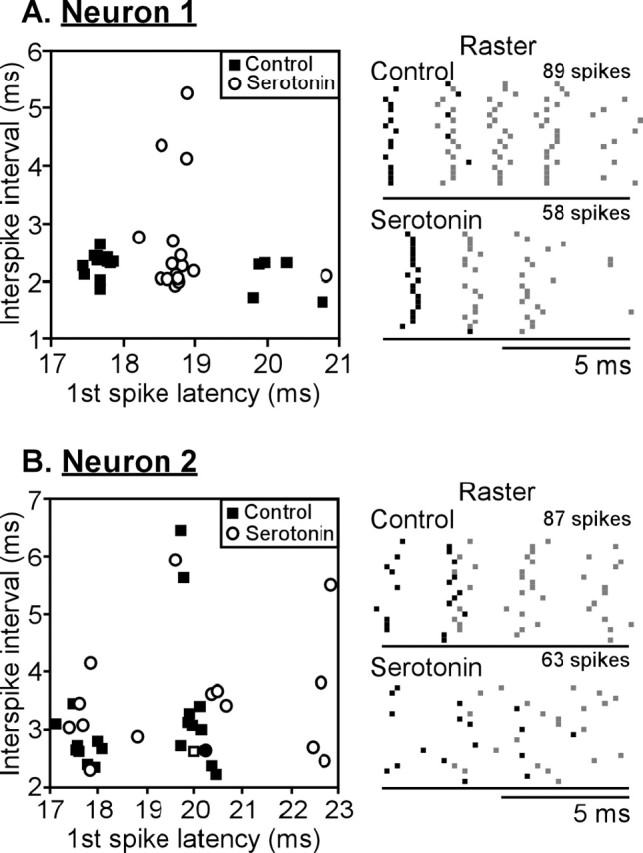
Plots of latency versus interspike interval (left), along with corresponding raster plots (right), for two neurons with regular trains of spikes. A, In the presence of serotonin, the first-spike latencies of neuron 1 were delayed but were more likely to occur in a similar time bin than in the control. Although serotonin caused neuron 1 to fire fewer spikes, the spikes still occurred in regular intervals. B, For neuron 2, serotonin also increased the first-spike latency but decreased the regularity of all spikes.
Serotonergic effects on latency are stimulus dependent
Because the latencies of IC neurons vary with stimulus intensity and frequency and because the effects of serotonin on spike count may vary with these stimulus properties (Hurley and Pollak 2001), we examined whether the effects of serotonin on latency are also influenced by stimulus intensity and frequency.
Latency versus intensity
For 64 of our sample of 145 neurons, we examined the effects of serotonin on the relationship between sound intensity and first-spike latency over a range of at least 40 dB in 10 dB increments. Serotonergic effects were intensity dependent for eight neurons of this sample of 64 (12.5%) but were independent of intensity for another eight neurons. Figure 10 shows examples of both of these types of neurons. Figure 10A shows a neuron whose control response latency decreased with increasing sound intensity steadily from 10-60 dB, resulting in a negatively sloped plot. Serotonin increased latencies at all sound intensities for this neuron, displacing the curve upward but not changing its shape. For this neuron, the effects of serotonin did not depend on the sound intensity. The PSTH plots below show the small but consistent changes in latency at 20 and 50 dB. The neuron in Figure 10B shows a different effect of serotonin on the latency-intensity function. Initially, this neuron had a relatively constant relationship between intensity and latency. Serotonin increased the latencies at lower but not at higher sound intensities, resulting in latencies that decreased markedly with increasing intensity. The PSTHs illustrate the latency change that serotonin caused at 30 dB but not at 60 dB.
Figure 10.

Dependence of the effect of serotonin on stimulus intensity. A, Neuron for which serotonin-evoked latency shifts were similar at all intensities. At top, a plot of first-spike latency versus stimulus intensity in the control (filled squares) and in the presence of serotonin (open circles) shows approximately equal serotonin-evoked latency increases at all intensities tested. Below are PSTH plots of responses at 20 and 50 dB. B, Neuron for which serotonin-evoked latency shifts varied with stimulus intensity. At top, a plot of first-spike latency versus stimulus intensity in the control and in the presence of serotonin shows larger serotonin-evoked latency increases at lower intensities. Below are PSTH plots of responses at 30 and 60 dB.
Latency versus frequency
To determine whether serotonin-evoked latency shifts also vary with frequency, we measured serotonergic effects on the latencies of responses in a cross-section of the tuning curve at 10-20 dB above threshold in a group of 70 neurons. Within this group of 70 neurons, serotonin had similar effects at all frequencies in 12 (17.1%). An example of such a neuron is shown in Figure 11A, which at top plots the latencies of a single neuron across its excitatory frequency range, before and during serotonin iontophoresis. For this neuron, serotonin increased the mean latency, and the increase was similar at all frequencies to which the neuron responded. The PSTHs of responses to two of these frequencies, marked by arrows, are shown at the bottom of Figure 11A. For responses at each of these frequencies, the latency change was close to 2 ms. For this neuron, the latency increases were also accompanied by spike count decreases.
Figure 11.

Dependence of the effect of serotonin on stimulus frequency. A, Neuron for which serotonin-evoked latency shifts were similar at all frequencies. At top, a plot of first-spike latency versus stimulus frequency in the control (filled squares) and in the presence of serotonin (open circles) shows approximately equal serotonin-evoked latency increases at all frequencies tested. Below are PSTH plots of responses at 23.5 and 25.5 kHz. B, Neuron for which serotonin-evoked latency shifts varied with stimulus frequency. At top, a plot of first-spike latency versus stimulus frequency in the control and in the presence of serotonin shows larger serotonin-evoked latency increases at lower frequencies. Below are PSTH plots of responses at 41.5 and 51.5 kHz.
For 9 of the 70 neurons (12.9%), serotonin had frequency-selective effects, in that serotonin significantly changed the latencies of responses to some frequencies but not to others, in a systematic way across frequencies. A neuron with frequency-selective effects is presented in Figure 11B. In the control, latencies increased steadily with increasing stimulus frequency. However, during serotonin iontophoresis, the latencies were sharply increased at the lowest frequencies, moderately increased at a few middle frequencies, and altered very little at the highest frequencies. The resultant relationship between frequency and latency is more V-shaped than straight. Arrows mark responses at frequencies that are plotted beneath as PSTHs. At 41.5 kHz, serotonin had a significant effect on latency, lengthening it from 13.85 to 15.32 ms. In contrast, at 51.5 kHz, the small increase in latency from 15.17 to 15.39 ms was not statistically significant. It is also interesting to note that neither the significant nor the nonsignificant latency changes in this neuron were accompanied by changes in spike count. Thus, a plot of frequency versus spike count would not reveal any effect of serotonin on this neuron. In addition, although the measurement of latency at best frequency for this neuron, 43.5 kHz, would reveal an effect of serotonin, latency measurements at best frequency would not do so in all frequency-selective neurons. Thus, we potentially under-estimated the number of IC neurons for which serotonin changes latency, by measuring latencies only at best frequency in some neurons.
Discussion
How neuromodulators influence the response latencies of sensory neurons is a subject that is poorly understood. In the auditory system, response latency is integral to the extraction of behaviorally relevant information from sound and to the construction of appropriate auditory responses from the convergence of excitatory and inhibitory inputs. The serotonin-evoked changes in temporal structure we observed in the IC bring the list of fundamental response properties affected by serotonin to four: (1) the magnitude (spike count), (2) the timing (first-spike latency), (3) the temporal precision (variation of first-spike latency), and (4) the interspike interval of responses. Below, we discuss potential mechanisms for the effects of serotonin on latency and other response properties and speculate on the functional consequences of these serotonin-evoked changes.
Mechanisms
Assigning a mechanism for the effects of serotonin we observed is complicated by several issues. The first is the large palette of effects of serotonin, which includes but is not limited to alterations in transmitter release, the responsiveness of postsynaptic ligand-gated receptors, and the size and kinetics of postsynaptic voltage-gated conductances (Huang et al., 1993; Mooney et al., 1996; Yan, 2002). A second issue is that many of the response properties we measured can be influenced by both presynaptic and postsynaptic mechanisms. The technique we used, extracellular recording in vivo, does not allow us to distinguish among these mechanisms. As an example of how some of the serotonergic effects we observed could be attributable to either modulation of synaptic activity or modulation of intrinsic conductances, we consider the neurons represented in Figure 2. In the presence of serotonin, the neuron in Figure 2A showed a combined increase in latency and interspike interval and a decrease in spike count. This coordinated suite of changes in spike timing and number is something that could result from augmentation of a long-lasting outward conductance of a type that has been directly measured or blocked in some classes of IC neurons (Sivaramakrishnan and Oliver, 2001; Zhang et al., 2004). However, such general decreases in excitability could also result from declining strengths of excitatory inputs or increased tonic inhibitory inputs, because broad changes in responsiveness can also result from altering the balance of inhibitory and excitatory transmission (Yang et al., 1992; Pollak and Park, 1993; Zhang and Kelly 2001). For the neuron in Figure 2B, the effect of serotonin was limited to the early part of the response of the neuron. Serotonin advanced the spikes to an earlier time point, with a slight increase in the spike count, but no change in the interspike interval or first-spike variance. This selective change is consistent with serotonin either decreasing an early inhibitory input that influences latency in many IC neurons (Covey et al., 1996; Oswald et al., 1999; Galazyuk and Feng, 2001; Galazyuk et al., 2005) or decreasing an early transient A-type current that determines latency in other auditory nuclei (olivocochlear neurons, Fujino et al., 1997; Adam et al., 1999; dorsal cochlear nucleus pyramidal neurons, Kanold and Manis, 1999) and is a serotonergic target in Purkinje cells (Wang et al., 1992).
However, specific sites of action of serotonin are supported by several pieces of evidence, including the stimulus dependence of serotonergic effects. In neurons for which serotonergic effects are limited to the responses to specific frequencies or intensities (Figs. 10, 11), it seems likely that serotonin modulates transmitter release by neurons contributing inputs that are specific to the altered responses. In addition, something that argues that at least some of the effects of serotonin are attributable to modulation of inhibitory transmission is the association of serotonin and GABA in the IC. Both GABAergic puncta (Winer et al., 1995) and serotonergic fibers and varicosities (Klepper and Herbert, 1991; Hurley and Thompson, 2001) are denser in the dorsal region of the IC, in which neurons whose longer latencies are shaped by inhibition are preferentially found (Park and Pollak, 1993). More directly, approximately two-thirds of GABAergic neurons are associated with serotonin receptors in the IC (Peruzzi and Dut, 2004). In light of all of these considerations, we judge it highly likely that the changes in response properties that we observe arise from both synaptic and intrinsic mechanisms, potentially operating on the same neurons.
Functional consequences
A leading hypothesis on the functional significance of serotonin in sensory systems is that serotonin shapes sensory activity according to behavioral state. This hypothesis is based on the activity patterns of the serotonergic neurons that innervate many sensory regions of the brain, including the auditory brainstem (Klepper and Herbert, 1991). These serotonergic neurons, found mostly within the dorsal and median raphe nuclei, have their highest levels of activity in awake and alert animals but are less active in sleeping or inattentive animals (Trulson and Jacobs, 1979; Heym et al., 1982; Trulson and Trulson, 1982; Waterhouse et al., 2004). There is corresponding evidence across multiple sensory systems that serotonin alters sensory circuitry in highly selective ways that promote the extraction of features of sensory stimuli (for review, see Hurley et al., 2004).
Neurophysiological findings from the inferior colliculus likewise demonstrate that serotonin refines the representation of acoustic stimuli. In the free-tailed bat, serotonin increases the selectivity of many neurons for species-specific communication and echolocation calls (Hurley and Pollak, 2005). Extrapolated across the neuron population, the responses to many calls become more specific and unambiguous in the presence of serotonin. Similar patterns of the suppression of responses elicited by some stimuli and the facilitation of others can result from a number of neural mechanisms and have been viewed as an increase in the signal-to-noise ratio of neuron populations. These types of sensory filtering mechanisms are triggered by several phenomena that pertain to behavioral state, such as corticofugal feedback (Yan and Suga, 1996; Zhang et al., 1997), reticular stimulation to simulate arousal (Castro-Alamancos, 2002), or the direction of attention (Martinez-Trujillo and Treue, 2004). The effects of serotonin on latency in the IC follow a similar pattern. That is, although the majority of latencies that are sensitive to serotonin are shifted later, to temporal windows less proximal to the onset of the stimulus, the latencies of a few are shifted closer to stimulus onset (Fig. 3A).
One role of latency within the IC and its ascending targets is to gate the integration of inputs that carry information about related sounds, such as the inputs from different ears that signal the location of auditory stimuli (Brugge et al., 1969; Pollak, 1988; Park, 1998). In some echolocating bats, the wide range of latencies of IC neurons are also thought to serve as a potential source for calculating convergent maps of the delay between echolocation sweeps and returning echoes, a feature corresponding to target range (Kuwabara and Suga, 1993; Park and Pollak, 1993; Hattori and Suga, 1997). How serotonin would alter the representation of such behaviorally important stimulus features is unclear, primarily because we did not observe systematic changes in latency within any functionally distinct group of neurons, such as neurons with particular control latencies. This is likely to reflect the diverse roles of serotonin, acting through multiple receptor types, within the IC (Chalmers and Watson, 1991; Pompeiano et al., 1992; Thompson et al., 1994; Waeber et al., 1994; To et al., 1995; Wright et al., 1995; Harlan et al., 2000; Hurley et al., 2002; Peruzzi and Dut, 2004).
Latency may also encode features of sensory stimuli such as frequency or intensity, making the fact that, in some neurons, serotonin altered spike timing independently of other response properties, an intriguing feature of our results. For example, for the neuron in Figure 11B, serotonin lengthened latencies but did not change spike count at low but not high frequencies within the receptive field of the neuron. Likewise, for the neuron in Figure 9A, serotonin increased the precision of the first spike relative to stimulus onset while decreasing the magnitude of the response. These selective changes are of interest because spike timing and spike count can differentially represent features of sensory stimuli. In striate cortex, spike latency varies with stimulus contrast far more than spike count, whereas spike count varies with stimulus orientation (Gawne et al., 1996; Reich et al., 2001; Oram et al., 2002). In auditory cortical region A2, the latencies of first spikes carry more information about stimulus location than does spike count, especially for a small number of stimulus repetitions (Furukawa and Middlebrooks, 2002). Thus, the finding that serotonin differentially modulates the timing and number of spikes raises the possibility that, if different response properties correspond to different stimulus features in the IC, serotonin may differentially alter parallel stimulus-encoding strategies. For example, for the neuron in Figure 11B, the shortest latencies were associated with the lowest frequencies before serotonin addition, but serotonin caused the shortest spike latencies to become more closely associated with best frequency and more in register with the pattern of changes in spike count.
In conclusion, the selective ways that serotonin shapes latency within the IC are consistent with the emerging picture of serotonin as a selective and state-dependent filter on auditory information ascending through the IC.
Footnotes
This work was supported in part by National Institute on Deafness and Other Communication Disorders Grants DC00391 and DC01058. We thank C. Resler for technical support, Dr. G. T. Smith for helpful comments on this manuscript, and Dr. R. R. de Ruyter van Steveninck for helpful suggestions.
Correspondence should be addressed to Laura M. Hurley, Biology Department, Indiana University, 1001 East Third Street, 242 Jordan Hall, Bloomington, IN 47405. E-mail: lhurley@bio.indiana.edu.
Copyright © 2005 Society for Neuroscience 0270-6474/05/257876-11$15.00/0
References
- Adam TJ, Schwarz DWF, Finlayson PG (1999) Firing properties of chopper and delay in the lateral superior olive of the rat. Exp Brain Res 124: 489-502. [DOI] [PubMed] [Google Scholar]
- Aitkin L, Anderson D, Brugge J (1970) Tonotopic organization and discharge characteristics of single neurons in nuclei of the lateral lemniscus of the cat. J Neurophysiol 33: 421-440. [DOI] [PubMed] [Google Scholar]
- Barsz K, Benson P, Walton J (1998) Gap encoding by inferior collicular neurons is altered by minimal changes in signal envelope. Hear Res 115: 13-26. [DOI] [PubMed] [Google Scholar]
- Bauer E, Klug A, Pollak G (2000) Features of contralaterally evoked inhibition in the inferior colliculus. Hear Res 141: 80-96. [DOI] [PubMed] [Google Scholar]
- Bodenhamer R, Pollak G (1981) Time and frequency domain processing in the inferior colliculus of echolocating bats. Hear Res 5: 317-335. [DOI] [PubMed] [Google Scholar]
- Bras H, Cavallari P, Jankowska E, McCrea D (1989) Comparison of effects of monoamines on transmission in spinal pathways from group I and II muscle afferents in the cat. Exp Brain Res 76: 27-37. [DOI] [PubMed] [Google Scholar]
- Brugge JF, Dubrovsky NA, Aitkin LM, Anderson DJ (1969) Sensitivity of single neurons in auditory cortex of cat to binaural tonal stimulation; effects of varying interaural time and intensity. J Neurophysiol 32: 1005-1024. [DOI] [PubMed] [Google Scholar]
- Castro-Alamancos M (2002) Role of thalamocortical sensory suppression during arousal: focusing sensory inputs in neocortex. J Neurosci 22: 9651-9655. [DOI] [PMC free article] [PubMed] [Google Scholar]
- Chalmers D, Watson S (1991) Comparative anatomical distribution of 5-HT1A receptor mRNA and 5-HT1A binding in rat brain—a combined in situ hybridisation/in vitro receptor autoradiographic study. Brain Res 561: 51-60. [DOI] [PubMed] [Google Scholar]
- Covey E, Casseday JH (1991) The monaural nuclei of the lateral lemniscus in an echolocating bat: parallel pathways for analyzing temporal features of sound. J Neurosci 11: 3456-3470. [DOI] [PMC free article] [PubMed] [Google Scholar]
- Covey E, Kauer J, Casseday J (1996) Whole-cell patch-clamp recording reveals subthreshold sound-evoked postsynaptic currents in the inferior colliculus of awake bats. J Neurosci 16: 3009-3018. [DOI] [PMC free article] [PubMed] [Google Scholar]
- Devilbiss D, Waterhouse B (2004) The effects of tonic locus ceruleus output on sensory-evoked responses of ventral posterior medial thalamic and barrel field cortical neurons in the awake rat. J Neurosci 24: 10773-10785. [DOI] [PMC free article] [PubMed] [Google Scholar]
- Faure P, Fremouw T, Casseday J, Covey E (2003) Temporal masking reveals properties of sound-evoked inhibition in duration-tuned neurons of the inferior colliculus. J Neurosci 23: 3052-3065. [DOI] [PMC free article] [PubMed] [Google Scholar]
- Ferragamo M, Haresign T, Simmons J (1998) Frequency tuning, latencies, and responses to frequency-modulated sweeps in the inferior colliculus of the echolocating bat, Eptesicus fuscus J Comp Physiol A Neuroethol Sens Neural Behav Physiol 182: 65-79. [DOI] [PubMed] [Google Scholar]
- Foffani G, Tutunculer B, Moxon K (2004) Role of spike timing in the fore-limb somatosensory cortex of the rat. J Neurosci 24: 7266-7271. [DOI] [PMC free article] [PubMed] [Google Scholar]
- Fujino K, Koyano K, Ohmori H (1997) Lateral and medial olivocochlear neurons have distinct electrophysiological properties in the rat brain slice. J Neurophysiol 77: 2788-2804. [DOI] [PubMed] [Google Scholar]
- Furukawa S, Middlebrooks J (2002) Cortical representation of auditory space: information-bearing features of spike patterns. J Neurophysiol 87: 1749-1762. [DOI] [PubMed] [Google Scholar]
- Fuzessery ZM, Hall JC (1996) Role of GABA in shaping frequency tuning and creating FM sweep selectivity in the inferior colliculus. J Neurophysiol 76: 1059-1073. [DOI] [PubMed] [Google Scholar]
- Galazyuk A, Feng A (2001) Oscillation may play a role in time domain central auditory processing. J Neurosci 21: RC147(1-5). [DOI] [PMC free article] [PubMed] [Google Scholar]
- Galazyuk A, Lin W, Llano D, Feng A (2005) Leading inhibition to neural oscillation is important for time domain processing in the auditory midbrain. J Neurophysiol 94: 314-326. [DOI] [PubMed] [Google Scholar]
- Gawne T, Kjaer T, Richmond B (1996) Latency: another potential code for feature binding in striate cortex. J Neurophysiol 76: 1356-1360. [DOI] [PubMed] [Google Scholar]
- Golding N, Robertson D, Oertel D (1995) Recordings from slices indicate that octopus cells of the cochlear nucleus detect coincident firing of auditory nerve fibers with temporal precision. J Neurosci 15: 3138-3153. [DOI] [PMC free article] [PubMed] [Google Scholar]
- Grothe B, Schweizer H, Pollak G, Schuller G, Rosemann C (1994) Anatomy and projection patterns of the superior olivary complex in the Mexican free-tailed bat, Tadarida brasiliensis mexicana J Comp Neurol 343: 630-646. [DOI] [PubMed] [Google Scholar]
- Grothe B, Park T, Schuller G (1997) Medial superior olive in the free-tailed bat: response to pure tones and amplitude-modulated tones. J Neurophysiol 77: 1553-1565. [DOI] [PubMed] [Google Scholar]
- Hammar I, Chojnicka B, Jankowska E (2002) Modulation of responses of feline ventral spinocerebellar tract neurons by monoamines. J Comp Neurol 443: 298-309. [DOI] [PubMed] [Google Scholar]
- Haplea S, Covey E, Casseday J (1994) Frequency tuning and response latencies at three levels in the brainstem of the echolocating bat, Eptesicus fuscus J Comp Physiol A Neuroethol Sens Neural Behav Physiol 174: 671-683. [DOI] [PubMed] [Google Scholar]
- Harlan R, Yuan Y, Garcia M (2000) Serotonin 5-HT2C receptors in central auditory pathways. ARO Abstr 23: 113. [Google Scholar]
- Hattori T, Suga N (1997) The inferior colliculus of the mustached bat has the frequency-vs-latency coordinates. J Comp Physiol A Neuroethol Sens Neural Behav Physiol 180: 271-284. [DOI] [PubMed] [Google Scholar]
- Havey D, Caspary D (1980) A simple technique for constructing “piggyback” multibarrel microelectrodes. Electroencephalogr Clin Neurophysiol 48: 249-251. [DOI] [PubMed] [Google Scholar]
- Heil P (2004) First-spike latency of auditory neurons revisited. Curr Opin Neurobiol 14: 461-467. [DOI] [PubMed] [Google Scholar]
- Heil P, Irvine D (1997) First-spike timing of auditory-nerve fibers and comparison with auditory cortex. J Neurophysiol 78: 2438-2454. [DOI] [PubMed] [Google Scholar]
- Heym J, Trulson M, Jacobs B (1982) Raphe unit activity in freely moving cats: effects of phasic auditory and visual stimuli. Brain Res 232: 29-39. [DOI] [PubMed] [Google Scholar]
- Huang X, Mooney RD, Rhoades RW (1993) Effects of serotonin on retinotectal-, corticotectal-, and glutamate-induced activity in the superior colliculus of the hamster. J Neurophysiol 70: 723-732. [DOI] [PubMed] [Google Scholar]
- Hurley L, Pollak G (1999) Serotonin differentially modulates responses to tones and frequency-modulated sweeps in the inferior colliculus. J Neurosci 19: 8071-8082. [DOI] [PMC free article] [PubMed] [Google Scholar]
- Hurley L, Pollak G (2001) Serotonin effects on frequency tuning of inferior colliculus neurons. J Neurophysiol 85: 828-842. [DOI] [PubMed] [Google Scholar]
- Hurley L, Pollak G (2005) Serotonin modulates responses to species-specific vocalizations in the inferior colliculus. J Comp Physiol A Neuroethol Sens Neural Behav Physiol 191: 535-546. [DOI] [PubMed] [Google Scholar]
- Hurley L, Thompson A (2001) Serotonergic innervation of the auditory brainstem of the Mexican free-tailed bat, Tadarida brasiliensis J Comp Neurol 435: 78-88. [DOI] [PubMed] [Google Scholar]
- Hurley LM, Thompson AM, Pollak GD (2002) Serotonin in the inferior colliculus. Hear Res 168: 1-11. [DOI] [PubMed] [Google Scholar]
- Hurley LM, Devilbiss DM, Waterhouse BD (2004) A matter of focus: monoaminergic modulation of stimulus coding in mammalian sensory networks. Curr Opin Neurobiol 14: 488-495. [DOI] [PubMed] [Google Scholar]
- Jankowska E, Krutki P, Läckberg ZS, Hammar I (1995) Effects of serotonin on dorsal horn dorsal spinocerebellar tract neurons. Neuroscience 67: 489-495. [DOI] [PubMed] [Google Scholar]
- Jankowska E, Gladden M, Czarkowska-Bauch J (1998) Modulation of responses of feline gamma-motoneurones by noradrenaline, tizanidine and clonidine. J Physiol (Lond) 512: 521-531. [DOI] [PMC free article] [PubMed] [Google Scholar]
- Kaiser A, Covey E (1997) 5-HT innervation of the auditory pathway in birds and bats. In: Acoustical signal processing in the central auditory system (Syka J, ed), pp 71-78. New York: Plenum.
- Kanold PO, Manis PB (1999) Transient potassium currents regulate the discharge patterns of dorsal cochlear nucleus pyramidal cells. J Neurosci 19: 2195-2208. [DOI] [PMC free article] [PubMed] [Google Scholar]
- Kitzes L, Gibson M, Rose J, Hind J (1978) Initial discharge latency and threshold considerations for some neurons in cochlear nuclear complex of the cat. J Neurophysiol 41: 1165-1182. [DOI] [PubMed] [Google Scholar]
- Klepper A, Herbert H (1991) Distribution and origin of noradrenergic and serotonergic fibers in the cochlear nucleus and inferior colliculus of the rat. Brain Res 557: 190-201. [DOI] [PubMed] [Google Scholar]
- Klug A, Bauer E, Pollak G (1999) Multiple components of ipsilaterally evoked inhibition in the inferior colliculus. J Neurophysiol 82: 593-610. [DOI] [PubMed] [Google Scholar]
- Klug A, Khan A, Burger R, Bauer E, Hurley L, Yang L, Grothe B, Halvorsen M, Park T (2000) Latency as a function of intensity in auditory neurons: influences of central processing. Hear Res 148: 107-123. [DOI] [PubMed] [Google Scholar]
- Kossl M, Vater M (1989) Noradrenaline enhances temporal auditory contrast and neuronal timing precision in the cochlear nucleus of the mustached bat. J Neurosci 9: 4169-4178. [DOI] [PMC free article] [PubMed] [Google Scholar]
- Kuwabara N, Suga N (1993) Delay lines and amplitude selectivity are created in subthalamic auditory nuclei: the brachium of the inferior colliculus of the mustached bat. J Neurophysiol 69: 1713-1724. [DOI] [PubMed] [Google Scholar]
- Kuwada S, Yin T (1983) Binaural interaction in low-frequency neurons in inferior colliculus of the cat. I. Effects of long interaural delays, intensity, and repetition rate on interaural delay function. J Neurophysiol 50: 981-999. [DOI] [PubMed] [Google Scholar]
- Leao R, Von Gersdorff H (2002) Noradrenaline increases high-frequency firing at the calyx of held synapse during development by inhibiting glutamate release. J Neurophysiol 87: 2297-2306. [DOI] [PubMed] [Google Scholar]
- Martinez-Trujillo J, Treue S (2004) Feature-based attention increases the selectivity of population responses in primate visual cortex. Curr Biol 14: 744-751. [DOI] [PubMed] [Google Scholar]
- Melssen W, Epping W, van Stokkum I (1990) Sensitivity for interaural time and intensity difference of auditory midbrain neurons in the grassfrog. Hear Res 47: 235-256. [DOI] [PubMed] [Google Scholar]
- Mooney R, Huang X, Shi M, Bennett-Clarke C, Rhoades R (1996) Serotonin modulates retinotectal and corticotectal convergence in the superior colliculus. Prog Brain Res 112: 57-69. [DOI] [PubMed] [Google Scholar]
- Oram M, Xiao D, Dritschel B, Payne K (2002) The temporal resolution of neural codes: does response latency have a unique role? Philos Trans R Soc Lond B Biol Sci 357: 987-1001. [DOI] [PMC free article] [PubMed] [Google Scholar]
- Oswald J, Klug A, Park T (1999) Interaural intensity difference processing in auditory midbrain neurons: effects of a transient early inhibitory input. J Neurosci 19: 1149-1163. [DOI] [PMC free article] [PubMed] [Google Scholar]
- Panzeri S, Petersen R, Schultz S, Lebedev M, Diamond M (2001) The role of spike timing in the coding of stimulus location in rat somatosensory cortex. Neuron 29: 769-777. [DOI] [PubMed] [Google Scholar]
- Park TJ (1998) IID sensitivity differs between two principal centers in the interaural intensity difference pathway: the LSO and the IC. J Neurophysiol 79: 2416-2431. [DOI] [PubMed] [Google Scholar]
- Park TJ, Pollak GD (1993) GABA shapes a topographic organization of response latency in the mustache bat's inferior colliculus. J Neurosci 13: 5172-5187. [DOI] [PMC free article] [PubMed] [Google Scholar]
- Park TJ, Klug A, Oswald JP, Grothe B (1998) A novel circuit in the bat's midbrain recruits neurons into sound localization processing. Naturwissenschaften 85: 176-179. [DOI] [PubMed] [Google Scholar]
- Peruzzi D, Dut A (2004) GABA, serotonin and serotonin receptors in the rat inferior colliculus. Brain Res 998: 247-250. [DOI] [PubMed] [Google Scholar]
- Pollak G (1988) Time is traded for intensity in the bat's auditory system. Hear Res 36: 107-124. [DOI] [PubMed] [Google Scholar]
- Pollak G, Park T (1993) The effects of GABAergic inhibition on monaural response properties of neurons in the mustache bat's inferior colliculus. Hear Res 65: 99-117. [DOI] [PubMed] [Google Scholar]
- Pompeiano M, Palacios J, Mengod G (1992) Distribution and cellular localization of mRNA coding for 5-HT1A receptor in the rat brain: correlation with receptor binding. J Neurosci 12: 440-453. [DOI] [PMC free article] [PubMed] [Google Scholar]
- Reich D, Mechler F, Victor J (2001) Temporal coding of contrast in primary visual cortex: when, what, and why. J Neurophysiol 85: 1039-1050. [DOI] [PubMed] [Google Scholar]
- Saruhashi Y, Young W, Sugimori M, Abrahams J, Sakuma J (1997) Evidence for serotonin sensitivity of adult rat spinal axons: studies using randomized double pulse stimulation. Neuroscience 80: 559-566. [DOI] [PubMed] [Google Scholar]
- Schuller G (1997) A cheap earphone for small animals with good frequency response in the ultrasonic frequency range. J Neurosci Methods 71: 187-190. [DOI] [PubMed] [Google Scholar]
- Schuller G, Radtke-Schuller S, Betz M (1986) A stereotaxic method for small animals using experimentally determined reference profiles. J Neurosci Methods 18: 339-350. [DOI] [PubMed] [Google Scholar]
- Shay B, Hochman S (2002) Serotonin alters multi-segmental convergence patterns in spinal cord deep dorsal horn and intermediate laminae neurons in an in vitro young rat preparation. Pain 95: 7-14. [DOI] [PubMed] [Google Scholar]
- Sivaramakrishnan S, Oliver D (2001) Distinct K currents result in physiologically distinct cell types in the inferior colliculus of the rat. J Neurosci 21: 2861-2877. [DOI] [PMC free article] [PubMed] [Google Scholar]
- Syka J, Popelar J, Kvasnak E, Astl J (2000) Response properties of neurons in the central nucleus and external and dorsal cortices of the inferior colliculus in guinea pig. Exp Brain Res 133: 254-266. [DOI] [PubMed] [Google Scholar]
- Thompson GC, Thompson AM, Garrett KM, Britton BH (1994) Serotonin and serotonin receptors in the central auditory system. Otolaryngol Head Neck Surg 110: 93-102. [DOI] [PubMed] [Google Scholar]
- To Z, Bonhaus D, Eglen R, Jakeman L (1995) Characterization and distribution of putative 5-ht7 receptors in guinea-pig brain. Br J Pharmacol 115: 107-116. [DOI] [PMC free article] [PubMed] [Google Scholar]
- Trulson ME, Jacobs BL (1979) Raphe unit activity in freely moving cats: correlation with level of behavioral arousal. Brain Res 163: 135-150. [DOI] [PubMed] [Google Scholar]
- Trulson ME, Trulson VM (1982) Differential effects of phasic auditory and visual stimuli on serotonergic neurons in the nucleus raphe dorsalis and nucleus raphe pallidus in freely moving cats. Neurosci Lett 32: 137-142. [DOI] [PubMed] [Google Scholar]
- Waeber C, Sebben M, Nieoullon A, Bockaert J, Dumuis A (1994) Regional distribution and ontogeny of 5-HT4 binding sites in rodent brain. Neuropharmacology 33: 527-541. [DOI] [PubMed] [Google Scholar]
- Wang Y, Strahlendorf JC, Strahlendorf HK (1992) Serotonin reduces a voltage-dependent transient outward potassium current and enhances excitability of cerebellar Purkinje cells. Brain Res 571: 345-349. [DOI] [PubMed] [Google Scholar]
- Waterhouse B, Devilbiss D, Seiple S, Markowitz R (2004) Sensorimotor-related discharge of simultaneously recorded, single neurons in the dorsal raphe nucleus of the awake, unrestrained rat. Brain Res 1000: 183-191. [DOI] [PubMed] [Google Scholar]
- Winer J, Larue D, Pollak G (1995) GABA and glycine in the central auditory system of the mustache bat: structural substrates for inhibitory neuronal organization. J Comp Neurol 355: 317-353. [DOI] [PubMed] [Google Scholar]
- Wright D, Seroogy K, Lundgren K, Davis B, Jennes L (1995) Comparative localization of serotonin1A, 1C, and 2 receptor subtype mRNAs in rat brain. J Comp Neurol 351: 357-373. [DOI] [PubMed] [Google Scholar]
- Yan S, Suga N (1996) Corticofugal modulation of time-domain processing of biosonar information in bats. Science 273: 1100-1103. [DOI] [PubMed] [Google Scholar]
- Yan Z (2002) Regulation of GABAergic inhibition by serotonin signaling in prefrontal cortex: molecular mechanisms and functional implications. Mol Neurobiol 26: 203-216. [DOI] [PubMed] [Google Scholar]
- Yang L, Pollak GD, Resler C (1992) GABAergic circuits sharpen tuning curves and modify response properties in the mustache bat inferior colliculus. J Neurophysiol 68: 1760-1774. [DOI] [PubMed] [Google Scholar]
- Zhang H, Kelly JB (2001) AMPA and NMDA receptors regulate responses of neurons in the rat's inferior colliculus J Neurophysiol 86: 871-880. [DOI] [PubMed] [Google Scholar]
- Zhang H, Wu SH, Kelly JB (2004) Regulation of auditory responses in the central nucleus of the inferior colliculus by tetraethylammonium-sensitive potassium channels. J Neurophysiol 91: 2194-2204. [DOI] [PubMed] [Google Scholar]
- Zhang Y, Suga N, Yan J (1997) Corticofugal modulation of frequency processing in bat auditory system. Nature 387: 900-903. [DOI] [PubMed] [Google Scholar]