

Abstract
The first in vivo magnetic resonance study of experimental cerebral malaria is presented. Cerebral involvement is a lethal complication of malaria. To explore the brain of susceptible mice infected with Plasmodium berghei ANKA, multimodal magnetic resonance techniques were applied (imaging, diffusion, perfusion, angiography, spectroscopy). They reveal vascular damage including blood-brain barrier disruption and hemorrhages attributable to inflammatory processes. We provide the first in vivo demonstration for blood-brain barrier breakdown in cerebral malaria. Major edema formation as well as reduced brain perfusion was detected and is accompanied by an ischemic metabolic profile with reduction of high-energy phosphates and elevated brain lactate. In addition, angiography supplies compelling evidence for major hemodynamics dysfunction. Actually, edema further worsens ischemia by compressing cerebral arteries, which subsequently leads to a collapse of the blood flow that ultimately represents the cause of death. These findings demonstrate the coexistence of inflammatory and ischemic lesions and prove the preponderant role of edema in the fatal outcome of experimental cerebral malaria. They improve our understanding of the pathogenesis of cerebral malaria and may provide the necessary noninvasive surrogate markers for quantitative monitoring of treatment.
Keywords: neuroimaging, ischemia, edema, experimental cerebral malaria, metabolism, mice
Introduction
Malaria results each year in hundreds of millions of clinical cases and causes over one million deaths. Cerebral malaria (CM), the most lethal complication in Plasmodium falciparum infection, leads to an encephalopathy with seizures and loss of consciousness. Although investigated extensively, the pathogenesis of CM is still unclear. It involves profound intravascular changes with sequestration of parasitized erythrocytes and host cells in cerebral microvessels. The host immune system plays a crucial role through cytokines and effector cells (Adams et al., 2002; de Souza and Riley, 2002; Hunt and Grau, 2003; Taylor et al., 2004). The respective contribution of each process is still a matter for debate, but clearly cerebral complications may result from concomitant microvessel obstruction and inflammation (Medana et al., 2002; Ball et al., 2004).
Human brain studies, essentially limited to postmortem observations, have revealed, besides parasitized erythrocyte sequestration, edema, blood-brain barrier (BBB) breakdown, and petechial hemorrhages (Adams et al., 2002). The few isolated cases of adults with CM studied by in vivo imaging techniques have shown brain swelling, small hemorrhagic lesions, and focal lesions in the cerebrum and brainstem (Kampfl et al., 1993; Millan et al., 1993; Looareesuwan et al., 1995; Cordoliani et al., 1998; Patankar et al., 2002). Cerebellar edema and hydrocephalus have been described previously in an infant (Saavedra-Lozano et al., 2001).
Infection of susceptible mouse strains with Plasmodium berghei ANKA provides a widely used experimental CM that shares some characteristics with the human disease including blood cell sequestration (de Souza and Riley, 2002) and a deleterious immune response (Lou et al., 1998; Bagot et al., 2002; Hunt and Grau, 2003). Susceptible mice develop neurological manifestations such as hemiplegia or paraplegia, deviation of the head, tendency to roll over on stimulation, ataxia, seizures, and coma, followed by death (Lou et al., 2001). Histological studies have shown that experimental CM is characterized by vascular plugging, BBB breakdown, petechial hemorrhages, and edema (Medana et al., 2001).
We have been interested in imaging in vivo the pathophysiological alterations potentially leading to CM in susceptible mice. To this end, we used magnetic resonance imaging (MRI) and magnetic resonance spectroscopy (MRS) that can noninvasively provide structural, functional, and metabolic information. We expected that these techniques could assess the importance of vascular damage and decipher the respective effects of obstructive and inflammatory processes.
To study the impact of CM on brain vasculature, we investigated the vascular anatomy of arteries with MR angiography (Beckmann, 2000), a challenging technique on mice, and cerebral blood flow (CBF) by using quantitative arterial spin labeling perfusion MRI. BBB rupture was investigated using contrast-enhanced T1-weighted MRI with a vascular contrast agent that extravasates at sites of leakage. This is the gold standard to pinpoint focal inflammatory lesions (McDonald et al., 1992). Edema was assessed by measuring the apparent diffusion coefficient (ADC) that reflects water molecule diffusion. Finally, we used 1H-MRS and 31P-MRS to better understand the metabolic anomalies underlying brain injury in CM, in relation to (1) the energy metabolism failure as a consequence of vascular damage and (2) the impairment of specific neuronal and glial metabolisms.
Materials and Methods
Animals and parasite infection
Animal studies were in agreement with the French guidelines for animal care and approved by the local Committee on Ethics. Fifty female CBA/J mice (8-10 weeks old) were used for this study, 20 as controls and 30 that were infected with P. berghei ANKA by intraperitoneal injection of 106 parasitized erythrocytes (Grau et al., 1986). Parasitemia was monitored on days 4 and 7 of infection by examining Giemsa-stained blood smears. Mice were screened on a daily basis for neurological manifestations.
In vivo MR protocol
The mice were explored on a 4.7 T horizontal Bruker (Ettlingen, Germany) 47/30 AVANCE Biospec MR system. The images and 1H spectra were acquired with a whole-body resonator for transmission and a head quadrature surface coil for reception. Animals were anesthetized by an intraperitoneal injection of ketamine (50-100 mg/kg) and xylazine (10-20 μg/kg). The mice were placed in a cradle equipped with a stereotaxic holder, an integrated heating system to maintain the body temperature at 36 ± 1°C, and a pressure probe to monitor the respiration.
MRI. Geometrical parameters for multislice T1-, T2-, and T2*-weighted images were as follows: 15 contiguous slices; 0.7 mm thick; matrix, 2562; field of view (FOV), 252 mm2. T1-weighted images were acquired using a spin-echo sequence [echo time (TE), 15 ms; repetition time (TR), 0.6 s; two averages] before and after the intravenous injection of gadolinium (III)-diethyltriaminepentaacetic acid (Gd-DTPA; 1 ml/kg; Magnevist; Schering-Plough, Levallois-Perret, France). T2-weighted images were acquired with a spin-echo sequence [TE, 40 ms; TR, 2.5 s; RARE (rapid acquisition with relaxation enhancement) factor 4; 2 averages], and T2*-weighted images were acquired with a gradient-echo sequence (TE, 17 ms; TR, 1 s; flip angle, 20°; three averages).
Multislice diffusion-weighted spin-echo echoplanar imaging was used to map the ADC [TE, 55 ms; TR, 3 s; 11 contiguous slices, 1 mm thick; matrix, 1282; FOV, 252 mm2; four segments; two averages for each direction (x, y, and z)]. Half-sine-shaped diffusion gradients were applied separately along x-, y-, and z-axis directions, with five increasing values of b-factor: 24.31, 388.99, 803.81, 1367.55, and 1969.27 s/mm2.
Quantitative CBF maps were obtained with a Look-Locker arterial spin-labeling technique (Kober et al., 2004). A series of 50 gradient echoes was acquired after each inversion pulse. The in-plane spatial resolution was 156 × 312 μm2, the TE was 1.56 ms, the slice thickness was 3 mm, the matrix was 128 × 64, the FOV was 252 mm2, and the flip angle was 10°.
MR angiography was performed on an 11.75 T vertical Bruker AVANCE 500WB wide-bore MR system and a transmitting and receiving head resonator. Angiograms were acquired with a three-dimensional, gradient-echo time-of-flight sequence (TE, 3.6 ms; TR, 30 ms; flip angle, 50°; matrix, 256 × 192 × 64; FOV, 18 × 12 × 9 mm3; two averages).
MRS. Localized 1H-MR brain spectra were acquired with the PRESS (point-resolved spatially localized spectroscopy) sequence [TE, 16 or 135 ms; TR, 1.5 s; 256 averages; 1024 points; water suppression, VAPOR (variable power radio frequency pulses with optimized relaxation delays) sequence]. The volume of interest (3.53 mm3) was positioned mainly in the striatum and thalamus. 31P-MRS was performed using a homemade surface coil (1 cm diameter) tuned to 31P (81.184 MHz) and positioned over the skull (one-pulse sequence; TR, 2 s; 1024 averages; 1024 points; sweep width, 8 MHz).
MR data processing
All MR data were processed under the IDL environment (Interactive Data Language Research System, Boulder, CO).
MRI. Brain and ventricle (lateral and third) volumes were calculated from T1-weighted images. The lesion volume was calculated from T2 hyperintensities.
The ADC maps were generated from the three sets of images recorded with increasing diffusion weighting along orthogonal directions (ADCx, ADCy, ADCz). The average ADC was determined from the trace of the diffusion tensor (van Gelderen et al., 1994). For each direction, the ADC value was calculated pixel by pixel using a linear regression with the following equation: ln[Si(b)]/ln[Si(b = 0)] = -b × ADCi, where S is the signal intensity (ADCi, Si, i = x, y, or z).
CBF maps were calculated as described previously (Kober et al., 2004). The blood/tissue partition coefficient for water was assumed to be λ = 0.9 ml/g (Sun et al., 2004), and T1 of blood was determined as the average T1 measured in a large brain vessel. CBF values >8 ml/g/min were masked in the CBF map to exclude large vessels.
Regional ADC and CBF values were evaluated as an average of pixel values in the cortex and the striatum.
Angiograms were produced by generating maximum intensity projections after interpolating raw data to obtain an isotropic resolution (588 μm3/pixel3).
MRS. 1H-MRS data were processed as described previously (Viola et al., 2004). Results were expressed as ratios of the relative area of each metabolite signal to the sum (S) of all metabolite signal areas: S = N-acetylaspartate (NAA) + creatine total (tCr) + choline (Cho) for spectra recorded at a TE of 135 ms; S = NAA + tCr + Cho + glutamine plus glutamate (Glx) + myo-inositol + taurine for a TE of 16 ms.
Data processing of 31P-MRS consisted of zero-filling (2048 points), apodization (20 Hz), Fourier transform, and zero-order phase correction. The chemical shifts were referenced to phosphocreatine (PCr) (-2.45 ppm). The signal amplitudes of PCr, inorganic phosphate (Pi), phosphomonoesters (PME), and α-, β-, and γ-ATP were calculated using the AMARES time-domain-fitting procedure. The chemical shift between Pi and PCr was used to calculate brain pH (Arnold et al., 1984). Saturation factors were calculated by comparing the integration values for each resonance obtained at a TR of 2 and 20 s (β-ATP, 1.45; PCr, 2.02, Pi, 1.98; n = 3). The metabolites were expressed as ratios of metabolites after correcting for signal differential partial saturation.
Statistical analysis
The statistical analysis was performed using the Mann-Whitney U test for two statistical populations or a Kruskal-Wallis analysis, followed by a Dunn's multiple comparison test, for three populations. Correlations were calculated by using the nonparametric Spearman's rank correlation test. Values are reported as means ± SD. Significance was set at p < 0.05.
Results
Experimental CM is characterized by brain edema and parenchymal lesions
All mice with CM presented with an increase in brain volume, often associated with ventriculomegaly, compared with uninfected animals (Fig. 1A). Brain and ventricle swelling were quantified. The increase in brain volume was significant (uninfected mice, 408 ± 18 mm3; CM mice, 467 ± 20 mm3; p < 0.001). Two patterns of variation in ventricle size were observed in relation to the severity of the neurological signs. Therefore, mice with CM were divided into two subsets: those with mild CM showed paraparesis, mild ataxia, or rare seizures and had no ruffled fur and no hypothermia, whereas those with severe CM presented with severe ataxia, hemiplegia or paraplegia, and frequent seizures, together with ruffled fur, hypothermia, and prostration. Hypothermia indeed represents a sign of full-blown CM, as opposed to a mild, incipient syndrome, as described previously (Grau et al., 1991). No significant difference was observed between mild and severe CM regarding brain volume (Fig. 1B). In contrast, ventricle enlargement was important in mice with mild CM and moderate in mice with severe CM (Fig. 1B).
Figure 1.

Assessment of brain swelling in mice with CM. A, Typical axial multislice T2-weighted MR images from an uninfected mouse and a mouse with CM (c, cortex; cc, corpus callosum; hi, hippocampus; s, striatum, v, ventricles). Note the areas of hyperintense signal in the striatum and corpus callosum (H). B, Total cerebral, ventricular, and lesion volumes from uninfected mice (n = 8), mice with mild CM (n = 8), and mice with severe CM (n = 5). C, Mid-sagittal T2-weighted MR images from an uninfected mouse and a mouse with CM. 1, Line going from the pituitary gland to the Sylvius aqueduct; 2, median line crossing the medial cerebellar nucleus; 3, median line stemming from the cerebellar obex (b, brainstem; cb, cerebellum; pg, pituary gland). D, Measurement of distances 1-3 from the mid-sagittal T2-weighted MR images of uninfected mice (n = 8) and mice with CM (n = 7). *p < 0.05; **p < 0.01; ***p < 0.005; ****p < 0.001. Scale bars: A, C, 1 mm.
In addition to brain swelling, axial T2-weighted images from mice with CM displayed major tissue damage, mostly in the corpus callosum, evocative of edema and/or destructive lesions in this white-matter structure. Hyperintense lesions delineating the caudate-putamen were also observed (Fig. 1A). The T2 lesion load was significantly higher in mice with CM than in uninfected mice (Fig. 1B). A negative correlation was found between the lesion load and the ventricle volume in mice with CM (ρ = -0.588; p < 0.05).
Sagittal images obtained from mice with CM showed a crushing of the cerebellum and of the pituitary gland and an engulfment of the brainstem in the foramen magnum as a result of brain swelling (Fig. 1C). Brainstem and cerebellum distortions were estimated by measuring the increase in brainstem thickness (distance 1) and the variation in cerebellum shape (a reduction in distance 2 and an increase in distance 3). Significant cerebellum compression and displacement of the brainstem were apparent in mice with CM (Fig. 1D).
To complete the evaluation of tissue damage in terms of edema, diffusion-weighted MR images were acquired (Fig. 2). The ADC maps revealed a significant decrease in the ADC values within the striatum (uninfected mice, 0.731 ± 0.09 × 10⁻³mm2/s; CM mice, 0.666 ± 0.046 × 10⁻³mm2/s; p < 0.05; n = 15) and a more pronounced reduction in the parietal cortex (uninfected mice, 0.756 ± 0.117 × 10⁻³mm2/s; CM mice, 0.638 ± 0.051 × 10⁻³mm2/s; p < 0.005; n = 15).
Figure 2.

ADC maps reveal cytotoxic edema in mice with CM. Representative ADC maps from uninfected mice and mice with CM are shown. Scale bar, 1 mm.
Experimental CM is associated with cerebral hemorrhages and BBB disruption
Inflammatory lesions were detected in mice with CM by a T1-weighted MRI in the presence of Gd-DTPA and characterized by an increase in signal intensity (Fig. 3A). Areas of Gd-DTPA enhancement matched with hyperintense T2 areas, indicating destructive lesions (Fig. 1A). An enhancement of the ventricles was also evidenced. No signal enhancement was observed in uninfected mice.
Figure 3.

Evidence of BBB lesions and vascular damage in mice with CM. A, Typical axial multislice T1-weighted MR images from an uninfected mouse and two mice with CM before and after the intravenous injection of Gd-DTPA. Arrows indicate areas of contrast enhancement showing major ventriculitis in mice with CM and signal enhancement in lesions in mice with severe CM. B, Typical axial multislice T2*-weighted MR images from an uninfected mouse and a mouse with CM showing hemorrhages (arrows). Scale bars, 1 mm.
To check the presence of hemorrhages, we used a T2*-weighted sequence that enables the detection of areas of shorter relaxation times, attributable to the presence of paramagnetic iron in the blood, yielding hypointense signals (Fig. 3B). T2*-weighted images from CM brains were characterized by the presence of “dark stains” within the parenchyma that are characteristic of petechial hemorrhages and areas of strong T2* damping within the cortex.
CBF is altered in experimental CM
Perfusion MRI and MR angiography were applied to unravel eventual vascular damage in CM. CBF maps showed a strong reduction of blood flow in mice with CM (Fig. 4A). Perfusion represents the capillary blood flow in a given brain region. Mean CBF dropped significantly in the striatum [uninfected mice (n = 6), 1.313 ± 0.174 ml/g/min; CM mice (n = 9), 0.926 ± 0.314 ml/g/min; p < 0.05] and even more in the cortex [uninfected mice (n = 6), 1.135 ± 0.305 ml/g/min; CM mice (n = 9), 0.669 ± 0.161 ml/g/min; p < 0.01]. The angiograms revealed a dramatic flow perturbation with attenuation in the arterial blood signal and major flow voids in severe CM. In this latter form, only the carotids and the Willis circle were clearly visible (Fig. 4B).
Figure 4.

Brain perfusion maps reveal decreased CBF, and angiograms show major artery compression in mice with CM. A, Representative perfusion maps from uninfected mice and mice with CM. B, Coronal, axial, and sagittal maximum intensity projections of a three-dimensional time-of-flight angiogram of an uninfected mouse, a mouse with mild CM, and a mouse with severe CM. Orientations: d, dorsal; v, ventral; r, rostral; c, caudal. 1, Anterior cerebral artery; 2, ophthalmic artery; 3, middle cerebral artery; 4, palatine artery; 5, posterior cerebral artery; 6, basilar artery; 7, Willis circle; 8, carotid artery. Scale bars, 1 mm.
Brain metabolism reflects ischemia and neuronal injury in experimental CM
Brain 1H-MRS of mice with CM performed with a TE of 16 ms showed a substantial decrease in NAA/S and an augmented level of Glx/S without any significant change in the myo-inositol/S level. The reduction in NAA/S was more pronounced in spectra recorded at a TE of 135 ms and was associated with a markedly elevated content of lactate. The analysis of these spectra from mice with CM showed a negative correlation between NAA/S and lactate/S (ρ = -0.804; p < 0.01) (Fig. 5A, Table 1).
Figure 5.
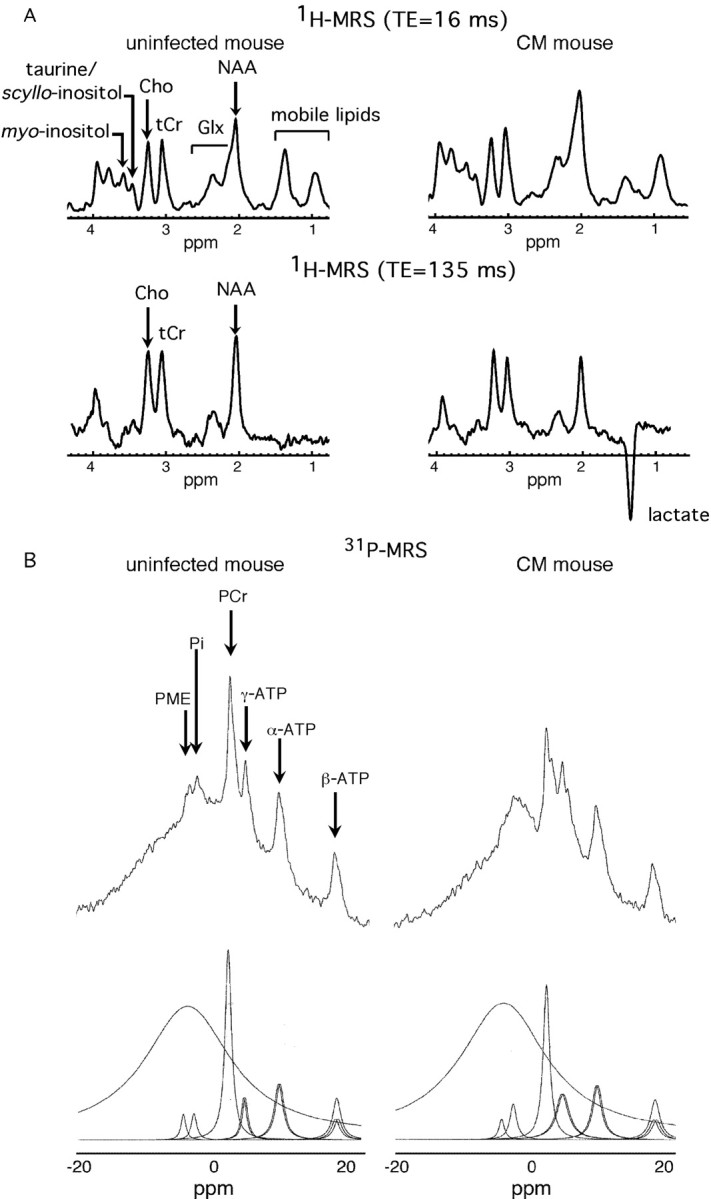
In vivo cerebral 1H-MR and 31P-MR spectra show an ischemic metabolic profile. A, Representative spectra from an uninfected mouse and from a mouse with CM (TE, 16 and 135 ms). B, Original and deconvoluted 31P-MR spectra from an uninfected mouse and a mouse with CM.
Table 1.
Brain metabolite analysis determined by in vivo brain 1H-MRS and 31P-MRS
|
Metabolite ratio |
Uninfected mice |
CM mice |
|---|---|---|
| 1H-MRS (TE, 16 ms) | n = 9 | n = 12 |
| NAA/S | 0.35 ± 0.08 | 0.28 ± 0.06* |
| tCr/S | 0.16 ± 0.01 | 0.17 ± 0.03 |
| Cho/S | 0.13 ± 0.02 | 0.13 ± 0.02 |
| Glx/S | 0.20 ± 0.05 | 0.28 ± 0.06** |
| Taurine/S | 0.05 ± 0.02 | 0.04 ± 0.01 |
| myo-inositol/S | 0.11 ± 0.04 | 0.10 ± 0.03 |
| 1H-MRS (TE, 135 ms) | n = 9 | n = 12 |
| NAA/S | 0.37 ± 0.06 | 0.28 ± 0.02*** |
| tCr/S | 0.30 ± 0.03 | 0.29 ± 0.02 |
| Cho/S | 0.33 ± 0.04 | 0.33 ± 0.03 |
| Lactate/S | 0.01 ± 0.02 | 0.09 ± 0.05*** |
| 31P-MRS | n = 8 | n = 8 |
| PCr/β-ATP | 2.46 ± 0.41 | 2.73 ± 0.50 |
| PCr/Pi | 6.83 ± 0.44 | 5.63 ± 0.33 |
| β-ATP/Pi | 2.9 ± 0.95 | 2.08 ± 0.25 |
| (PCr + β-ATP)/Pi | 9.73 ± 2.15 | 7.71 ± 1.02* |
| pH |
7.29 ± 0.09 |
7.11 ± 0.09*
|
Values are reported as means ± SD (*p < 0.05; **p < 0.005; ***p < 0.0005).
We found a trend to decrease for PCr/Pi and for β-ATP/Pi and a significant decrease in (PCr + β-ATP)/Pi in mice with CM (Fig. 5B, Table 1). No variation in the PME level was observed (data not shown). Cerebral pH was reduced in CM mice by approximately -0.174 pH units.
Discussion
We present here the first study of experimental CM using in vivo MRI and MRS and have identified structural, vascular, and metabolic cerebral alterations. We show that experimental CM is characterized by major brain edema, parenchymal lesions, vascular dysfunction including BBB breakdown, reduced CBF, and dramatic arterial flow perturbations. These anomalies are associated with an impaired brain metabolism reflecting cellular injury and bioenergetic breakdown.
The metabolic profile in mice with CM is typical of brain ischemia. Indeed, our 31P spectra showed a reduction in high-energy phosphates already described in experimental CM (Rae et al., 2004). Here, we provide the first evidence for a significant decrease in cerebral pH. Similar metabolic anomalies have been reported in brain ischemia (van der Toorn et al., 1996). Along with energy metabolism impairment and reduced pH, our finding of elevated brain lactate, in line with in vitro studies (Le Moyec et al., 1997; Sanni et al., 2001), is an additional indicator of tissue ischemia. Interestingly, elevated lactate in the CSF of patients is considered as a major hallmark of human CM (White et al., 1985; Medana et al., 2002). Lactate is essentially produced in the astrocytes (Pellerin and Magistretti, 2004) that, after hypoxia, increase their production by upregulating glycolytic enzyme. This ischemic metabolic profile is consistent with the reduced CBF measured in mice with CM.
In addition to ischemia, lactate may have an inflammatory origin because macrophages produce lactate after activation (Lopez-Villegas et al., 1995). During experimental CM, we observed inflammatory lesions; therefore, we cannot exclude the contribution of macrophages to the lactate signal.
Our study also demonstrates in vivo a decrease in NAA mainly in the striatum and thalamus, in accordance with previous in vitro studies (Sanni et al., 2001). This neuronal marker is an acetyl group donor for lipid synthesis required for myelination and could be involved in neuron osmoregulation (Baslow, 2002). A reduction in the NAA level is generally accepted as a sign of neuronal injury (Sager et al., 1999). There was a strong negative correlation between NAA and lactate, suggesting decreased NAA synthesis with a short supply of glucose and oxygen.
Another metabolic feature of experimental CM was the increase in the Glx signal. High-resolution MR studies of brain extracts have demonstrated in CM an increase in glutamine and a decrease in glutamate (Le Moyec et al., 1997; Sanni et al., 2001; Rae et al., 2004). Therefore, we can expect an increase of glutamine in vivo accounting for the high Glx signal. Besides, brain glutamine metabolism is modified after ischemia, with an overexpression of glutamine synthetase (EC 6.3.1.2) and a decrease in glutaminase activity (EC 3.5.1.2). These protective mechanisms counteract the excitotoxic effects of glutamate, which is taken up by Na+/K+ ATPases in astrocytes and converted into glutamine during ischemia (Petito et al., 1992; Newcomb et al., 1998). These processes could contribute to an increase in glutamine during experimental CM. The excessive production of glutamine in the brain of mice with CM, a cerebral osmolyte, may further elicit cell swelling and brain edema (Belin et al., 1997).
Metabolic impairment in CM indicates acute brain suffering also visualized with MRI. Remarkably, the lesions in the corpus callosum and striatum involved in motricity control are similar to those reported in ischemia (Qiao et al., 2004). In addition, a reduction in NAA, reflecting neuronal injury was observed in the striatum. Moreover, the hypointense T2* signals in the parenchyma are evocative of hemorrhages and/or the presence of a high number of iron-loaded monocytes/macrophages (Saleh et al., 2004). In human CM, petechial hemorrhages, frequent in areas of high sequestration of parasitized erythrocytes, and ring hemorrhages consisting of concentric rings at the periphery of necrotic vessels have been described. Microglial astroglial nodules, Dürck's granulomas, are indicative of an inflammatory reaction in the vicinity of ring hemorrhages (Turner, 1997). These lesions, if present in experimental CM, could contribute to the T2* hypointensities.
CM is an encephalopathy with cell sequestration in microvessels. Although experimental CM resembles the human disease, the nature of sequestered cells constitutes a major difference (predominantly parasitized erythrocytes in humans and monocytes in mice) (Chang-Ling et al., 1992; Hearn et al., 2000; Hunt and Grau, 2003). This sequestration acts synergistically with proinflammatory cytokines to produce deleterious effects, including killing of endothelial cells (Jennings et al., 1997) that may cause BBB disruption. We provide the first in vivo evidence for a BBB breakdown in CM using Gd-DTPA. This result confirms previous findings obtained with blue Evans dye (Thumwood et al., 1988; Piguet et al., 2000). Moreover, the ventricle signal enhancement observed after Gd-DTPA injection on T1-weighted images indicates ventriculitis, a sign of acute inflammation (Nagahiro et al., 1994).
We found that both cytotoxic and vasogenic edema are predominant features of experimental CM. Cytotoxic edema involves an influx of extracellular water into the intracellular compartment leading to cell swelling and irreversible cell damage. It results from anoxic depolarization subsequently to the failure of Na+/K+ ATPases to maintain membrane potential after ATP loss (Latour et al., 1994; Harris et al., 2000; Ayata and Ropper, 2002) and is not considered as responsible for brain swelling, because it does not lead to a change in the total water content. It is characterized by a reduction in the ADC value because of constrained diffusive motion in the extracellular compartment and by impaired energetic metabolism and reduced pH (van der Toorn et al., 1996). We detected these features in experimental CM.
Vasogenic edema is characterized by an expansion of the extracellular compartment after BBB breakdown and relocation of intravascular water into the extravascular compartment. Inflammation is one of the possible mechanisms at the origin of BBB disruption. Our results demonstrate that BBB lesions, brain swelling, and ventricle enlargement play a key role in the development of the cerebral syndrome and confirm the existence of a vasogenic edema.
Regulating mechanisms may temporarily circumvent the expansion of edema but ultimately fail to counteract its development. Ventricle enlargement is an adaptative mechanism to remove the extracellular fluid of the edema through the CSF pathways and was observed in mice with mild CM. However, ventricle volume in mice with severe CM was approximately the same as in uninfected mice. Brain expansion is limited by the inner cavity of the skull, which could explain that at the acute stage of CM a compression exerted by the swollen parenchyma occurs at the expense of the CSF compartment, leading to a reduction in ventricle volume. This reduction is associated with tissue destruction (corpus callosum and striatum), as indicated by the negative correlation between the lesion load and the ventricle volume.
The nature of hemodynamics disturbances in human CM is unclear, with conflicting results showing either vasodilatation or stenosis of brain arteries (Newton et al., 1997; Clavier et al., 1999). Vessel vasodilatation was thought to cause brain swelling (Looareesuwan et al., 1995). However, our MR angiograms showed a collapse of the blood flow as a result of a major compression of cerebral arteries by the brain parenchyma in experimental CM. Furthermore, the crushing of the cerebellum together with striatal lesions may partly explain ataxia, given the role of these structures in the control of motricity. The compression of the pituitary gland, involved in the control of sodium and water balance and temperature regulation, may contribute to worsen edema and lead to hypothermia, a well known feature of experimental CM. Finally, brainstem engulfment may induce respiratory distress. These complications arise from edema and may ultimately represent the cause of death.
A single animal model can hardly mimic all of the physiopathological features of a human disease, especially when the pathology shows so much variability in humans. Several common points between human and murine CM have long been recognized (Taylor-Robinson, 1995; Newton et al., 2000; de Souza and Riley, 2002). The most widely used mouse model for CM presents 22 points of similarity/concordance with the human disease, as listed and discussed recently (Hunt and Grau, 2003). A 23rd parameter can be added, namely the presence of dramatically elevated levels of microparticles (Combes et al., 2004; Combes et al., 2005), a finding probably in line with the microcirculatory changes presented in this work.
Experimental CM reproduces an acute syndrome with a fatal outcome. Brain edema and intracranial hypertension play a crucial role in the pediatric pathogenesis, whereas they have been less frequently reported in adults, although major brain edema has been described in fatal cases (Looareesuwan et al., 1995). Our investigations demonstrate that experimental CM is an ischemic pathology characterized by massive edema and thus is closer to the pediatric pathology (Saavedra-Lozano et al., 2001; Sanni, 2001; Hunt and Grau, 2003). Brain edema and raised intracranial pressure have long been considered as essential pathogenic features of the child disease. Our results demonstrate that generalized massive edema eventually leads to compression of cerebral vessels.
This in vivo study gives new insights toward a better understanding of the pathogenesis of CM, which is still required to develop new therapeutic strategies. Multimodal MR techniques may provide the necessary surrogate markers to noninvasively and quantitatively monitor the efficacy of new treatments.
Footnotes
This work was supported by grants from the Institut National de Santé et Recherche Médicale, Centre National de la Recherche Scientifique (CNRS), Programme National Imagerie du Petit Animal (CNRS, Commissariat à l'Energie Atomique), Institut Universitaire de France, and Action Concertée Incitative “Plates-formes d'explorations fonctionnelles thématisées” (ACI 2003).
Correspondence should be addressed to Dr. Angèle Viola, Centre de Résonance Magnétique Biologique et Médicale, Unité Mixte de Recherche CNRS 6612, Faculté deMédecine, 27 Bd J. Moulin, 13005 Marseille, France. E-mail: viola@medecine.univ-mrs.fr.
Copyright © 2005 Society for Neuroscience 0270-6474/05/257352-•$15.00/0
M.-F.P. and A.V. contributed equally to this work.
References
- Adams S, Brown H, Turner G (2002) Breaking down the blood-brain barrier: signaling a path to cerebral malaria? Trends Parasitol 18: 360-366. [DOI] [PubMed] [Google Scholar]
- Arnold DL, Matthews PM, Radda GK (1984) Metabolic recovery after exercise and the assessment of mitochondrial function in vivo in human skeletal muscle by means of 31P NMR. Magn Reson Med 1: 307-315. [DOI] [PubMed] [Google Scholar]
- Ayata C, Ropper AH (2002) Ischaemic brain oedema. J Clin Neurosci 9: 113-124. [DOI] [PubMed] [Google Scholar]
- Bagot S, Idrissa Boubou M, Campino S, Behrschmidt C, Gorgette O, Guenet JL, Penha-Goncalves C, Mazier D, Pied S, Cazenave PA (2002) Susceptibility to experimental cerebral malaria induced by Plasmodium berghei ANKA in inbred mouse strains recently derived from wild stock. Infect Immun 70: 2049-2056. [DOI] [PMC free article] [PubMed] [Google Scholar]
- Ball HJ, MacDougall HG, McGregor IS, Hunt NH (2004) Cyclooxygenase-2 in the pathogenesis of murine cerebral malaria. J Infect Dis 189: 751-758. [DOI] [PubMed] [Google Scholar]
- Baslow MH (2002) Evidence supporting a role for N-acetyl-l-aspartate as a molecular water pump in myelinated neurons in the central nervous system. An analytical review. Neurochem Int 40: 295-300. [DOI] [PubMed] [Google Scholar]
- Beckmann N (2000) High resolution magnetic resonance angiography non-invasively reveals mouse strain differences in the cerebrovascular anatomy in vivo. Magn Reson Med 44: 252-258. [DOI] [PubMed] [Google Scholar]
- Belin MF, Didier-Bazes M, Akaoka H, Hardin-Pouzet H, Bernard A, Giraudon P (1997) Changes in astrocytic glutamate catabolism enzymes following neuronal degeneration or viral infection. Glia 21: 154-161. [DOI] [PubMed] [Google Scholar]
- Chang-Ling T, Neill AL, Hunt NH (1992) Early microvascular changes in murine cerebral malaria detected in retinal whole mounts. Am J Pathol 140: 1121-1130. [PMC free article] [PubMed] [Google Scholar]
- Clavier N, Rahimy C, Falanga P, Ayivi B, Payen D (1999) No evidence for cerebral hypoperfusion during cerebral malaria. Crit Care Med 27: 628-632. [DOI] [PubMed] [Google Scholar]
- Combes V, Taylor TE, Juhan-Vague I, Mege JL, Mwenechanya J, Tembo M, Grau GE, Molyneux ME (2004) Circulating endothelial microparticles in malawian children with severe falciparum malaria complicated with coma. JAMA 291: 2542-2544. [DOI] [PubMed] [Google Scholar]
- Combes V, Coltel N, Alibert M, van Eck M, Raymond C, Juhan-Vague I, Grau GE, Chimini G (2005) ABCA1 gene deletion protects against cerebral malaria: potential pathogenic role of microparticles in neuropathology. Am J Pathol 166: 295-302. [DOI] [PMC free article] [PubMed] [Google Scholar]
- Cordoliani YS, Sarrazin JL, Felten D, Caumes E, Leveque C, Fisch A (1998) MR of cerebral malaria. AJNR Am J Neuroradiol 19: 871-874. [PMC free article] [PubMed] [Google Scholar]
- de Souza JB, Riley EM (2002) Cerebral malaria: the contribution of studies in animal models to our understanding of immunopathogenesis. Microbes Infect 4: 291-300. [DOI] [PubMed] [Google Scholar]
- Grau GE, Piguet PF, Engers HD, Louis JA, Vassalli P, Lambert PH (1986) L3T4+ T lymphocytes play a major role in the pathogenesis of murine cerebral malaria. J Immunol 137: 2348-2354. [PubMed] [Google Scholar]
- Grau GE, Pointaire P, Piguet PF, Vesin C, Rosen H, Stamenkovic I, Takei F, Vassalli P (1991) Late administration of monoclonal antibody to leukocyte function-antigen 1 abrogates incipient murine cerebral malaria. Eur J Immunol 21: 2265-2267. [DOI] [PubMed] [Google Scholar]
- Harris NG, Zilkha E, Houseman J, Symms MR, Obrenovitch TP, Williams SR (2000) The relationship between the apparent diffusion coefficient measured by magnetic resonance imaging, anoxic depolarization, and glutamate efflux during experimental cerebral ischemia. J Cereb Blood Flow Metab 20: 28-36. [DOI] [PubMed] [Google Scholar]
- Hearn J, Rayment N, Landon DN, Katz DR, de Souza JB (2000) Immunopathology of cerebral malaria: morphological evidence of parasite sequestration in murine brain microvasculature. Infect Immun 68: 5364-5376. [DOI] [PMC free article] [PubMed] [Google Scholar]
- Hunt NH, Grau GE (2003) Cytokines: accelerators and brakes in the pathogenesis of cerebral malaria. Trends Immunol 24: 491-499. [DOI] [PubMed] [Google Scholar]
- Jennings VM, Actor JK, Lal AA, Hunter RL (1997) Cytokine profile suggesting that murine cerebral malaria is an encephalitis. Infect Immun 65: 4883-4887. [DOI] [PMC free article] [PubMed] [Google Scholar]
- Kampfl AW, Birbamer GG, Pfausler BE, Haring HP, Schmutzhard E (1993) Isolated pontine lesion in algid cerebral malaria: clinical features, management, and magnetic resonance imaging findings. Am J Trop Med Hyg 48: 818-822. [DOI] [PubMed] [Google Scholar]
- Kober F, Iltis I, Izquierdo M, Desrois M, Ibarrola D, Cozzone PJ, Bernard M (2004) High-resolution myocardial perfusion mapping in small animals in vivo by spin-labeling gradient-echo imaging. Magn Reson Med 51: 62-67. [DOI] [PubMed] [Google Scholar]
- Latour LL, Svoboda K, Mitra PP, Sotak CH (1994) Time-dependent diffusion of water in a biological model system. Proc Natl Acad Sci USA 91: 1229-1233. [DOI] [PMC free article] [PubMed] [Google Scholar]
- Le Moyec L, Ekwalanga M, Eugene M, Bouanga JC, Bauza G, M'Bengue A, Mazier D, Gentilini M (1997) Brain metabolites in mice coinfected with Plasmodium berghei ANKA and LP-BM5 virus: assessment by proton magnetic resonance spectroscopy. Exp Parasitol 85: 296-298. [DOI] [PubMed] [Google Scholar]
- Looareesuwan S, Wilairatana P, Krishna S, Kendall B, Vannaphan S, Viravan C, White NJ (1995) Magnetic resonance imaging of the brain in patients with cerebral malaria. Clin Infect Dis 21: 300-309. [DOI] [PubMed] [Google Scholar]
- Lopez-Villegas D, Lenkinski RE, Wehrli SL, Ho WZ, Douglas SD (1995) Lactate production by human monocytes/macrophages determined by proton MR spectroscopy. Magn Reson Med 34: 32-38. [DOI] [PubMed] [Google Scholar]
- Lou J, Gasche Y, Zheng L, Critico B, Monso-Hinard C, Juillard P, Morel P, Buurman WA, Grau GE (1998) Differential reactivity of brain microvascular endothelial cells to TNF reflects the genetic susceptibility to cerebral malaria. Eur J Immunol 28: 3989-4000. [DOI] [PubMed] [Google Scholar]
- Lou J, Lucas R, Grau GE (2001) Pathogenesis of cerebral malaria: recent experimental data and possible applications for humans. Clin Microbiol Rev 14: 810-820. [DOI] [PMC free article] [PubMed] [Google Scholar]
- McDonald WI, Miller DH, Barnes D (1992) The pathological evolution of multiple sclerosis. Neuropathol Appl Neurobiol 18: 319-334. [DOI] [PubMed] [Google Scholar]
- Medana IM, Chaudhri G, Chan-Ling T, Hunt NH (2001) Central nervous system in cerebral malaria: “innocent bystander” or active participant in the induction of immunopathology? Immunol Cell Biol 79: 101-120. [DOI] [PubMed] [Google Scholar]
- Medana IM, Hien TT, Day NP, Phu NH, Mai NT, Chu'ong LV, Chau TT, Taylor A, Salahifar H, Stocker R, Smythe G, Turner GD, Farrar J, White NJ, Hunt NH (2002) The clinical significance of cerebrospinal fluid levels of kynurenine pathway metabolites and lactate in severe malaria. J Infect Dis 185: 650-656. [DOI] [PubMed] [Google Scholar]
- Millan JM, San Millan JM, Munoz M, Navas E, Lopez-Velez R (1993) CNS complications in acute malaria: MR findings. AJNR Am J Neuroradiol 14: 493-494. [PMC free article] [PubMed] [Google Scholar]
- Nagahiro S, Goto S, Korematsu K, Sumi M, Takahashi M, Ushio Y (1994) Disruption of the blood-cerebrospinal fluid barrier by transient cerebral ischemia. Brain Res 633: 305-311. [DOI] [PubMed] [Google Scholar]
- Newcomb R, Pierce AR, Kano T, Meng W, Bosque-Hamilton P, Taylor L, Curthoys N, Lo EH (1998) Characterization of mitochondrial glutaminase and amino acids at prolonged times after experimental focal cerebral ischemia. Brain Res 813: 103-111. [DOI] [PubMed] [Google Scholar]
- Newton CR, Crawley J, Sowumni A, Waruiru C, Mwangi I, English M, Murphy S, Winstanley PA, Marsh K, Kirkham FJ (1997) Intracranial hypertension in Africans with cerebral malaria. Arch Dis Child 76: 219-226. [DOI] [PMC free article] [PubMed] [Google Scholar]
- Newton CR, Hien TT, White N (2000) Cerebral malaria. J Neurol Neurosurg Psychiatry 69: 433-441. [DOI] [PMC free article] [PubMed] [Google Scholar]
- Patankar TF, Karnad DR, Shetty PG, Desai AP, Prasad SR (2002) Adult cerebral malaria: prognostic importance of imaging findings and correlation with postmortem findings. Radiology 224: 811-816. [DOI] [PubMed] [Google Scholar]
- Pellerin L, Magistretti PJ (2004) Neuroenergetics: calling upon astrocytes to satisfy hungry neurons. The Neuroscientist 10: 53-62. [DOI] [PubMed] [Google Scholar]
- Petito CK, Chung MC, Verkhovsky LM, Cooper AJ (1992) Brain glutamine synthetase increases following cerebral ischemia in the rat. Brain Res 569: 275-280. [DOI] [PubMed] [Google Scholar]
- Piguet PF, Da Laperrousaz C, Vesin C, Tacchini-Cottier F, Senaldi G, Grau GE (2000) Delayed mortality and attenuated thrombocytopenia associated with severe malaria in urokinase- and urokinase receptor-deficient mice. Infect Immun 68: 3822-3829. [DOI] [PMC free article] [PubMed] [Google Scholar]
- Qiao M, Meng S, Scobie K, Foniok T, Tuor UI (2004) Magnetic resonance imaging of differential gray versus white matter injury following a mild or moderate hypoxic-ischemic insult in neonatal rats. Neurosci Lett 368: 332-336. [DOI] [PubMed] [Google Scholar]
- Rae C, McQuillan JA, Parekh SB, Bubb WA, Weiser S, Balcar VJ, Hansen AM, Ball HJ, Hunt NH (2004) Brain gene expression, metabolism, and bioenergetics: interrelationships in murine models of cerebral and noncerebral malaria. FASEB J 18: 499-510. [DOI] [PubMed] [Google Scholar]
- Saavedra-Lozano J, Booth TN, Weprin BE, Ramilo O (2001) Isolated cerebellar edema and obstructive hydrocephalus in a child with cerebral malaria. Pediatr Infect Dis J 20: 908-911. [DOI] [PubMed] [Google Scholar]
- Sager TN, Laursen H, Fink-Jensen A, Topp S, Stensgaard A, Hedehus M, Rosenbaum S, Valsborg JS, Hansen AJ (1999) N-acetylaspartate distribution in rat brain striatum during acute brain ischemia. J Cereb Blood Flow Metab 19: 164-172. [DOI] [PubMed] [Google Scholar]
- Saleh A, Wiedermann D, Schroeter M, Jonkmanns C, Jander S, Hoehn M (2004) Central nervous system inflammatory response after cerebral infarction as detected by magnetic resonance imaging. NMR Biomed 17: 163-169. [DOI] [PubMed] [Google Scholar]
- Sanni LA (2001) The role of cerebral oedema in the pathogenesis of cerebral malaria. Redox Rep 6: 137-142. [DOI] [PubMed] [Google Scholar]
- Sanni LA, Rae C, Maitland A, Stocker R, Hunt NH (2001) Is ischemia involved in the pathogenesis of murine cerebral malaria? Am J Pathol 159: 1105-1112. [DOI] [PMC free article] [PubMed] [Google Scholar]
- Sun Y, Schmidt NO, Schmidt K, Doshi S, Rubin JB, Mulkern RV, Carroll R, Ziu M, Erkmen K, Poussaint TY, Black P, Albert M, Burstein D, Kieran MW (2004) Perfusion MRI of U87 brain tumors in a mouse model. Magn Reson Med 51: 893-899. [DOI] [PubMed] [Google Scholar]
- Taylor TE, Fu WJ, Carr RA, Whitten RO, Mueller JS, Fosiko NG, Lewallen S, Liomba NG, Molyneux ME, Mueller JG (2004) Differentiating the pathologies of cerebral malaria by postmortem parasite counts. Nat Med 10: 143-145. [DOI] [PubMed] [Google Scholar]
- Taylor-Robinson AW (1995) Murine models of cerebral malaria: a qualified defence. Parasitol Today 11: 407-409. [DOI] [PubMed] [Google Scholar]
- Thumwood CM, Hunt NH, Clark IA, Cowden WB (1988) Breakdown of the blood-brain barrier in murine cerebral malaria. Parasitology 96: 579-589. [DOI] [PubMed] [Google Scholar]
- Turner G (1997) Cerebral malaria. Brain Pathol 7: 569-582. [DOI] [PMC free article] [PubMed] [Google Scholar]
- van der Toorn A, Sykova E, Dijkhuizen RM, Vorisek I, Vargova L, Skobisova E, van Lookeren Campagne M, Reese T, Nicolay K (1996) Dynamic changes in water ADC, energy metabolism, extracellular space volume, and tortuosity in neonatal rat brain during global ischemia. Magn Reson Med 36: 52-60. [DOI] [PubMed] [Google Scholar]
- van Gelderen P, de Vleeschouwer MH, DesPres D, Pekar J, van Zijl PC, Moonen CT (1994) Water diffusion and acute stroke. Magn Reson Med 31: 154-163. [DOI] [PubMed] [Google Scholar]
- Viola A, Nicoli F, Denis B, Confort-Gouny S, Le Fur Y, Ranjeva JP, Viout P, Cozzone PJ (2004) High cerebral scyllo-inositol: a new marker of brain metabolism disturbances induced by chronic alcoholism. Magma 17: 47-61. [DOI] [PubMed] [Google Scholar]
- White NJ, Warrell DA, Looareesuwan S, Chanthavanich P, Phillips RE, Pongpaew P (1985) Pathophysiological and prognostic significance of cerebrospinal-fluid lactate in cerebral malaria. Lancet 1: 776-778. [DOI] [PubMed] [Google Scholar]