

Abstract
We conducted electrophysiological recording and microstimulation experiments to test the hypothesis that the middle temporal visual area (MT) plays a direct role in perception of the speed of moving visual stimuli. We trained rhesus monkeys on a speed discrimination task in which monkeys chose the faster speed of two moving random dot patterns presented simultaneously in spatially segregated apertures. In electrophysiological experiments, we analyzed the activity of speed-tuned MT neurons and multiunit clusters during the discrimination task. Neural activity was correlated with the monkeys' behavioral choices on a trial-to-trial basis (choice probability), and the correlation was predicted by the speed-tuning properties of each unit. In microstimulation experiments, we activated clusters of MT neurons with homogeneous speed-tuning properties during the same speed discrimination task. In one monkey, microstimulation biased speed judgments toward the preferred speed of the stimulated neurons. Together, evidence from these two experiments suggests that MT neurons play a direct role in the perception of visual speed. Comparison of psychometric and neurometric thresholds revealed that single and multineuronal signals were, on average, considerably less sensitive than were the monkeys perceptually, suggesting that signals must be pooled across neurons to account for performance.
Keywords: MT, speed, choice probability, microstimulation, neurometric threshold, training effects
Introduction
Cortical processing of motion in the primate visual system involves a specialized pathway beginning in striate cortex (V1), through extrastriate middle temporal (MT; V5) and medial superior temporal areas (MST), and terminating in higher areas of the parietal and temporal lobes (for review, see Britten, 2003). However, the specific neural mechanism of speed perception is poorly understood. Some evidence supports a role for MT in speed perception. For example, lesions of MT and MST can impair performance on speed discrimination tasks and pursuit tasks (Newsome et al., 1985; Dursteler and Wurtz, 1988; Newsome and Pare, 1988; Yamasaki and Wurtz, 1991; Pasternak and Merigan, 1994; Schiller and Lee, 1994; Orban et al., 1995). The MT complex in normal human subjects is more active during a speed discrimination task than during other visual discrimination tasks (Corbetta et al., 1990, 1991; Beauchamp et al., 1997; Huk and Heeger, 2000) (but see Sunaert et al., 2000). Stimulus speed modulates the activity of most MT neurons (Maunsell and van Essen, 1983; Felleman and van Essen, 1987; Rodman and Albright, 1987; Lagae et al., 1993; Cheng et al., 1994; Perrone and Thiele, 2001), and this modulation appears, at least in some cases, to be caused by the speed of the stimulus, per se, rather than by separable spatial and temporal frequency components of the stimulus (Perrone and Thiele, 2001; Priebe et al., 2003). Finally, recent studies have shown that population activity elicited in MT by a pursuit target is well correlated with the initial speed of a pursuit eye movement (Priebe et al., 2001).
In the present study, we used two approaches to investigate how neural activity in MT is related to psychophysical judgments of speed. We first measured single-unit (SU) and multiunit (MU) activity in MT while monkeys performed a spatial two-alternative, forced-choice (2-AFC) speed discrimination task. The data reveal that trial-to-trial fluctuations in neural activity are correlated with the monkeys' speed judgments in a manner predictable from the speed-tuning properties of the recorded neurons. This “choice probability” (Britten et al., 1996) implies a close relationship between MT activity and speed perception. However, in contrast to previous studies of direction selectivity (Britten et al., 1992), we found that the overall sensitivity of MT neurons to small changes in stimulus speed is considerably less than psychophysical sensitivity. Thus, MT neurons may contribute to motion computation in different ways depending on the exact motion feature that matters for a particular task. We also observed an increase in the proportion of “high-pass” neurons, which provide the most sensitive information over the range of speeds that our monkeys discriminated.
In a second set of experiments, we applied microstimulation pulses to clusters of speed-tuned MT neurons during the same speed discrimination task. In one animal, microstimulation systematically biased perceptual judgments toward the preferred speed of the stimulated neurons, demonstrating a direct, causal link between MT activity and speed perception in this animal. Considered together, our results suggest an important functional role for MT in speed perception.
Materials and Methods
Monkey maintenance and surgery. We conducted extracellular recordings in three hemispheres of two macaque monkeys (Macaca mulatta), one male and one female. Before the experiments, the monkeys were surgically implanted with a head-holding device and recording cylinder (Crist Instrument, Hagerstown, MD) and a scleral search coil (CNC Engineering, Seattle, WA) for monitoring eye position. All implanted devices were magnetic resonance imaging compatible. Surgical, animal care, and experimental procedures conform to guidelines established by the National Institutes of Health.
Visual stimuli. During each experimental session, the monkey was seated in a primate chair with its head fixed. The monkey viewed visual stimuli on a cathode-ray tube monitor at a distance of 57 cm. Visual stimuli were drawn with a visual stimulus generator graphics board (Cambridge Research Systems, Kent, UK); the refresh rate of the monitor was 160 Hz.
In both behavioral tasks described below, the visual stimuli were highluminance random dots on a black background. The monkey was required to fixate on a central fixation spot while viewing the visual stimuli peripherally. The size of each dot was ∼0.2 × 0.2°, and the dot density of the stimulus at a given moment in time was 0.6 dots/degree2. To maintain a constant dot density, each moving dot that left the aperture reentered from the other side at a random location. The fixation spot was a small white cross (0.3 × 0.3°).
In the speed discrimination task (below), we used two versions of the random dot stimuli. In the “standard” condition, the exact starting positions of the dots were randomized from trial to trial so that the exact same visual stimulus was never repeated within an experiment, thus rendering it impossible for the monkeys to perform the task by memorizing spatial features of the stimuli. In the “no variance” condition, the exact same visual stimulus was used for each trial type. This condition was used to ensure that our results were robust against trial-to-trial variation in the spatial features of the visual stimuli, but we used it rarely to discourage the monkeys from attending to consistent spatial features of the stimuli.
Eye movements were measured throughout each experiment using the scleral search coil technique. The monkey was required to maintain fixation within a 2 × 2° window centered on the fixation cross. Trials in which the monkey broke fixation before the end of the stimulus presentation were deemed error trials and discarded. The monkey received a liquid reward after each successful trial.
Behavioral tasks. To measure direction or speed-tuning curves, we trained the monkeys to perform a simple fixation task. At the beginning of each trial, a small fixation cross appeared. After the monkey fixated the cross, moving random dots appeared for 1 s inside a circular aperture (Fig. 1 A). The monkey received a juice reward for maintaining fixation throughout the stimulus presentation.
Figure 1.

Schematic illustration of the behavioral tasks. A, Fixation task. The arrow indicates the direction of dot movement. B, Spatial 2-AFC speed discrimination task. In the actual displays viewed by the monkeys, the visual stimuli were white dots presented on a dark background. The circles surrounding the apertures are for illustration only and were not present on the visual display. The dashed arrow indicates saccadic eye movement.
The primary behavioral task was a spatial 2-AFC speed discrimination task (Fig. 1 B). At the beginning of each trial, a small fixation cross appeared. After the monkey fixated the cross, two groups of moving random dots appeared inside two circular apertures for 1 s. The two apertures were always positioned symmetrically around the fixation cross. In each trial, all dots moved in the same direction, and dots within each aperture all moved with uniform speed. In most trials, the speed differed slightly between the two stimulus apertures. After the visual stimulus disappeared, a target (1 × 1°) appeared at the centers of each aperture, and after the fixation spot was extinguished, the monkey was required to indicate which group of dots moved faster by making a saccadic eye movement to the corresponding target (Fig. 1 B). The monkeys received a juice reward at the end of each correct trial. The speed difference between the two apertures varied from trial to trial, and different trial types were randomly interleaved.
Each experiment (also called “a block”) usually contained nine trial types. In one trial type, the two speeds were equal (called the “reference speed”). For the other eight trial types, we chose four pairs of speeds. In one condition within each pair, the speeds in the two apertures differed from the reference speed by the same percentage but with opposite signs (one slower, one faster). In the other condition, the same two speeds were simply reversed between the two apertures. The four pairs of stimuli spanned a range of speed differences to measure psychophysical threshold in each experiment. We will frequently plot psychophysical performance or neural responses as a function of “percentage speed difference,” which we define to be the difference between the two speeds divided by the slower speed.
Given this experimental design, the faster speed appeared inside or outside the receptive field (RF) of the recording site on equal numbers of trials. Also, this design ensured that no single speed was presented more often than the rest to help minimize the chance that the monkey might use the most frequently seen stimulus as an “internal” standard of reference. Use of an internal standard could defeat the aims of our experiment by permitting the monkey to attend to only one of the two stimuli on each trial. Reference speeds ranged from 3 to 40°/s, and the monkeys were trained to perform the discrimination for all motion directions and for a wide range of stimulus aperture locations.
Figure 2 A illustrates behavioral data from a representative experiment. The ordinate is the percentage of trials in which the monkey reported that the dots in the RF were faster, and the abscissa is the percentage difference between the speeds of the stimuli inside and outside the RF: positive numbers indicate that the speed in the RF was faster, and negative number indicate that the speed in the RF was slower. We fitted the data (smooth curve) with a logistic regression of the following form: y = 1/(1 + e-a-b·x) (Eq. 1), where b reflects the steepness of the curve (the “slope” at the inflection point), and a represents the y intercept in the linear form of the logistic fit. The speed difference at which the monkey chooses the two alternatives with equal frequency is given by -a/b. Intuitively, this is a measure of the monkey's spatial choice bias. In the absence of any spatial bias, a = 0 and hence a/b = 0, meaning that the monkey chooses the targets with equal frequency when the speeds are equal in the two apertures.
Figure 2.

A, Psychophysical performance in one block of trials. The plot depicts the percentage of trials in which the monkey indicated that the speed in MT RF was faster as a function of the speed difference between the two apertures (relative to the slower speed of the two). Positive speed differences indicate that the stimulus inside the MT RF moved faster; negative speed differences indicate the converse. Perceptual threshold was 12.4% speed difference in this block. The reference speed for this experiment was 16°/s. B, The MU speed-tuning curve of the MT site under study while the monkey produced the behavioral data in A. The preferred speed is 76.8°/s. The arrow indicates the reference speed, and the gray box indicates the range of speeds used in the discrimination task. C, The direction-tuning curve of the same site, with a preferred direction of 289°. The dashed line indicates the spontaneous activity.
We defined discrimination threshold as the absolute value of percentage difference between the two speeds that supported performance that was 75% correct. In practice, we calculated (from the logistic fit) the percentage speed difference for which the monkey chose the speed in the RF as faster 25% of the time and 75% of the time (Fig. 2 A, arrows) and took the average absolute value to be threshold.
We imposed two criteria on the behavioral data before accepting an experiment into our database. First, we tested the goodness of the logistic fit using a χ2 test, with the null hypothesis being no relationship between the psychophysical data and the speed difference between the two stimuli (i.e., the logistic regression fits the data no better than a horizontal straight line) (Press et al., 1992). Because this null hypothesis is rather lenient, we imposed a stringent criterion (p = 0.001) for rejecting it. The monkeys' behavior was well described by logistic regression in most cases. In our current dataset of 232 experiments, none of 149 recording experiments and only 9 of 83 microstimulation experiments were rejected by this criterion; these experiments were excluded from additional analysis. To further ensure that psychophysical performance was under good stimulus control and that thresholds were measured accurately, we also excluded any sessions in which the fitted psychophysical curve failed to reach 75% correct for the largest speed differences used in the experiment. In microstimulation sessions, we applied this second criterion only to data obtained on nonstimulated trials (large microstimulation effects can generate substantial deviations from “normal” psychophysical performance). By this criterion, an additional 19 microstimulation experiments and eight recording experiments to measure choice probability were rejected. Thus, our final database consisted of 141 recording experiments and 55 microstimulation experiments. All of the 141 recording experiments contributed to the choice probability analysis: 72 experiments for Figure 5C and 29 for Figure 5D, whereas 40 served as “no stimulus variance” controls (see Visual stimuli). The “no variance” control data did not contribute to the comparison of psychophysical and neural performance (see Fig. 10).
Figure 5.

Computation of choice probabilities. A, Average firing rates and the SEs for the same experiment depicted in Figure 2 A. The MU speed- and direction-tuning curves for this site are shown in Figure 2, B and C. B, Distributions of firing rates for one trial type, in which the speed in RF was 7% slower than the speed outside RF (A, arrow). The two distributions (upward vs downward bars) are segregated on the basis of the monkey's decision on each trial. C, Frequency histogram of choice probabilities for sites in which the reference speed was positioned on the ascending shoulders of the tuning curves. The solid bars indicate sites for which the choice probability is significantly different from 0.5. The mean is 0.524 (n = 72 sites). D, Frequency histogram of choice probabilities for sites in which the reference speed was positioned on the descending shoulders of the tuning curves. The mean is 0.491 (n = 29 sites).
Figure 10.

A, Frequency histogram of the relationship between neurometric and psychometric thresholds across all experiments. Data are depicted as threshold ratios (neuronal/psychophysical, N//P) and plotted in logarithmic scale for convenient visualization. Solid bars indicate SUs; the rest are MUs. B, Population psychometric (black data points and black curve) and neurometric (gray data points and gray curve) performance for the two monkeys. The mean and SE of psychometric performance and neurometric performance was plotted at each speed difference, and the population data were fitted with logistic regression.
Recording cylinder locations and data collection. We used tungsten microelectrodes with impedance of ∼1 MΩ (measured at 1k Hz; Frederick Haer Company, Bowdoinham, ME), introduced to the cortex through a transdural guide tube positioned within a plastic grid inside the recording cylinder. Microelectrodes traversed MT in a posterior to anterior trajectory, crossing V1 and the lunate sulcus before reaching MT.
The depth of the electrode in the brain was controlled by a hydraulic microdrive (Narishige, Tokyo, Japan). Neural voltage signals were amplified, filtered (500 Hz to 6 kHz) (early experiments, Bak Electronics, Mount Airy, MD; late experiments, Plexon, Dallas, TX), and stored on disk for off-line analysis. In our MU recordings, a “neural event” was considered to be any deflection of the voltage trace above an arbitrarily determined amplitude threshold within a fixed time window. This threshold was set manually so that the spontaneous activity in the absence of a visual stimulus was between 50 and 100 events/s when recording with the Bak Electronics system (DeAngelis and Newsome, 1999; Liu and Newsome, 2003). SU activity was recorded mostly using the Plexon system. When using the Plexon system, we first set a threshold manually that passed all visible SU waveforms. We then isolated individual SUs by template matching. We also recorded MU activity simultaneously, which was defined as any deflection of the voltage trace that passed the threshold.
In the following data analysis, we considered the response to a visual stimulus to be the average firing rate during the 1 s stimulus presentation. When analyzing simultaneously recorded MU and SU activity, we excluded the SU spikes from the stream of MU events. This ensured independence of the MU and SU measurements (see Results).
Experimental procedure and data analysis: tuning measurements. For each SU or MU recording, we first used an interactive stimulus presentation program to assess qualitatively the location and size of the RF and the preferred direction and speed of the recorded neuron(s). Because our study concerns the role of MT in speed perception, we only studied SU or MU sites that passed a quantitative criterion for speed tuning. To evaluate each potential recording site, we placed the center of the random dot stimulus on the center of the RF and adjusted the size of the stimulus to match the size of the RF. We then recorded responses to 10 speeds ranging from 0.3 to 76.8°/s (nine of the speeds were evenly spaced on a log scale, and the 10th was 60°/s) while setting the direction of dot motion at the preferred direction of the site. In a separate block, we assessed direction tuning by measuring responses to eight directions at 45° intervals while setting the dot speed at the preferred value. Within each block, trials were pseudorandomly interleaved, and each condition was repeated five times.
For each site, we first confirmed its speed tuning using a one-way ANOVA (with speed as the main factor) and a criterion of p < 0.01. Sites that appeared speed tuned in qualitative examination were almost always significantly tuned by the ANOVA test. For each site, we fitted the speed responses with a smoothing cubic spline function (Shikin and Plis, 1995). We defined the speed that corresponded to the peak of the fitted tuning curve as the “preferred” speed. An example of a speed-tuning curve is shown in Figure 2 B. This MU site is high-pass, because its response increased monotonically across the range of speeds tested.
We fitted polar-tuning curves to the direction data using the method of von Mises (Mardia, 1972). We defined the preferred direction of the site to be the direction that corresponded to the peak of the fitted tuning curve. To assess the significance of direction tuning, we used a one-way ANOVA (with direction as the main factor) and a criterion of p < 0.01. By this criterion, direction tuning was significant at 254 of 277 sites where direction-tuning data were obtained. Figure 2C shows the direction-tuning curve of the same site shown in Figure 2B. To collect combined psychophysical and physiological data, we studied each SU or MU site that passed our criterion for speed tuning whether or not that site passed the criterion for direction tuning. For nondirection-tuned sites, we set the direction of dot motion (for the psychophysical task) to the peak of the fitted von Mises curve even though this choice was essentially arbitrary.
Experimental procedure and data analysis: choice probability and neurometric functions. For the combined psychophysical and physiological experiments, we positioned one aperture to fit the RF of the SU or MU and set dot motion to be in the preferred direction of the SU or MU (even if the site was not significantly direction tuned). The reference speed was chosen to be on the steepest part of the speed-tuning curve where the sensitivity of the unit should be maximal. For example, when measuring neurometric threshold and choice probability at the site shown in Figure 2 B, the monkey discriminated speeds at approximately a reference speed of 16°/s. The percentage differences between the two discriminated speeds were evenly spaced and were chosen so that the monkey's overall performance was ∼75% correct within each block. Each trial type was usually repeated 20 or 30 times, and we recorded neural responses from the start of fixation to stimulus offset.
To calculate choice probability, we first normalized the firing rates during stimulus presentation in individual trials by the mean response and the SD for that trial type. We then combined normalized data from all trial types and placed them into two distributions: one in which the monkey reported that the dots in the RF were faster (the IN trials) and one in which the monkey reported that the dots outside the RF were faster (the OUT trials). To exclude unacceptably noisy estimates of choice probability (CP) from our analysis, we included data from a trial type only if there were at least three correct trials and three incorrect trials for this trial type. We then calculated a choice probability for each recording site using methods derived from signal detection theory (Green and Swets, 1966; Britten et al., 1996). A receiver-operating-characteristic (ROC) curve was computed from the two distributions described above, and the area under the ROC curve (the choice probability) was measured. This area corresponds to the probability that an ideal observer could predict the decision that the monkey will make on each trial given one random draw from the overall distribution of normalized firing rates. If the IN and OUT response distributions are identical, the choice probability is 0.5, indicating that the ideal observer would perform at chance level. If the two distributions are nonoverlapping, the choice probability is 1, meaning that the ideal observer would perform perfectly.
To test whether a given choice probability was significantly different from 0.5, we performed a permutation test. For each iteration of the permutation test for a particular recording site, we randomly assigned trials as IN and OUT (preserving the same percentages as in the actual data) to calculate a choice probability. This procedure was repeated 2000 times to establish a distribution of choice probabilities under the null hypothesis of no correlation between behavioral choice and firing rates. The actual choice probability measured in the experiment was considered significant if it was >95% of the simulated choice probabilities generated in the permutation test.
We used a similar ideal observer model to calculate a neurometric threshold from the same dataset. We assumed that for each recorded site, an equivalent site exists in MT of the opposite hemisphere with identical mean responses and variance to the same stimulus set. We further assumed that in the spatial 2-AFC task, an ideal observer compares the firing rates of these two sites on each trial to form a decision about which speed is faster. Within each block, we separated trials into groups by the speed difference between the two apertures, for example, trials in which the two speeds differed by 7%. We then separated firing rates in each group into two distributions: one in which the speed in the RF was faster, the other in which the speed outside of the RF was faster (see Fig. 9 A, B). We calculated the degree of separation between these two distributions by computing the area under an ROC curve obtained from the two distributions (see Fig. 9B, 0.575). This value is equivalent to the proportion of trials on which an ideal observer would correctly identify the faster speed given a random sample from each response distribution (Green and Swets, 1966).
Figure 9.

Calculation of a neurometric function. Data are from the same recording site illustrated in Figure 5. A, The behavioral performance for this block (same as Fig. 2 A). The two stimulus conditions, indicated by arrows (one when IN was 7% faster and the other when IN was 7% slower), were used to illustrate the calculation of neurometric threshold in B. B, Frequency histograms of firing rates. Upward bars show data when the faster stimulus was inside the RF; downward bars show the converse. A signal detection analysis of these distributions (area under an ROC curve; see Materials and Methods) revealed that for this speed difference, the neuron could support discrimination performance of 57.5% correct by an ideal observer. C, Discrimination performance computed (as in A) for an ideal observer as a function of the speed difference between the apertures. Data points at mirror symmetric locations about zero (speed difference) are by definition identical. The arrow indicates the data point derived from the response distributions in A.
We repeated this calculation at each speed difference and used the results to plot neurometric curves like the one illustrated in Figure 9C. Each data point on the curve is the percentage of trials in which the speed in RF is predicted to be faster based on firing rates. These neurometric curves have the same form as the psychometric curves obtained from the monkey on the same set of trials. As for the psychometric data, we fitted the neurometric curves using logistic regression. By definition, the curve is symmetric around 0, 0.5. We considered neurometric sensitivity to be captured by the threshold calculated from this fitted function (Eq. 1). In Figure 9C, for example, the threshold was 23.9% speed difference. To compare neurometric to psychometric (N/P) sensitivity, we calculated the N/P ratio for each recording site (the ratio of neurometric to psychometric thresholds). An N/P ratio of 1 indicates that the MT site is as sensitive as the monkey's psychophysical performance; higher N/P ratios indicate MT sites that were less sensitive relative to performance.
For a control analysis presented in Results, we also calculated neurometric thresholds from MU and SU speed-tuning curves acquired in previous experiments while monkeys performed a fixation task (Liu and Newsome, 2003). Because these speed-tuning curves were sampled relatively coarsely compared with the psychophysical experiments in this study, we interpolated mean firing rates and variances between actual data points to estimate these values at intermediate speeds. We used the fitted speed-tuning curve to estimate the mean response, and we estimated the corresponding response variance from variance-to-mean plots of the recorded data, assuming linearity (on a log scale) between variance and mean (Britten et al., 1993). We then assumed a normal distribution of firing rates associated with each estimate of response variance. Using these estimates of mean response, variance, and shape of the response distribution, we generated simulated data and computed neurometric thresholds (as described above) for a series of reference speeds distributed along the entire speed-tuning curve. Thus, the lowest threshold calculated was taken to be the threshold for this MT site, and the speed corresponding to the lowest threshold was deemed the best speed for discrimination for this site.
Experimental procedure and data analysis: microstimulation. To select microstimulation sites, we qualitatively assessed the direction and speedtuning properties of MU activity at intervals of 100 μm along each penetration through MT. We positioned the stimulating electrode in the middle of a 200-300 μm segment of cortex in which the speed- and direction-tuning properties varied minimally. The monkey performed the same perithreshold 2-AFC speed discrimination task as described above. During half of the trials, selected randomly, microstimulation was applied concurrently with presentation of the visual stimuli. Each combination of visual stimulus and electrical stimulation condition (stimulus and no-stimulus) was usually repeated 20 times. We used biphasic, constant-current stimulation (Master 8; A.M.P.I., Jerusalem, Israel; Frederick Haer Company). Each pulse consisted of a 0.2 ms cathode current followed by a 0.1 ms interval and a 0.2 ms anodal current. The stimulating frequency was 200 Hz for monkey Y. For monkey C, approximately half of the experiments were done with 200 Hz and the rest with 500 Hz. No difference was observed in the data obtained with these two frequencies, and we therefore combined the data for later analysis. We used three current levels (20, 50, or 100 μA), all of which yielded qualitatively similar results.
We fitted the psychometric data using the logistic expression of Equation 1. Separate fits were obtained for stimulated and nonstimulated trials. Using a χ2 test, we determined whether the two curves differed significantly in horizontal position along the abscissa or in slope. For both tests, our criterion for statistical significance was p = 0.05 (Press et al., 1992).
Results
Behavior
Figure 3 depicts average discrimination thresholds as a function of reference speed for the two monkeys. Our reference speeds ranged from 3-40°/s, and we grouped them into five bins for the purposes of the plot in Figure 3. Previous studies of human subjects showed that speed discrimination thresholds plotted in this manner form a U-shaped curve, with the lowest thresholds generated for reference speeds between 8 and 60°/s (Orban et al., 1984; De Bruyn and Orban, 1988). As with human subjects, the lowest thresholds generated by our monkeys occurred for reference speeds between 10 and 40°/s. Because 40°/s was the highest reference speed we used, we could not determine whether monkeys' threshold curve also has the pronounced rising side of the U curve seen in human studies. Note that discrimination thresholds of the two monkeys differed significantly, with monkey C's thresholds being approximately half of those of monkey Y at speeds between 10 and 20°/s. This difference was evident at the beginning of the training and persisted throughout the training and experimental periods over a total duration of more than a year. We therefore believe that the data reflect a real difference in perceptual sensitivity between the two monkeys rather than insufficient training of monkey Y. There was little or no systematic variation in thresholds over the relatively modest range of eccentricities and aperture sizes we used, and neither did thresholds vary as a function of the direction of the moving dots.
Figure 3.

Summary of psychophysical thresholds in the speed discrimination task for the two monkeys. We binned the large range of reference speeds used during the experiments into five groups. The plots show the mean threshold and SE for each bin.
Correlation between MT activity and speed judgments measured by choice probability
The choice probability, defined originally by Britten et al. (1996), describes a trial-to-trial covariation between perceptual judgments and the stochastic responses of cortical neurons. Using a psychophysical task in which monkeys discriminated between opposite directions of motion, Britten et al. (1996) noticed that when an identical perithreshold motion stimulus was presented to an animal repeatedly, the trial-to-trial fluctuations in the responses of single MT neurons permitted an observer to predict with better-than-chance accuracy the psychophysical judgments of the animal. This covariation between neural activity and perceptual judgments, which has been observed subsequently in other psychophysical contexts as well (Dodd et al., 2001; Parker et al., 2002; Uka and DeAngelis, 2004a), was taken to be a strong indication that the recorded neuron contributed to the psychophysical decision process. We therefore analyzed our data to determine whether a similar relationship exists between the activity of MT neurons and speed judgments (see Materials and Methods).
Our analysis differs from previous ones in that we searched for choice probability in both MU and SU recording data. Britten, Shadlen, and their colleagues suggested originally that the choice probability is likely to result from correlated noise within the pool of sensory neurons that contributes to the perceptual decision (Shadlen et al., 1996). If this is so, and if the sensory signals derive from spatially localized clusters of neurons within the cortex, the choice probability should be evident in MU recordings as well.
Importantly, in a just noticeable-difference (JND) psychophysical task like ours, the predicted value of the choice probability depends on where the reference speed falls on the speedtuning curve of the unit(s) under study. For example, Figure 4 illustrates the three canonical types of speed-tuning curves observed in MT (bandpass, high-pass, and low-pass), and the arrows labeled 1-4 represent four possible choices of reference speed at the points of maximum sensitivity on the three tuning curves, two for the bandpass curve and one each for the high-pass and low-pass curves. Because the preferred speed of the bandpass neuron is higher than reference speed 1, we would expect higherthan-average responses to be associated with the perception of a faster speed in the MT receptive field (with respect to the stimulus presented in the control aperture). For reference speed 2, however, the preferred speed of the neuron is lower than the reference speed, and we would thus expect higher-than-average responses to be associated with the perception of a slower speed in the MT receptive field. Note that this prediction applies regardless of the particular algorithm by which speed is “read out” from MT (winner-take-all or some form of vector averaging). In either case, a high firing rate will tend to “pull” the psychophysical judgment toward the preferred speed of the neuron(s) under study. By similar logic, for high-pass sites, a higher-than-average response from the neuron(s) under study should always be associated with perception of a higher speed in the MT receptive field (reference speed 3), and the converse effect should obtain for low-pass sites (reference speed 4).
Figure 4.

A schematic diagram of canonical MT speed-tuning curves (bandpass, high-pass, and low-pass) and how the relationship between firing rates and behavioral judgments could be predicted based on the positions of reference speeds (arrows) relative to the preferred speeds (see Results).
Figure 5, A and B, illustrates a measurement of choice probability for a single stimulus condition for the high-pass MU site for which tuning curves are shown in Figure 2. In this experiment, we specified the reference speed to be 16°/s, near the point of maximum sensitivity on the ascending slope of the tuning curve. As usual, all motion stimuli were 100% coherent dot patterns moving in the preferred direction of the recorded neurons. Figure 2A shows the monkey's psychophysical performance in this experiment, whereas Figure 5A depicts the average firing rates measured for each of the nine stimulus conditions. Figure 5B depicts two frequency histograms illustrating the neural responses obtained on each trial for a single perithreshold stimulus condition indicated by the arrow in Figure 5A (the speed in the RF was 7% slower than the speed outside the RF; performance, 60% correct). The two response distributions correspond to trials in which the monkey incorrectly judged the motion stimulus in the RF to move faster (upward bars) and trials in which the monkey correctly judged RF motion to be slower (downward bars). As predicted for high-pass sites, the neurons generally yielded larger responses on trials in which the monkey judged the speed in the RF to be faster. Quantification (see Materials and Methods) revealed a choice probability of 0.81 for this stimulus condition, an unusually high value that we chose for illustrative purposes. This value is significantly larger than 0.5 (permutation test; p < 0.001). To increase statistical power, we normalized and combined measurements across all stimulus conditions for this recording site (see Materials and Methods), and the choice probability for the site was 0.582 (significantly >0.5; permutation test, p < 0.002).
Figure 5C illustrates choice probabilities measured at 72 sites (23 MUs in monkey C; 9 SUs and 40 MUs in monkey Y) with the reference speed positioned on the ascending shoulder of the speed-tuning curve (both high-pass and bandpass sites). The choice probability distributions did not differ between the two monkeys (t test; p = 0.46), nor did they differ between SU and MU in monkey Y (t test; p = 0.41). We therefore combined SU and MU data from the two animals in Figure 5C. As predicted, the mean choice probability is significantly larger than 0.5 (mean, 0.524; t test, p < 10-5), indicating a reliable association between high firing rates and perceptual judgments of faster speed across the data base. Of the 13 sites with individually significant choice probabilities (significantly different from 0.5), 12 were larger than 0.5 (10 from MU and 2 from SU, approximately the same proportion to the total MU and SU sites).
We also measured choice probability with reference speeds on descending shoulders of tuning curves (Fig. 5D), but unfortunately our data base for such sites is not nearly as extensive (n = 29 sites). As predicted, the choice probability for these sites tended toward values <0.5 (18 of 29 sites <0.5; 62.1%), and the distribution in Figure 5D fell significantly to the left of the distribution in Figure 5C (bootstrap test; p < 10-5). However, the mean of the distribution (0.491) was not significantly different from 0.5 (t test; p = 0.18). We deliberately searched for low-pass sites to enrich our database of choice probability measurements for this condition, but we experienced substantial difficulty in finding such sites. Potential reasons for this are discussed below (Possible training effects on speed tuning).
Controls
At least two extraneous factors could potentially cause artifactual choice probabilities in our study: the structure of the visual stimulus and spatial attention. Here, we assess the effects of each in turn.
To exclude position cues from our visual stimuli, the exact structure of each specific stimulus varied from trial-to-trial in all of the experiments reported thus far (see Materials and Methods). Although all dots moved at the specified speed, the variation in the exact position of individual dots, when convolved with the response profile of a specific receptive field (Britten et al., 1996), could lead to trial-to-trial fluctuations in neural responsiveness. If such stimulus-driven response variations were interpreted by the monkey as variations in stimulus speed, a significant choice probability could result. To test this possibility, we recorded from 40 sites in one monkey using precisely the same random dot patterns for each stimulus condition (the no variance stimulus condition; see Materials and Methods). The speed discrimination was performed on the ascending shoulder of the tuning curve at all of these 40 sites. Of these 40 experiments, 29 yielded choice probabilities >0.5, and the mean of the distribution (0.514) was >0.5 (t test; p < 0.01). Thus, the result in Figure 5C cannot be attributed solely to variability in the structure of the visual stimuli.
The second potential confound is attention, which is known to elevate the firing rates of MT neurons with receptive fields at the attended location (Treue and Maunsell, 1996, 1999; Seidemann and Newsome, 1999; Recanzone and Wurtz, 2000; Cook and Maunsell, 2002a; Martinez-Trujillo and Treue, 2002, 2004). In a spatial 2-AFC task like the one used in this study, we might have expected the monkey to pay more attention to the location of faster dots during stimulus presentation, because this location would be the target of an upcoming saccade. If attention amplified responses at the attended location, an artifactual choice probability could result, with higher firing rates being associated with judgments of faster speed. Importantly, however, this sort of artifact would predict choice probabilities of the same sign (>0.5) regardless of the position of the reference speed with respect to the speed-tuning curve. Judgments of faster speed should always be associated with higher responses, in direct contradiction to our hypothesis based on speed-coding considerations (Fig. 4) and to the data in Figure 5D. [Recall that enhanced activity should be associated with judgments of slower speed when the reference speed is on the falling arm of the tuning curve, reference speeds 2 and 4 (Fig. 4).] We conclude, therefore, that attention alone cannot account for the choice probabilities in Figure 5, although it is possible that our observation reflected a combination of perception and attention effects.
Time course of the choice probability
In the preceding analysis, choice probabilities were computed from the average firing rates during the entire period of stimulus presentation. To obtain estimates of the time course of the choice probability, we combined data across sites that yielded individually significant effects in the preceding analysis, including the no variance condition. Thus, our data base for the time course analysis consists of 19 sites with significant effects in the predicted direction, 12 from Figure 5C, two from Figure 5D, and five from no variance data. Because the predicted values of the choice probability deviate in different directions from 0.5 for these two groups, we reflected the values of the two significant effects in Figure 5D ∼0.5 before computing the time course from the combined data (i.e., CP 0.4 becomes CP 0.6). In practice, for these two cells, we simply reversed the labels on the two choice groups (IN judged faster or OUT judged faster) to make the direction of the choice probability effect consistent with the other 12 cells. (In the Discussion, we use the labeling convention appropriate for the largest group of cells; firing rates are expected to be higher when the RF aperture is judged to contain faster motion.)
We normalized spike counts by the peak response for each stimulus condition tested for these 19 sites, with the proviso (as before) that the monkey made at least three correct choices and three errors at each stimulus condition. We binned the spike counts from each trial into 50 ms bins and averaged the spike counts across stimuli and across cells for the two psychophysical choice conditions (IN or OUT judged faster). Figure 6 plots the mean and SE of firing rates for the two choice conditions in a series of overlapping 50 ms time bins. The firing rates for the two choice conditions diverged immediately after stimulus onset, and the difference became maximal ∼300 ms after stimulus onset and remained more or less constant until the end of the trial. (The dip near 450 ms in the difference plot was driven by a few cells from one monkey and was not characteristic of the dataset as a whole.) These dynamics are similar to those reported for choice probability in previous studies (Britten et al., 1996; Dodd et al., 2001; Cook and Maunsell, 2002b; Uka and DeAngelis, 2004a).
Figure 6.

Time course of firing rates underlying the choice probability. Firing rates of each stimulus (Stim.) condition were normalized by the peak response for that condition and combined across all conditions and all cells with a significant choice probability of the predicted sign (see Results). The thickness of the shaded curves depicts one SE on each side of the mean. The dark curve represents trials in which monkeys chose the speed inside the RF as faster; the light curve represents trials in which monkeys chose the speed outside the RF as faster. The dashed line (and the axis on the right) is the difference of the two curves (IN - OUT). Each data point was calculated with a time bin of 50 ms; a sliding bin was incremented in 10 ms intervals to produce the plots. Time 0 is the onset of visual stimulus. The first bin includes spikes from -500 to -450 ms, and the data point is plotted at -450 ms (before stimulus onset). Thus, the data points are positioned at the right edge of each bin.
Microstimulation
The choice probability documented in the previous section provides correlative evidence for a relationship between neural activity in MT and perceptual judgments of speed. We sought to establish causality in this relationship by electrically stimulating clusters of speed-tuned MT neurons while the monkey performed our speed discrimination task. Microstimulation has been used successfully to demonstrate causal relationships between MT activity and the perception of motion direction (Salzman et al., 1990, 1992) and stereo disparity (DeAngelis et al., 1998). Microstimulation seemed less likely to work in the domain of speed perception, however, because MT lacks the well-organized columns for speed (Liu and Newsome, 2003) that are present for direction and binocular disparity (Albright et al., 1984; DeAngelis and Newsome, 1999). Nevertheless, the modest spatial clustering of speed-tuned neurons in MT provided some reason for optimism.
If speed-tuned MT neurons indeed contribute to perception in our speed discrimination task, we predicted that microstimulation would bias the monkey's judgments toward the preferred speed of the stimulated neurons. Figure 7 demonstrates such an effect for one microstimulation site in monkey Y. In this experiment, we stimulated a cluster of neurons that responded optimally to a speed of 25°/s while the monkey discriminated speed differences were approximately a reference speed of 5°/s. The plot depicts the percentage of trials in which the monkey judged the stimulus in the RF to move faster as a function of the speed difference between the two apertures. In accordance with our prediction, microstimulation of this site shifted perceptual judgments of the stimulus in the RF toward higher speeds, resulting in a leftward shift of the psychometric function (Fig. 7, dashed curve). The leftward shift of the stimulated curve was equivalent to a 54.2% difference in the speeds of the two stimulus apertures (shift >0; p < 0.01). This leftward shift of the curve, which reflects a systematic bias in speed judgments, can be understood as the point of “subjective” equivalence, the speed difference at which the two apertures appeared to contain equivalent speeds when MT was being stimulated. In this experiment, therefore, microstimulation yielded a percept in which the speed appeared to be 54.2% faster than it actually was.
Figure 7.

An example microstimulation effect produced at one MT site. The black data points and solid curve show the monkey's behavioral choices in the absence of microstimulation; the gray data points and the dashed curve show choices in the presence of microstimulation. Axis conventions are as in Figure 2 A.
Figure 8A depicts the results from 24 microstimulation experiments in monkey Y. Positive shifts of the psychometric function indicate a shift toward the preferred speed of the stimulation site regardless of whether the reference speed was higher or lower than the preferred speed. Thus, microstimulation may bias judgments toward higher speeds in some experiments and toward lower speeds in others. On average, the psychometric functions shifted, relative to the speed outside of the RF, by 8.1% toward the preferred speeds of the stimulated sites, and this average shift was significantly >0 (t test; p < 0.01). Of the seven sites that yielded individually significant effects (solid bars), all shifted toward the preferred speed (five sites with reference speed higher than the preferred speed of the site, two with reference speed lower than the preferred speed of the site).
Figure 8.
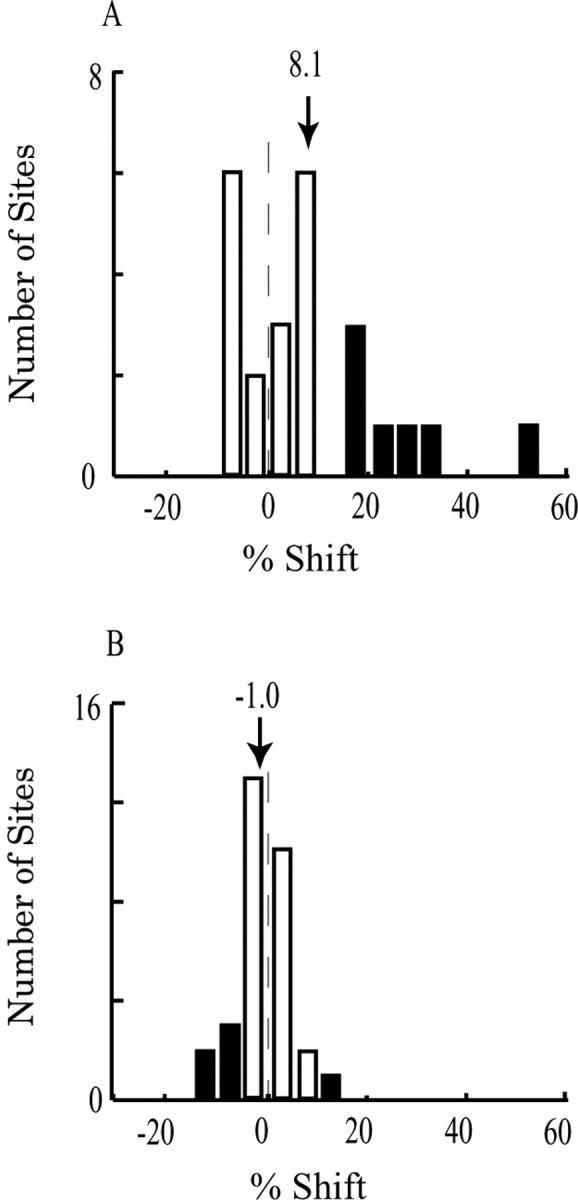
Frequency histogram of microstimulation effects. Solid bars indicate sites for which effects were significantly different from 0. A, Effects in monkey Y (n = 24 sites). The mean shift of 8.1% indicates that microstimulation caused the monkeys to report speeds that were, on average, 8.1% closer to the preferred speed of the stimulation site. The effects could reflect either an increase in perceived speed (when the speed inside the RF was slower than the preferred speed of the stimulation site) or a decrease in perceived speed (when the speed inside the RF was faster than the preferred speed of the stimulates site). B, Absence of microstimulation effects in monkey C (n = 31 sites).
Considering the two types of stimulation sites separately (reference speed higher or lower than the preferred speed of the site), the results trended in the expected directions, with both effects hovering near statistical significance. For the 19 sites in which the reference speed was lower than the preferred speed, perceptual judgment shifted toward higher speeds as expected (mean leftward shift, 7.0%; t test, p = 0.04). Although our sample of stimulation sites with the reference speed on the falling limb of the tuning curve was small (n = 5), the monkey clearly tended to judge the speed as slower on stimulated trials at these sites (mean rightward shift, 12.6%; p = 0.06). For monkey Y, therefore, we conclude that the activity of speed-tuned neurons in MT causes predictable shifts in the speed judgments of the animal.
We used three different current levels over the course of these experiments (20, 50, and 100 μA) and obtained similar results with each. Effects tended to be larger with increasing current levels, consistent with a previous study that quantitatively measured the effects of microstimulation at various current levels (Murasugi et al., 1993), but the trend in our data was not statistically significant. However, the highest stimulation current did cause an increase in psychophysical threshold (14 sites; mean increase, 6.1%; t test, p < 0.03), again consistent with the previous study by Murasugi et al. (1993). This presumably reflects increased noise in the system as the higher amplitude current affects clusters of neurons with substantially different tuning properties (Salzman et al., 1992; Murasugi et al., 1993).
Microstimulation failed to bias speed judgments in monkey C (Fig. 8B). Across 31 microstimulation sites in this animal, the mean shift of the psychometric function was -1.0%, which was not different from 0 (t test; p = 0.33). The level of the stimulating current did not change the result. Why did microstimulation fail to influence speed judgments in this monkey? As indicated above, we have shown previously that speed-tuned neurons are less well organized spatially than are direction- and disparity-tuned MT neurons (Liu and Newsome, 2003), which may well account for the smaller overall effects of microstimulation on speed judgments relative to those on direction and disparity judgments. Interestingly, comparison of the speed-tuning data for the two monkeys used in the current study reveals a difference that might account for the divergent microstimulation results. For each MU site where a speed-tuning curve was measured, we calculated a tuning index, which captures the depth of modulation of neural activity caused by presentation of the preferred speed compared with the least preferred speed (Liu and Newsome, 2003). Higher MU tuning indices should reflect relatively homogeneous speedtuning properties of the single neurons that contribute to the MU signal. Lower MU tuning indices, in contrast, might reflect heterogeneity of speed-tuning properties in the vicinity of the electrode tip or simply poorer speed tuning overall. We found that the tuning index in monkey C was indeed lower than that in monkey Y (t test, p < 0.02; mean tuning index, 0.76, n = 107 sites in monkey C; mean tuning index, 0.84, n = 202 sites in monkey Y), consistent with the notion that speed-tuned neurons are less well organized spatially in MT of monkey C. We also noticed that the width of bandpass speed-tuning curves is larger in monkey C than in monkey Y (mean, 3.25 octave, n = 37 in monkey C; mean, 2.64, n = 83 in monkey Y; t test, p < 10-4). For a detailed description of width calculation, see the study by Liu and Newsome (2003).
Comparison of neurometric and psychometric thresholds
Using the same electrophysiological data described above for choice probability measurements, we also computed neurometric thresholds (see Materials and Methods) (Fig. 9) to compare neural and psychophysical sensitivity to small speed differences. Such measurements provide important constraints for models purporting to link neural activity to performance.
Figure 10A shows the distribution of ratios of neurometric to psychometric thresholds (N/P ratio) across our database of the same MU and SU recording sites that we used to calculate choice probability (n = 99; two sites were excluded from this analysis because the neurometric threshold was erroneous, possibly because the discriminating speeds were on a flat part of the tuning curve). Consistent with previous findings using JND paradigms like our speed discrimination task (Snowden et al., 1992; Prince et al., 2000), the mean N/P ratio in Figure 10A is substantially greater than unity (4.34 in linear scale), indicating that at most of our recording sites, neural sensitivity to small speed differences fell considerably short of psychophysical sensitivity. Only the very best recording sites yielded N/P ratios close to 1. As shown in Figure 3, average psychophysical sensitivity was different for the two monkeys, with monkey C having significantly lower perceptual thresholds. This psychophysical difference was mirrored by a similar difference in neural sensitivity: the mean perceptual threshold for monkey C is 16.1% (SE = 1.2%), and for monkey Y it is 33.2 ± 1.5%; the mean neurometric threshold and SE is 70.4 ± 9.0% for monkey C, and 108 ± 16.6% for monkey Y. We also fitted the combined behavioral and neuronal data from all experiments with logistic regression, and the neurometric and psychometric thresholds derived from such “composite” data were also higher for monkey Y than for monkey C (Fig. 10B).
Our physiological data differ from most previous comparisons of psychophysical and neuronal performance in that the bulk of our measurements are from MU sites rather than from SUs. It is not immediately clear how MU and SU measurements should be related. MU measurements could result in inappropriately low estimates of neural sensitivity if they sample from an inhomogeneous population of neurons, resulting in broader, shallower tuning curves. In contrast, MU measurements might yield estimates of neural sensitivity that are enhanced relative to SU measurements if the noisiness inherent in the firing of single neurons is to some extent averaged in the MU signal.
To evaluate this issue, we compared SU and MU measurements of neural sensitivity directly by calculating neural thresholds from an extensive database of MU and SU speed-tuning curves that we collected in a previous study (Liu and Newsome, 2003). To make a paired comparison, we specifically analyzed recording sites for which we obtained SU and MU data simultaneously (SU spikes were eliminated from the MU data to ensure independence of the datasets). For each of these recording sites, we used signal detection methods to compute neural threshold at a number of points on the speed-tuning curve (see Materials and Methods) and selected the lowest threshold as the threshold of the site. MU and SU thresholds were comparable in both monkeys used in the previous study; therefore, we combined data from both monkeys. The mean threshold computed from MU data was 79.5% speed difference (SE = 3.6%; n = 34 MU/SU pairs), whereas the mean SU threshold was 81.4% speed difference (SE = 4.1%). The distributions of MU and SU thresholds were statistically indistinguishable (Wilcoxon signed rank test; p = 0.39). In the current study, we had only 10 MU/SU pairs during speed discrimination sessions and cannot make a statistically sound comparison.
Therefore, in the specific context of our speed-tuning study, it appears that similar estimates of neural sensitivity are obtained whether the analysis is performed on SU or MU data. In retrospect, this is perhaps not terribly surprising. Our previous study showed that MU speed-tuning curves compared favorably in width and selectivity to SU-tuning curves recorded simultaneously (Liu and Newsome, 2003). In addition, our current reexamination of that dataset reveals that Fano factor measurements (variance-to-mean ratio) are similar for the MU and SU speed responses (on a logarithmic scale, Fano factor = 1.07 for MU, with an SE of 0.002; Fano factor = 1.10 for SU, with an SE of 0.02), indicating that basic signal-to-noise properties of the two measurements are similar. However, although SU and MU approaches clearly yield similar estimates of neural sensitivity in this specific study, one cannot assume that this will necessarily be the case for studies involving different aspects of the neural response.
Possible training effects on speed tuning
Speed-tuned neurons in MT are conventionally classified into three major categories according to their tuning properties: bandpass, high-pass, and low-pass neurons (Lagae et al., 1993). In our previous study of speed tuning in naive monkeys (trained only to fixate), using the same video hardware and software as in the present study, we found that the ratio of high-pass, bandpass, and low-pass sites were 21:63.4:7.5% (Liu and Newsome, 2003). These percentages were similar in the two monkeys used in the preceding study, one of which (monkey C) was also used in the present study after an extended period of training on the psychophysical task.
During the present study, however, we encountered a far higher percentage of high-pass sites than we expected based on our previous results. In monkey C, for example, we measured speed-tuning curves at 119 sites, obtaining 70 high-pass sites, only 37 bandpass sites, and three low-pass sites (58.8:31.1:2.5%). The tuning properties observed in monkey Y in the current study were very similar to the posttraining properties in monkey C: 55.4% high-pass, 38.6% bandpass, and 0.5% low-pass; 215 sites total). It is conceivable that the shift toward high-pass tuning properties in the current study is an artifact of sampling error, but this seems unlikely given our relatively large datasets and the fact that one monkey was common in the two studies. Therefore, it seems possible that the shift in tuning properties was actually induced by training on the psychophysical task.
If this plastic change is real, it would suggest that high-pass neurons are more important for speed discrimination than bandpass neurons over the range of speeds that our monkeys discriminated: 3-40°/s. Two aspects of our physiological data provide support for this view. First, the mean preferred speed of the highpass sites was 64.3°/s (SD = 19.1), meaning that the steepest portion of these tuning curves generally fell in the range over which our monkeys performed (Fig. 2B). By comparing the responses of these neurons to those of high-pass neurons in the opposite hemisphere (coding the other spatial aperture), the monkey could obtain a very sensitive differential measure of speed in the two apertures (see Materials and Methods). In contrast, the mean preferred speed of the bandpass sites was 13.8°/s (SD = 7.9). Therefore, much of the range between 3 and 40°/s is occupied by the broad, flat peaks of these tuning curves, which do not provide a sensitive signal for speed. Second, we combined choice probability data from Figure 5, C and D, and regrouped data by whether a site was high-pass or bandpass. Choice probabilities were larger for high-pass sites (0.530; n = 53) than for bandpass sites (0.508; n = 45), a difference that was statistically significant (t test; p < 0.01). (We reflected the values of ∼0.5 for sites where the reference speeds were larger than the preferred speeds so that, for example, a choice probability of 0.4 would become 0.6, just as we did in the computation of time course.) This difference comprises direct evidence for a differential role of these tuning groups in speed perception.
Discussion
The primary goal of this study was to determine whether the activity of speed-tuned MT neurons is linked directly to perceptual judgments of speed. Using a spatial 2-AFC speed discrimination task, we made two new observations that, together, strongly support such a relationship: the presence of significant choice probabilities in MU activity in both monkeys and the causal effect of microstimulation on speed judgments in one of the monkeys.
Choice probability
Significant choice probabilities demonstrate a trial-to-trial covariation between neural activity and psychophysical judgments that is predictable from the physiological properties of the recorded neurons. In the current study, perceptual judgments of faster speed within the RF were correlated with higher firing rates at recording sites with the preferred speed greater than the reference speed (Fig. 5C). As expected, choice probabilities trended in the opposite direction when the preferred speed was lower than the reference speed (Fig. 5D); higher firing rates tended to be associated with judgments of slower speed within the RF. The overall distribution of choice probabilities obtained under these two conditions was significantly different (Fig. 5, compare C, D), although the choice probability values under the latter condition were not statistically <0.5. This lack of a significant effect in Figure 5D may result from the small sample size or from the fact that bandpass sites have smaller choice probability than highpass sites in general (Fig. 5C reflects a mixture of high-pass and bandpass sites; Fig. 5D has no high-pass sites and is dominated by bandpass sites).
Our control experiments show that the choice probabilities we observed are not attributable solely to variations in the visual stimulus or to variations in visual attention between the two stimulus apertures. We note, however, that our control experiments cannot rule out all possible artifactual sources of covariation; any hidden variable that might influence both the decision and cell-firing rates could in principle generate a choice probability. Thus, although trial-to-trial covariations between behavioral choice and neural activity are quite impressive, one cannot draw firm conclusions about causal relationships based on this evidence alone.
Analysis of dynamics (Fig. 6) revealed that the choice probability arose with short latency after stimulus onset and reached its peak at ∼300 ms into the trial. The rapid onset is consistent with a feedforward origin, reflecting a direct influence of sensory signals from MT on speed judgments. Our observations and interpretation agree with previously published studies of choice probability in the context of direction and disparity discrimination; correlated variability in the early responses of MT neuron biases perithreshold decisions toward one or the other alternative in a predictable manner (Britten et al., 1996; Dodd et al., 2001; Cook and Maunsell, 2002b; Uka and DeAngelis, 2004a). Although our data are consistent with a feedforward interpretation, we cannot exclude the possibility that the choice probability results in part from feedback mechanisms as well. Potential sources of feedback would include the decision process itself and interactions with other cortical areas also involved in perceptual judgments of speed (Corbetta et al., 1990, 1991; Beauchamp et al., 1997; Orban et al., 1998; Huk and Heeger, 2000; Sunaert et al., 2000).
Our study is unique thus far in demonstrating the existence of choice probability in MU recordings, and we have observed recently choice probability in local field potential (LFP) recordings as well (Liu and Newsome, 2004). This finding supports the prevailing hypothesis that choice probability arises from correlated response variability that is shared among a pool of neurons carrying sensory signals that inform the decision (Britten et al., 1996; Shadlen et al., 1996). Simultaneous recordings from pairs of MT neurons have demonstrated correlations of the appropriate size and time course in MT area (Zohary et al., 1994; Bair et al., 2001), and the existence of choice probability in our MU data strongly suggests that these correlations are common to the entire local pool of neurons that contribute to the MU signal.
It is not easy to predict in principle the relative magnitude of the choice probability for SU and MU recordings (we observed no difference in our limited sample) (Uka and DeAngelis, 2004b). If the MU signal approximates the sum of action potentials from a few neurons, choice probabilities should be higher in MU than in SU data, because the MU signal would incorporate more of the spikes that contribute to the perceptual decision. Simple summation also predicts lower neurometric thresholds for MUs than SUs in the discrimination task (because summing signals from similarly tuned SUs should lower the signal-to-noise ratio), which contradicts our experimental observations and another study (Uka and DeAngelis, 2004b). It seems likely, therefore, that the MU signal is not a simple summation of SU action potentials but might incorporate additional voltage sources such as synaptic potentials and afterhyperpolarization, rendering interpretation of the MU signal substantially more complex. For now, we suggest that MU (or LFP) choice probability should be used in the same way that SU choice probability has been used to date, as a qualitative indicator of an important relationship between sensory signals and perceptual decisions. Use of MU choice probability as a quantitative tool should be undertaken only with care to the issues described above.
N/P ratio
Several studies have reported that the sensitivity of single MT neurons commonly approximates that of the perceiving animal (Britten et al., 1992; Celebrini and Newsome, 1994; Uka and DeAngelis, 2003), in contrast to the high N/P ratios observed in the current study. The difference may arise from at least two sources. First, the previous studies typically required animals to discriminate between alternatives that were separated considerably in stimulus space but were degraded by noise. Britten et al. (1992), for example, trained monkeys to discriminate between opposite directions of motion but degraded the motion signal by varying the ratio of coherently moving dots to randomly moving dots in the visual stimulus. In contrast, our speed discrimination task is a JND task in which the discriminanda are very closely apposed in stimulus space. Previous reports using JND and detection tasks, like our current study, found that only the best MT neurons approximate the sensitivity of the psychophysical observer (Snowden et al., 1992; Prince et al., 2000; Cook and Maunsell, 2002b).
Second, the studies that found equal performance for single neurons and monkeys often used somewhat longer stimulus presentation time (1.5-2 s), whereas the studies that observed unequal performance tended to use shorter presentation times. Longer stimulus presentation times certainly lead to more optimistic estimates of neural performance, because the firing rate of a near-Poisson spike train can be estimated more accurately over longer measurement intervals. It seems unlikely, however, that the difference in stimulus presentation times can account completely for the differences in N/P ratio of the two groups of studies. To test this, we calculated the neurometric thresholds for 213 cells that were used by Britten et al. (1992), using the first 500, 1000, 1500, and 2000 ms of stimulus presentation. We found that the average neurometric threshold increased only mildly with the reduction of stimulus presentation time (2000 ms, 14.3% coherence; 1500 ms, 16.0%; 1000 ms, 18.6%; 500 ms, 26.5%). This represents only a 30% change in average neural threshold from 2000 to 1000 ms, which falls considerably short of explaining the average N/P ratio of 4.34 in the current study. In addition, Britten et al. (1992) showed that the psychophysical threshold of human observers rose with decreased viewing times, which would reduce even further the impact of viewing time on N/P ratio. We therefore conclude that JND task design is more likely to cause the high N/P ratios observed in the current study and in previous studies with a similar design.
Microstimulation
In one of our two monkeys, we were able to demonstrate a convincing effect of electrical microstimulation on perceptual judgments of speed; microstimulation biased speed estimates toward the preferred speed of the stimulated neuronal cluster (Fig. 8A). Therefore, in this monkey, MT clearly played a causal role in generating psychophysical judgments of speed. We failed to demonstrate such an effect in a second monkey (Fig. 8B) for reasons that are unclear. In principle, microstimulation can fail for many reasons even if the target neurons indeed play a causal role in the psychophysical function under study. For example, a lack of clear columnar or clustered organization of tuned neurons could lead to negative microstimulation results. We have shown previously that speed-tuned neurons are less well organized spatially than are direction- and disparity-tuned MT neurons (Liu and Newsome, 2003), and our speed-tuning data suggest that the degree of organization is in fact poorer in the monkey that yielded negative results in the microstimulation experiment (see Results). Although this evidence is not definitive, it does suggest a possible explanation of the divergent microstimulation data.
Together, our choice probability and microstimulation data suggest strongly that MT is directly involved in speed perception. Future studies will be necessary to reveal the algorithms and synaptic mechanisms by which speed is actually computed.
Footnotes
We thank Jessica Powell for excellent technical assistance with behavioral training. We are also grateful to Gregory DeAngelis and Michael Shadlen for helpful discussion and to John Reppas and Jim Müller for helpful comments on this manuscript.
Correspondence should be addressed to Dr. Jing Liu, Department of Neurobiology, Stanford University School of Medicine, Fairchild Building, Room D209, Stanford, CA 94305. E-mail: jingliu@stanford.edu.
Copyright © 2005 Society for Neuroscience 0270-6474/05/250711-12$15.00/0
References
- Albright TD, Desimone R, Gross CG (1984) Columnar organization of directionally selective cells in visual area MT of the macaque. J Neurophysiol 51: 16-31. [DOI] [PubMed] [Google Scholar]
- Bair W, Zohary E, Newsome WT (2001) Correlated firing in macaque visual area MT: time scales and relationship to behavior. J Neurosci 21: 1676-1697. [DOI] [PMC free article] [PubMed] [Google Scholar]
- Beauchamp MS, Cox RW, DeYoe EA (1997) Graded effects of spatial and featural attention on human area MT and associated motion processing areas. J Neurophysiol 78: 516-520. [DOI] [PubMed] [Google Scholar]
- Britten K, Shadlen M, Newsome W, Movshon J (1992) The analysis of visual motion: a comparison of neuronal and psychophysical performance. J Neurosci 12: 4745-4765. [DOI] [PMC free article] [PubMed] [Google Scholar]
- Britten KH (2003) The middle temporal area: motion processing and the link to perception. In: Visual neurosciences, Ed 1 (Chalupa LM, Werner JS, eds). Cambridge, MA: MIT.
- Britten KH, Shadlen MN, Newsome WT, Movshon JA (1993) Responses of neurons in macaque MT to stochastic motion signals. Vis Neurosci 10: 1157-1169. [DOI] [PubMed] [Google Scholar]
- Britten KH, Newsome WT, Shadlen MN, Celebrini S, Movshon JA (1996) A relationship between behavioral choice and the visual responses of neurons in macaque MT. Vis Neurosci 13: 87-100. [DOI] [PubMed] [Google Scholar]
- Celebrini S, Newsome WT (1994) Neuronal and psychophysical sensitivity to motion signals in extrastriate area MST of the macaque monkey. J Neurosci 14: 4109-4124. [DOI] [PMC free article] [PubMed] [Google Scholar]
- Cheng K, Hasegawa T, Saleem KS, Tanaka K (1994) Comparison of neuronal selectivity for stimulus speed, length, and contrast in the prestriate visual cortical areas V4 and MT of the macaque monkey. J Neurophysiol 71: 2269-2280. [DOI] [PubMed] [Google Scholar]
- Cook EP, Maunsell JHR (2002a) Attentional modulation of behavioral performance and neuronal responses in middle temporal and ventral intraparietal areas of macaque monkey. J Neurosci 22: 1994-2004. [DOI] [PMC free article] [PubMed] [Google Scholar]
- Cook EP, Maunsell JH (2002b) Dynamics of neuronal responses in macaque MT and VIP during motion detection. Nat Neurosci 5: 985-994. [DOI] [PubMed] [Google Scholar]
- Corbetta M, Miezin FM, Dobmeyer S, Shulman GL, Petersen SE (1990) Attentional modulation of neural processing of shape, color, and velocity in humans. Science 248: 1556-1559. [DOI] [PubMed] [Google Scholar]
- Corbetta M, Miezin FM, Dobmeyer S, Shulman GL, Petersen SE (1991) Selective and divided attention during visual discriminations of shape, color, and speed: functional anatomy by positron emission tomography. J Neurosci 11: 2383-2402. [DOI] [PMC free article] [PubMed] [Google Scholar]
- DeAngelis GC, Newsome WT (1999) Organization of disparity-selective neurons in macaque area MT. J Neurosci 19: 1398-1415. [DOI] [PMC free article] [PubMed] [Google Scholar]
- DeAngelis GC, Cumming BG, Newsome WT (1998) Cortical area MT and the perception of stereoscopic depth. Nature 394: 677-680. [DOI] [PubMed] [Google Scholar]
- De Bruyn B, Orban GA (1988) Human velocity and direction discrimination measured with random dot patterns. Vision Res 28: 1323-1335. [DOI] [PubMed] [Google Scholar]
- Dodd JV, Krug K, Cumming BG, Parker AJ (2001) Perceptually bistable three-dimensional figures evoke high choice probabilities in cortical area MT. J Neurosci 21: 4809-4821. [DOI] [PMC free article] [PubMed] [Google Scholar]
- Dursteler MR, Wurtz RH (1988) Pursuit and optokinetic deficits following chemical lesions of cortical areas MT and MST. J Neurophysiol 60: 940-965. [DOI] [PubMed] [Google Scholar]
- Felleman DJ, van Essen DC (1987) Receptive field properties of neurons in area V3 of macaque monkey extrastriate cortex. J Neurophysiol 57: 889-920. [DOI] [PubMed] [Google Scholar]
- Green DM, Swets JA (1966) Signal detection theory and psychophysics, pp 30-52. New York: Wiley.
- Huk AC, Heeger DJ (2000) Task-related modulation of visual cortex. J Neurophysiol 83: 3525-3536. [DOI] [PubMed] [Google Scholar]
- Lagae L, Raiguel S, Orban GA (1993) Speed and direction selectivity of macaque middle temporal neurons. J Neurophysiol 69: 19-39. [DOI] [PubMed] [Google Scholar]
- Liu J, Newsome WT (2003) Functional organization of speed tuned neurons in visual area MT. J Neurophysiol 89: 246-256. [DOI] [PubMed] [Google Scholar]
- Liu J, Newsome WT (2004) How useful is the local field potential. Soc Neurosci Abstr 30: 301.7. [Google Scholar]
- Mardia KV (1972) Statistics of directional data, pp 57-69. London: Academic.
- Martinez-Trujillo JC, Treue S (2002) Attentional modulation strength in cortical area MT depends on stimulus contrast. Neuron 35: 365-370. [DOI] [PubMed] [Google Scholar]
- Martinez-Trujillo JC, Treue S (2004) Feature-based attention increases the selectivity of population responses in primate visual cortex. Curr Biol 14: 744-751. [DOI] [PubMed] [Google Scholar]
- Maunsell JHR, van Essen DC (1983) Functional properties of neurons in middle temporal visual area of the macaque monkey. I. Selectivity for stimulus direction, speed and orientation. J Neurophysiol 49: 1127-1147. [DOI] [PubMed] [Google Scholar]
- Murasugi CM, Salzman CD, Newsome WT (1993) Microstimulation in visual area MT: effects of varying pulse amplitude and frequency. J Neurosci 13: 1719-1729. [DOI] [PMC free article] [PubMed] [Google Scholar]
- Newsome WT, Pare EB (1988) A selective impairment of motion perception following lesions of the middle temporal visual area (MT). J Neurosci 8: 2201-2211. [DOI] [PMC free article] [PubMed] [Google Scholar]
- Newsome WT, Wurtz RH, Dursteler MR, Mikami A (1985) Deficits in visual motion processing following ibotenic acid lesions of the middle temporal visual area of the macaque monkey. J Neurosci 5: 825-840. [DOI] [PMC free article] [PubMed] [Google Scholar]
- Orban GA, De Wolf J, Maes H (1984) Factors influencing velocity coding in the human visual system. Vision Res 24: 33-39. [DOI] [PubMed] [Google Scholar]
- Orban GA, Saunders RC, Vandenbussche E (1995) Lesions of the superior temporal cortical motion areas impair speed discrimination in the macaque monkey. Eur J Neurosci 7: 2261-2276. [DOI] [PubMed] [Google Scholar]
- Orban GA, Dupont P, De Bruyn B, Vandenberghe R, Rosier A, Mortelmans L (1998) Human brain activity related to speed discrimination tasks. Experimental Brain Res 122: 9-22. [DOI] [PubMed] [Google Scholar]
- Parker AJ, Krug K, Cumming BG (2002) Neuronal activity and its links with the perception of multi-stable figures. Philos Trans R Soc Lond B Biol Sci 357: 1053-1062. [DOI] [PMC free article] [PubMed] [Google Scholar]
- Pasternak T, Merigan WH (1994) Motion perception following lesions of the superior temporal sulcus in the monkey. Cereb Cortex 4: 247-259. [DOI] [PubMed] [Google Scholar]
- Perrone JA, Thiele A (2001) Speed skills: measuring the visual speed analyzing properties of primate MT neurons. Nat Neurosci 4: 526-532. [DOI] [PubMed] [Google Scholar]
- Press WH, Flannery BP, Teukolsky SA, Vetterling WT (1992) Numerical recipes in C, Ed 2, pp 656-706. New York: Cambridge UP.
- Priebe NJ, Churchland MM, Lisberger SG (2001) Reconstruction of target speed for the guidance of pursuit eye movements. J Neurosci 21: 3196-3206. [DOI] [PMC free article] [PubMed] [Google Scholar]
- Priebe NJ, Cassanello CR, Lisberger SG (2003) The neural representation of speed in macaque area MT/V5. J Neurosci 23: 5650-5661. [DOI] [PMC free article] [PubMed] [Google Scholar]
- Prince SJ, Pointon AD, Cumming BG, Parker AJ (2000) The precision of single neuron responses in cortical area V1 during stereoscopic depth judgments. J Neurosci 20: 3387-3400. [DOI] [PMC free article] [PubMed] [Google Scholar]
- Recanzone GH, Wurtz RH (2000) Effects of attention on MT and MST neuronal activity during pursuit initiation. J Neurophysiol 83: 777-790. [DOI] [PubMed] [Google Scholar]
- Rodman HR, Albright TD (1987) Coding of visual stimulus velocity in area MT of the macaque. Vision Res 27: 2035-2048. [DOI] [PubMed] [Google Scholar]
- Salzman CD, Britten KH, Newsome WT (1990) Cortical microstimulation influences perceptual judgements of motion direction. Nature 346: 174-177. [DOI] [PubMed] [Google Scholar]
- Salzman CD, Murasugi CM, Britten KH, Newsome WT (1992) Microstimulation in visual area MT: effects on direction discrimination performance. J Neurosci 12: 2331-2355. [DOI] [PMC free article] [PubMed] [Google Scholar]
- Schiller PH, Lee K (1994) The effects of lateral geniculate nucleus, area V4, and middle temporal (MT) lesions on visually guided eye movements. Vis Neurosci 11: 229-241. [DOI] [PubMed] [Google Scholar]
- Seidemann E, Newsome WT (1999) Effect of spatial attention on the responses of area MT neurons. J Neurophysiol 81: 1783-1794. [DOI] [PubMed] [Google Scholar]
- Shadlen MN, Britten KH, Newsome WT, Movshon JA (1996) A computational analysis of the relationship between neuronal and behavioral responses to visual motion. J Neurosci 16: 1486-1510. [DOI] [PMC free article] [PubMed] [Google Scholar]
- Shikin EV, Plis AI (1995) Handbook on splines for the user, pp 11-45. Boca Raton, FL: CRC.
- Snowden R, Treue S, Andersen R (1992) The response of neurons in areas V1 and MT of the alert rhesus monkey to moving random dot patterns. Exp Brain Res 88: 389-400. [DOI] [PubMed] [Google Scholar]
- Sunaert S, Van Hecke P, Marchal G, Orban GA (2000) Attention to speed of motion, speed discrimination, and task difficulty: an fMRI study. NeuroImage 11: 612-623. [DOI] [PubMed] [Google Scholar]
- Treue S, Maunsell JH (1996) Attentional modulation of visual motion processing in cortical areas MT and MST. Nature 382: 539-541. [DOI] [PubMed] [Google Scholar]
- Treue S, Maunsell JH (1999) Effects of attention on the processing of motion in macaque middle temporal and medial superior temporal visual cortical areas. J Neurosci 19: 7591-7602. [DOI] [PMC free article] [PubMed] [Google Scholar]
- Uka T, DeAngelis GC (2003) Contribution of middle temporal area to coarse depth discrimination: comparison of neuronal and psychophysical sensitivity. J Neurosci 23: 3515-3530. [DOI] [PMC free article] [PubMed] [Google Scholar]
- Uka T, DeAngelis GC (2004a) Contribution of area MT to stereoscopic depth perception: choice-related response modulations reflect task strategy. Neuron 42: 297-310. [DOI] [PubMed] [Google Scholar]
- Uka T, DeAngelis GC (2004b) Simple pooling of neuronal responses does not improve depth discriminability. Soc Neurosci Abstr 30: 368.7. [Google Scholar]
- Yamasaki DS, Wurtz RH (1991) Recovery of function after lesions in the superior temporal sulcus in the monkey. J Neurophysiol 66: 651-673. [DOI] [PubMed] [Google Scholar]
- Zohary E, Shadlen MN, Newsome WT (1994) Correlated neuronal discharge rate and its implications for psychophysical performance. Nature 370: 140-143. [DOI] [PubMed] [Google Scholar]