Abstract
Endocannabinoid-mediated retrograde signaling exerts powerful control over synaptic transmission in many brain areas. However, in the neocortex, the precise laminar, cellular, and subcellular localization of the type 1 cannabinoid receptor (CB1) as well as its function has been elusive. Here we combined multiple immunolabeling with whole-cell recordings to investigate the morpho-functional characteristics of cannabinoid signaling in rat somatosensory cortex.
Immunostaining for CB1 revealed axonal and somatic labeling with striking layer specificity: a high density of CB1-positive fibers was seen in layers II-III, in layer VI, and in upper layer V, whereas other layers had sparse (layer IV) or hardly any (layer I) staining. Membrane staining for CB1 was only found in axon terminals, all of which contained GABA and formed symmetric synapses. Double immunostaining also revealed that CB1-positive cells formed two neurochemically distinct subpopulations: two-thirds were cholecystokinin positive and one-third expressed calbindin, each subserving specific inhibitory functions in cortical networks.
In addition, cannabinoid sensitivity of GABAergic input showed striking layer specificity, as revealed by both electrophysiological and anatomical experiments. We found a unique population of large pyramidal neurons in layer VB that received much less perisomatic innervation from CB1-expressing GABAergic axon terminals and, accordingly, showed no depolarization-induced suppression of inhibition, unlike pyramidal cells in layer II, and a population of small pyramidal cells in layer V. This suggests that inhibitory control of pyramidal cells involved in intracortical or corticostriatal processing is fine-tuned by activity-dependent endocannabinoid signaling, whereas inhibition of pyramidal cells relaying cortical information to lower subcortical effector centers often lacks this plasticity.
Keywords: cholecystokinin, DSI, GABA, interneurons, parvalbumin, retrograde signaling
Introduction
The anatomical and physiological characteristics of neuronal interactions in neocortical networks show a remarkable time- and location-dependent specificity (Somogyi et al., 1998; Gupta et al., 2000). Cell type-specific molecular expression patterns determine the characteristic physiological properties of these connections, which ensure the appropriate integration of specific cell types into complex networks responsible for coherent population activity patterns (Markram et al., 2004; Toledo-Rodriguez et al., 2004).
Among the numerous molecular constituents involved in shaping diverse synaptic or nonsynaptic interactions, endocannabinoids represent a novel class of signaling molecules that contribute to several forms of short- and long-term synaptic plasticity throughout the brain (for review, see Alger, 2002; Wilson and Nicoll, 2002; Freund et al., 2003; Diana and Marty, 2004). In the neocortex, retrograde signaling via endocannabinoids has been proposed to underlie short-term plasticity of GABAergic synapses (Trettel and Levine, 2003), as shown by the paradigm denoted depolarization-induced suppression of inhibition (DSI) (Pitler and Alger, 1992). Similarly, long-term depression at glutamatergic synapses in both the spike timing-dependent and subthreshold postsynaptic depolarization protocols has been suggested to involve endocannabinoids (Sjostrom et al., 2003, 2004). Considering the significant heterogeneity of interneurons and principal cell types in the cerebral cortex, as well as their diverse connectivity patterns (Kawaguchi and Kubota, 1997; Thomson and Bannister, 2003; Markram et al., 2004), one may ask how ubiquitous the participation of the endocannabinoid system is in shaping synaptic communication. Indeed, recent physiological experiments indicated that, in the neocortex, perisomatic inhibition was more susceptible to cannabimimetics than dendritic inhibition (Trettel et al., 2004), and synapses of fast-spiking, non-accommodating interneurons did not show endocannabinoid-dependent short-term plasticity (Harkany et al., 2004). These data suggest that a restricted molecular expression pattern may constrain cell type- and synapse-specific physiological differences.
Recent progress in studies of the molecular composition of the endocannabinoid system uncovered a considerable diversity in signaling molecules, receptors, and their interactions (Freund et al., 2003; Di Marzo et al., 2004). Nevertheless, gene deletion studies provided evidence that the CB1 cannabinoid receptor is responsible for most of the behavioral effects of administered cannabinoids (Ledent et al., 1999; Zimmer et al., 1999). Using in situ hybridization and autoradiography, the general distribution of CB1 receptor mRNA (Matsuda et al., 1993) and cannabinoid receptor binding sites (Herkenham et al., 1991) and its colocalization with some interneuron markers (Marsicano and Lutz, 1999) were described in the neocortex. However, to understand the functional roles of this receptor, the subcellular and laminar distribution of the receptor protein should be established at the site of action, i.e., on the membrane surface. Here we used multiple high-resolution immunolabeling to answer these questions. In addition, we performed electrophysiological recordings to verify the differences predicted by immunolabeling in the effects of both exogenous and endogenous cannabinoids on the inhibitory control of functionally distinct principal cell types.
Materials and Methods
Perfusion and preparation of tissue sections for anatomical experiments. Adult male Wistar rats (250-300 g; n = 20) and six mice (three wild-type and three CB1 knock-out) (Ledent et al., 1999) were deeply anesthetized with equitesin (4.2% w/v chloral hydrate, 2.12% w/v MgSO4, 16.2% w/w Nembutal, 39.6% w/w propylene glycol, and 10% w/w ethanol in H2O; 0.3 ml/100 g, i.p.) and then perfused (n = 13) with Zamboni's fixative containing 4% paraformaldehyde, 0.05% glutaraldehyde, and 15% v/v saturated aqueous solution of picric acid in 0.1 m phosphate buffer (PB), pH 7.4, and an additional rat was perfused using the same fixative but with 1% glutaraldehyde. Another four rats were processed for a sequential low pH/high pH perfusion (Berod et al., 1981) (called Berod's fixative), and two more animals were perfused using the same fixative but with high concentration of glutaraldehyde (1%). Fixatives containing high concentrations of glutaraldehyde were used to optimize postembedding immunostaining for GABA. Animals were perfused transcardially, first with 0.9% saline for 2 min, followed by 400 ml of Zamboni's fixative for 30 min, or the saline was followed by the first component of Berod's fixative, pH 6, for 5 min and the second component of Berod's fixative for 50 min, pH 8.5. Experiments were performed according to the guidelines of the Institutional Ethical Codex and the Hungarian Act of Animal Care and Experimentation (1998, XXVIII, section 243/1998), which is in full agreement with the regulation of animal experiments in the European Union. All efforts were made to minimize pain and suffering and to reduce the number of animals used.
After perfusion, the brain was removed from the skull, and coronal sections (60 μm thick) containing the somatosensory cortex were cut with a vibratome. The brain of four animals, three from the Berod's fixative group and one from the Zamboni's fixative group (both with low glutaraldehyde), were cut with a sliding microtome (20 μm).
Three methods were used to ensure good penetration. Sections used for electron microscopic analysis were incubated in sucrose (30%) overnight, followed by freeze thawing over liquid nitrogen three times. The 60-μm-thick sections used for double-fluorescence staining were incubated in blocking serum (3% bovine serum albumin) that contained 0.05% Triton X-100. Then, blocks from the two animals, which were cut with a sliding microtome, were incubated in sucrose overnight before the cutting and were freeze thawed on the microtome. Finally, sections were processed for either immunoperoxidase or for immunogold or double-immunofluorescence staining. All washes and dilutions of antisera were done in 0.05 m Tris-buffered saline (TBS), pH 7.4.
Immunoperoxidase staining. After extensive washes in PB (three times for 10 min) and TBS (three times for 10 min), the sections from the rats and the three wild-type and three knock-out mice were blocked in 3% bovine serum albumin and incubated in rabbit anti-CB1 (1:1000 and 1:5000 for the rat and the mice, respectively) or mouse anti-cholecystokinin (CCK) (1:5000) for a minimum of 48 h at 4°C (Table 1). After primary antibody incubations, the sections were treated with biotinylated anti-rabbit or anti-mouse IgG made in goat and then with avidin biotinylated-horseradish peroxidase complex (ABC) (1:300). Finally, the immunoperoxidase reaction was developed using 3, 3′-diaminobenzidine (DAB) as a chromogen. The sections were treated with 1% OsO4 in 0.1 m PB for 45 min, dehydrated in an ascending series of ethanol and propylene oxide, and embedded in Durcupan (ACM; Fluka, Buchs, Switzerland). During dehydration, the sections were treated with 1% uranyl acetate in 70% ethanol for 40 min.
Table 1.
Concentration and combinations of the primary antibodies used in the double-labeling immunofluorescence experiments
|
Primary antisera |
|
Primary antisera |
|
|---|---|---|---|
| Rabbit anti-CB1 receptor (1:500) | This study | Mouse anti-CCK (1:2000) | CURE: Digestive Diseases Research Center, University of California, Los Angeles, CA |
| Rabbit anti-CB1 receptor (1:500) | This study | Mouse anti-PV (1:1000) | Sigma |
| Rabbit anti-CB1 receptor (1:500) | This study | Mouse anti-VIP (1:10000) | Biogenesis, Kingston, NH |
| Rabbit anti-CB1 receptor (1:500) | This study | Mouse anti-CaBP (1:500) | Swant, Bellinzona, Switzerland |
| Rabbit anti-CB1 receptor (1:500) | This study | Mouse anti-CR (1:5000) | Swant |
| Rabbit anti-CB1 receptor (1:500) | This study | Rat anti-SOM (1:200) | Chemicon, Temecula, CA |
| Rabbit anti-CaBP (1:500) | Baimbridge et al., 1982 | Mouse anti-CCK (1:2000) | CURE: Digestive Diseases Research Center |
| Rabbit anti-VIP (1:2000) | Gulyas et al., 1990 | Mouse anti-CCK (1:2000) | CURE: Digestive Diseases Research Center |
| Rabbit anti-CaBP (1:500) |
Baimbridge et al., 1982
|
Rat anti-SOM (1:200) |
Chemicon |
The antibody concentrations used in this experiment, the combinations that were investigated, and the reference for the primary antibodies are shown. The specificity of the rabbit anti-CB1 in the cortex was confirmed in this study in CB1 knock-out animals. The specificity of the other antisera was confirmed by the laboratory or company of origin.
Preembedding immunogold staining for CB1 receptor. After extensive washes in PB (three times for 10 min) and TBS (three times for 10 min), the sections were blocked in 3% bovine serum albumin. After incubation in a rabbit antiserum against-CB1 (1:1000) antiserum, the sections were washed extensively in TBS and incubated in 1 nm gold-conjugated IgG (1 nm gold, goat anti-rabbit, 1:100; Aurion, Wageningen, The Netherlands) overnight at 4°C. After extensive washes in TBS and distilled water, the sections were silver intensified using the silver enhancement system (RPN 491; Amersham Biosciences, Little Chalfont, UK). The sections were treated with 1% OsO4 for 2 min, followed by 0.5% OsO4 at 4°C for 25 min, both in 0.1 PB. The sections were dehydrated and processed for electron microscopy as above.
Immunofluorescence colocalization experiments. After extensive washes in TBS, 20 and 60 μm sections were incubated in a blocking solution containing 3% bovine serum albumin and 0.05% Triton X-100 for the 60-μm-thick sections to ensure good penetration. Primary antibodies against CB1, CCK, parvalbumin (PV), vasoactive intestinal polypeptide (VIP), somatostatin (SOM), calretinin (CR), and calbindin (CaBP) were diluted in TBS and applied for 48 h at 4°C (Table 1 contains the pairs of antibodies and their concentrations that were used in these double-labeling experiments). As secondary antiserum, Alexa Fluor goat anti-rabbit antiserum was mixed with either the Alexa goat anti-mouse or goat anti-rat antisera (1:200 for each, 2 h). As a fluorescent secondary antibody, we have always used Alexa 488 (green) together with Alexa 594 (red). Finally, the sections were dried and covered by Vectashield (Vector Laboratories Burlingame, CA). We never observed autofluorescence in this cortical area.
Antibodies. The specificity of each primary and secondary antibody used in this study has been confirmed by the company or laboratory of origin (for details, see Table 1). In case of the CB1 receptor antibody, we demonstrated the specificity previously by showing the lack of immunostaining in the hippocampus (Hájos et al., 2000) of CB1 knock-out mice (Ledent et al., 1999), which has been confirmed for the neocortex in the present study (see Fig. 1C,D).
Figure 1.
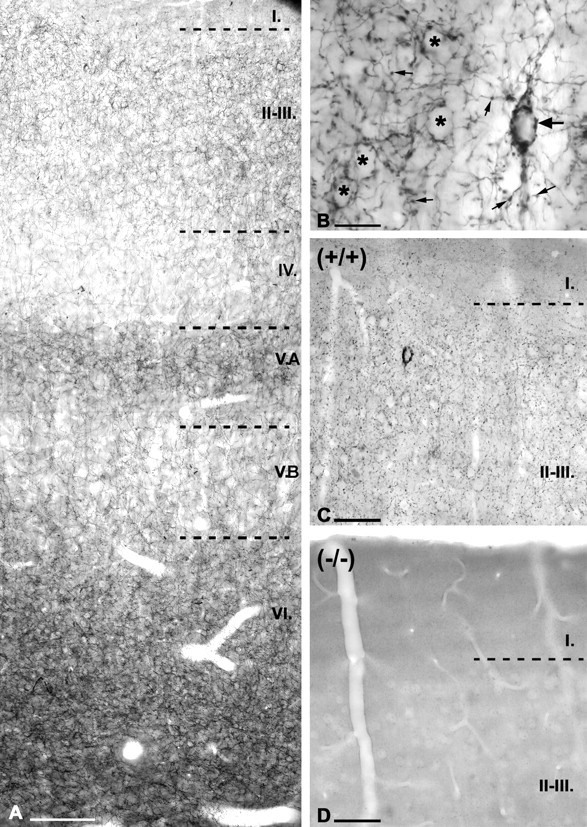
Distribution of CB1 cannabinoid receptors in the rat somatosensory cortex. A, Immunostaining of the rat somatosensory cortex for CB1 reveals axonal labeling in all layers with variable densities. The highest density of labeled fibers can be seen in layers VI, II-III, and VA. The apparently very high level of staining at the bottom of layer VI is primarily attributable to darker background of well contrasted myelinated fibers leaving the cortex. Analysis shows that this layer is labeled similarly to layer II (see also Fig. 8). Immunostained axons are sparse in layer VB and layer IV, whereas layer I has only negligible labeling (C). B, Both synaptic varicosities (small arrows) and preterminal, thin axon segments show strong CB1 immunostaining immunostaining, as seen in the higher-power micrograph of layers II-III. A large number of varicosities surround the CB1-negative somata of pyramidal cells (asterisks in B) in a basket-like manner. CB1-immunoreactive large cell bodies show the characteristics of interneurons (large arrows). C, CB1-immunopositive axons delineate the border between layer I and layers II-III in the cortex of wild-type mice, as in the rat. D, Immunostaining for CB1 receptors in CB1-/- mice results in a complete lack of labeling, confirming the selectivity of the antibody for CB1. Scale bars: A, C, D, 100 μm; B, 20 μm.
Electron microscopic studies. From sections embedded in Durcupan, areas of interest were reembedded and resectioned for electron microscopy. Sections were collected on Formvar-coated single-slot grids, stained with lead citrate, and examined with a Hitachi (Tokyo, Japan) 7100 electron microscope.
Postembedding immunostaining for GABA. After preembedding immunoperoxidase staining for CB1, blocks containing layers II-III and layers V-VI were reembedded from animals perfused with fixative containing 1% glutaraldehyde. Ultrathin sections were cut on an ultra-microtome and mounted on nickel grids. Postembedding GABA immunostaining was performed according to the protocol of Somogyi and Hodgson (1985). Incubations were performed on droplets of solutions in humid Petri dishes: briefly, 1% periodic acid (H5IO6) for 10 min; wash in distilled water; 2% sodium metaperiodate (NaIO4) for 10 min; wash in distilled water; three times for 3 min in TBS, pH 7.4; 30 min in 1% ovalbumin dissolved in TBS; two times 10 min in TBS; 1.5 h in rabbit anti-GABA antiserum (Hodgson et al., 1985) in TBS containing 1% normal goat serum; two times 10 min wash with TBS; blocking procedure with 1% bovine serum albumin and 0.5% Tween 20 dissolved in Tris buffer, pH 7.4, for 10 min; 1.5 h incubation in colloidal gold conjugated anti-rabbit IgG (15 nm; 1:20 in the same blocking solution; Amersham Biosciences); two times for 5 min wash in distilled water; 30 min staining with 10% uranyl acetate; wash in distilled water; staining with lead citrate; and wash in distilled water. The electron micrographs were taken on a Hitachi 7100 electron microscope.
Statistics. For the quantitative analysis of the colocalization between CB1 receptor-positive somata and either their CCK or calbindin immunoreactivity, we analyzed five rats for both colocalizations. There was no significant difference between sections and animals (maximum-likelihood χ2 test, p > 0.05 in each case); therefore, all data were pooled. Where the ratio of the positive and negative cells are given in the text, we also show the 95% confidence intervals (CIs) of the ratio in parentheses (Wilson, 1927; Newcombe, 1998).
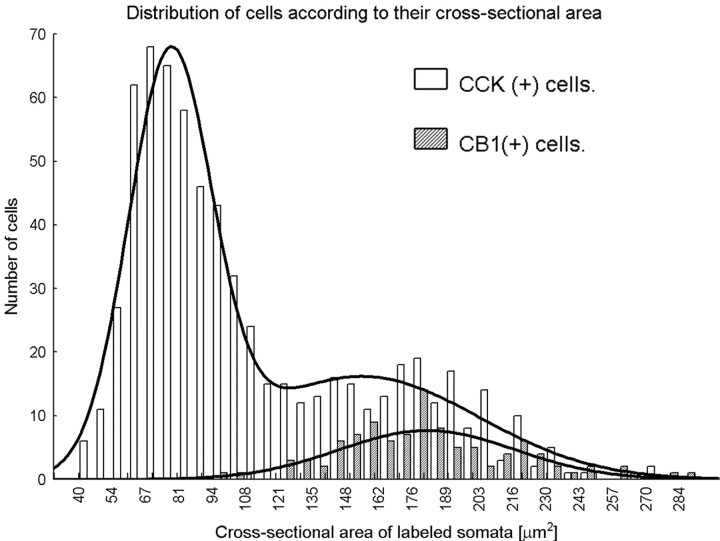
We also analyzed the distribution of the size of the cross-sectional area of CCK-positive (n = 665) and CB1-positive (n = 102) cells in the somatosensory cortex. From three animals, all layers of the cortex were included in the sample, and the cells were included in the sample with the same probability as their probability of occurrence in the different layers. The cross-sectional areas of the cell bodies were drawn using camera lucida from immunoperoxidase (DAB)-stained sections, and they were analyzed with the NIH Image program (http://rsb.info.nih.gov/nih-image/). Because there were no statistically significant differences among animals, data were pooled. The distribution of the cross-sectional area of CB1-positive cells was normal (Shapiro-Wilk's W test, p > 0.1). The distribution of the cross-sectional area of CCK-positive cells was not normal (Shapiro-Wilk's W test, p < 0.01); rather, it showed a bimodal distribution. Using a nonlinear estimation model, we tested whether the bimodal distribution of the cross-sectional area of CCK-positive cells can efficiently be explained by the sum of two normal distributions. We found that, by fitting the sum of two normal curves on the distribution, it can explain 95% of the variance of the data. Therefore, on the basis of their cross-sectional area, we can suppose that CCK-positive cells have at least two populations in the somatosensory cortex.
Quantitative analysis of the terminals. We selected four layers for this analysis, layers II, VA, and VI with high density and layer VB with relatively low density of CB1-positive terminals. We identified layer II as the upper one-third of the layers II-III and the distribution of giant pyramidal cells facilitated the identification of layer VB. Terminals were photographed from all layers, and the baskets formed by them were analyzed in the following way. First, we counted the number of CB1-positive or PV-positive elements in the baskets and then calculated the percentage of CB1-positive elements out of all CB1- or PV-positive elements. Somata were visible only when surrounded by large enough numbers of boutons, which introduced some bias in the sampling of baskets, i.e. those consisting of larger number of boutons (at least 14) were selected.
There was no significant difference between the animals in the ratio of the CB1-positive elements (χ2 test, p > 0.05 in each case); therefore, all data were pooled by layers. In the four analyzed layers (II, VA, VB, and VI), the baskets were different based on the ratio of the CB1-positive terminals they contained. Differences were considered to be significant, when the p level was under 0.05. All statistical analyses were performed using the software package Statistica (StatSoft, Tulsa, OK).
Electrophysiology. Male Wistar rats (15-22 d old) were deeply anesthetized with isofluorane, followed by decapitation. After opening the skull, the brain was quickly removed and immersed into ice-cold (∼4°C) modified artificial CSF (ACSF), which contained the following (in mm): 252 sucrose, 2.5 KCl, 26 NaHCO3, 2 CaCl2, 2 MgCl2, 1.25 NaH2PO4, and 10 glucose. Coronal slices of the neocortex (350-400 μm in thickness) were prepared using a Leica (Nussloch, Germany) VT1000S Vibratome. The slices were incubated in ACSF (with the same content as above with the exception that sucrose was replaced with 126 mm NaCl) at room temperature for at least 1 h before recordings. Whole-cell patch-clamp recordings were obtained at 22-24°C from pyramidal cells visualized by infrared differential interference contrast video microscopy (Axioscope; Zeiss, Jena, Germany) using a submerged type chamber. Flow rate was 3.8-4 ml/min. To record IPSCs, the ACSF contained 2-3 mm kynurenic acid to eliminate ionotropic glutamatergic transmission. Microelectrodes were pulled from borosilicate glass capillaries with an inner filament (1.5 mm outer diameter; 1.12 mm inner diameter; Hilgenberg, Malsfeld, Germany) using a Sutter Instruments (Novato, CA) P-87 puller and had resistances of 3-6 MΩ when filled with the intracellular solution. The intracellular solution contained the following (in mm): 60 Cs-gluconate, 80 CsCl, 1 MgCl2, 3 NaCl, 10 HEPES, 5 QX-314 [2(triethylamino)-N-(2,6-dimethylphenyl) acetamine], 2 Mg-ATP, and 0.3% biocytin, pH 7.2-7.3 adjusted with CsOH (osmolarity, 285-300 mOsm). All recorded cells were post hoc anatomically identified using immunoperoxidase reaction. IPSCs were measured at a holding potential of -60 mV. Access resistances (between 4 and 15 MΩ, compensated 70-75%) were frequently monitored and remained constant (±20%) during the period of analysis. Using a Supertech (Pécs, Hungary) timer and isolator, electrical stimulation at 0.1 Hz was delivered in the close vicinity of the recorded neuron via a theta glass pipette (Sutter Instruments) containing ACSF. Signals were recorded with a Multiclamp 700A amplifier (Axon Instruments, Union City, CA), filtered at 2 kHz, digitized at 5-10 kHz (PCI-6024E analog-to-digital board; National Instruments, Austin, TX), and analyzed off-line with the EVAN program (courtesy of Prof. I. Mody, University of California, Los Angeles, Los Angeles, CA). WIN 55,212-2 [R-(+)-(2,3-dihydro-5-methyl-3-[(4-morpholinyl)methyl]pyrol[1,2,3-de]-1,4-benzoxazin-6-yl) (1-naphthalenyl) methanone monomethanesulfonate] was dissolved in 0.1 m HCl to give a 10 mm stock solution. Adding 0.1 m HCl to the ACSF caused a small decrement in the pH (0.1-0.15), but, to ensure that this pH change causes no effect on the reduction of IPSCs, we added the same amount of HCl into the control solution. Spontaneous IPSCs (sIPSCs) were recorded in the presence of 5 μm carbachol. IPSC charges were calculated within a second time window. In the analysis, a 10 s control period before the depolarization step was compared with an interval of the same length beginning at the DSI peak or after 2 s of the pulse end. To estimate the changes of IPSC charge in a given cell, data from at least three DSIs were averaged. The depolarization pulse used to evoke DSI was a 1 s step from a holding potential of -60 to 0 mV applied every 1-2 min. Student's paired t test was used to compare changes, and p < 0.01 was considered significant. Data are presented as mean ± SEM. All drugs were obtained from Sigma (St. Louis, MO).
Results
Immunostaining using a purified antibody against the C terminus of the CB1 cannabinoid receptor showed a striking layer-specific pattern and visualized selected neuronal profiles in the adult rat somatosensory cortex (Fig. 1). Immunostaining in the somatosensory cortex of wild-type mice was similar to the rat (Fig. 1C), whereas no labeling was observed in CB1 knock-out mice (Fig. 1D), demonstrating the specificity of the antibody.
The most conspicuous feature of CB1 immunostaining was the dense axon labeling with a characteristic laminar pattern. We found a dense meshwork of axons in layers II-III and in the upper half of layer V (layer VA), as well as in layer VI. In contrast, immunostained axons distributed sparsely in layer IV and in layer VB (Fig. 1A). The drop of labeling in layer IV coincides with lower CB1 receptor binding in this layer reported previously (Herkenham et al., 1991). Hardly any staining was found in layer I. The relatively dense band of layer VA extended somewhat into lower layer IV. The distribution and morphological features of CB1-immunopositive somata suggested that CB1 might be expressed by GABAergic interneurons (Fig. 1B). CB1-positive cells were sparse, scattered among the CB1-negative principal cells (Fig. 1B,C). The distribution of labeled somata also showed a layer-specific pattern. CB1-positive cell bodies were found mostly in layers II-III (64%; CI, 61-67%), somewhat less in layers V-VI (33%; CI, 30-36%), and hardly any in layer I and layer IV (n = 886 from 5 rats) (for details, see Table 2).
Table 2.
Regional and cellular distribution pattern of CB1 receptor-positive somata
|
|
I |
|
II-III |
|
IV |
|
V-VI |
|
|---|---|---|---|---|---|---|---|---|
| All CB1+ cells (n = 886) | n = 14 (2%) | n = 567 (64%) | n = 14 (2%) | n = 291 (33%) | ||||
| CCK+ | CCK+ | CCK+ | CCK+ | |||||
| CB1 (n = 545) | n = 3 | 2 | n = 368 | 228 | n = 13 | 8 | n = 161 | 84 |
| (67%) | (62%) | (62%) | (52%) | |||||
| CaBP+ | CaBP+ | CaBP+ | CaBP+ | |||||
| CB1 (n = 341) | n = 11 | 0 | n = 199 | 48 | n = 1 | 0 | n = 130 | 61 |
|
|
|
(0%) |
|
(24%) |
|
(0%) |
|
(47%) |
The laminar distribution pattern of CB1-positive somata and the two main colocalizing markers (CCK and CaBP) are shown. The first row indicates the relative number of CB1-positive cells in the different cortical layers; the second and the third rows show the ratio of the colocalization (number of cells, number of colocalizing cells, and the percentage of the colocalization) with CCK and CaBP, respectively. The columns contain the data from the different layers.
Subcellular localization of CB1 receptors in the somatosensory cortex
The immunostaining pattern visible at the light microscopic level, i.e., the dense labeling of CB1-positive axon collaterals and lack of CB1-positive dendrites, suggested that the functional localization site of CB1 was predominantly presynaptic. To test this prediction, we examined the localization of CB1 at the electron microscopic level using the preembedding immunogold technique. In CB1-positive cell bodies, the immunogold particles representing the precise localization of CB1 were found on the membrane of cytoplasmic compartments but never on the plasma membrane (Fig. 2). Several immunogold particles were associated with the surface of the elements of the endosome-lysosome system and multivesicular bodies (Fig. 2B-D), and some were found on the Golgi complex and endoplasmic reticulum. The immunogold particles were always located on the cytoplasmic side of the membrane of these organelles, in accordance with the fact that the antibody was raised against the C terminus of the receptor.
Figure 2.
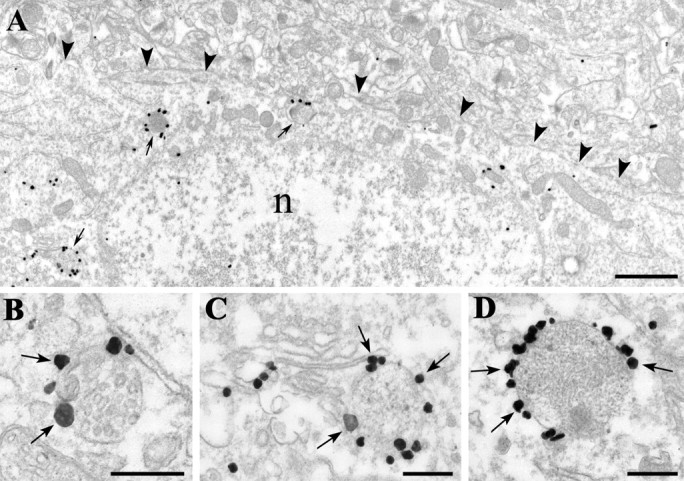
Compartmental distribution of CB1 cannabinoid receptors in the cell bodies of interneurons. A-D, CB1 cannabinoid receptors in cell bodies are restricted to intracellular membrane compartments. Note the lack of labeling on the plasma membrane (arrowheads in A). In contrast, immunogold particles (arrows in B-D), representing the localization of CB1 receptor protein, are frequently attached to elements of the endosome-lysosome system or multivesicular bodies (thin arrows in A). Some are also found on the Golgi complex and on the rough endoplasmic reticulum. n, Nucleus. B-D, The silver gold-particles (arrows), labeling the C terminus of the CB1 receptors, are always located on the outer surface of these organelles, suggesting a transport function to or from the plasma membrane of axons and a correct insertion (C terminus intracellular) of the receptor. Scale bars: A, 1 μm; B-D, 0.25 μm.
The most prominent localization of gold particles at the electron microscopic level was found on axon terminals forming symmetrical synapses (Fig. 3). These CB1-positive axon terminals targeted cell bodies and dendrites of putative pyramidal neurons (Fig. 3E,F), as well as dendrites of putative interneurons (Fig. 3B-D). The boutons contained numerous gold particles localized on the intracellular surface of the plasma membrane in conformity with the intracellular localization of the C terminus of the CB1 receptor. Although symmetrical synapses are usually indicative of GABAergic synapses, we sought to provide direct evidence. Using a combination of preembedding immunoperoxidase labeling for CB1 and postembedding immunogold labeling for GABA revealed that all CB1-positive axon terminals were GABA positive (Fig. 4). An analysis of 180 CB1-positive axon terminals followed through serial sections was performed in layers II-III (n = 100 boutons from 3 animals) and in layers V-VI (n = 80 boutons from 2 animals). Here, all CB1-immunoreactive boutons proved to be unequivocally GABA positive in both layers. In addition, we also found numerous GABA-positive but CB1-negative axon terminals, indicating that not all GABAergic cell types carry presynaptic CB1 receptors on their axon terminals (Fig. 4C).
Figure 3.
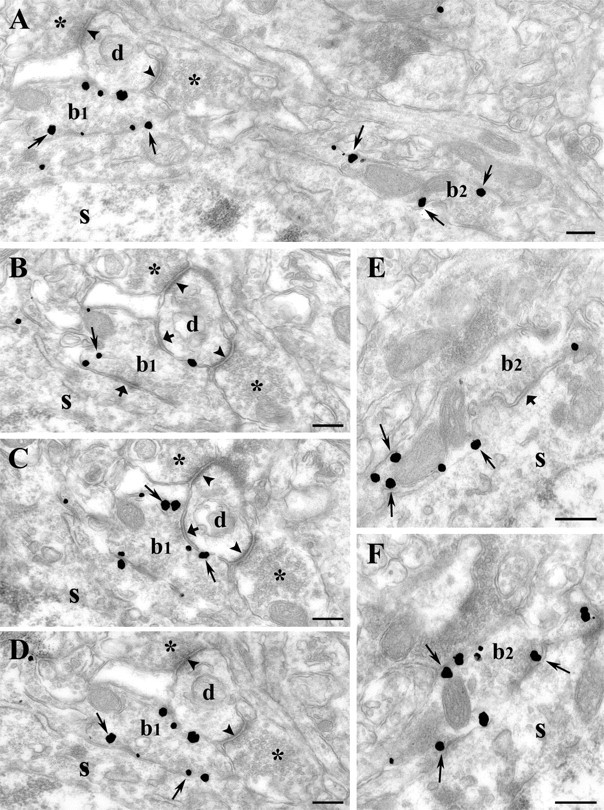
Presynaptic localization of CB1 on inhibitory axon terminals in rat somatosensory cortex. A-F, In layers II-III, silver-intensified gold particles (thin arrows) representing the localization of CB1-immunoreactivity are found on boutons (b1 and b2) but not on dendrites or somata. The antibody directed against the intracellular C-terminal portion of CB1 labels the intracellular side of the membrane of the terminals. B-D, Serial sections cut from b1 forming two symmetrical synapses (thick arrow), one on a soma (s) and the other on a dendritic shaft (d). This dendritic shaft also receives two asymmetrical synapses (arrowheads) from CB1-negative, presumably excitatory, axon terminals (asterisk). E, F, High-power electron micrographs show serial sections cut from a second bouton (b2). This axon terminal also forms a symmetrical synapse (thick arrow) on the same cell body (s) as b1 and is densely covered by gold particles (thin arrow). The CB1-immunoreactive axon terminals frequently contain dense-core vesicles (in D, in bouton 1). Scale bars: A-E, 0.25 μm.
Figure 4.
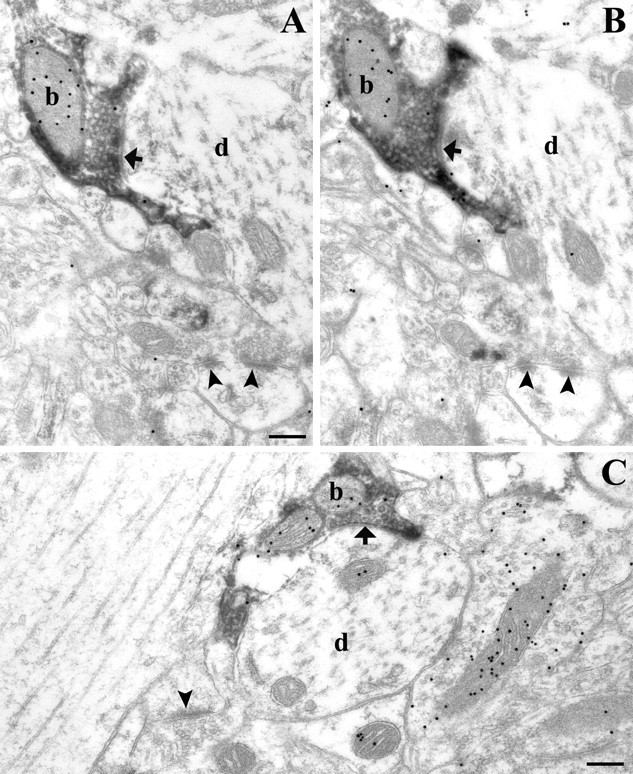
Presynaptic localization of CB1 on GABA-positive axon terminals in rat somatosensory cortex. A-C, Electron micrographs of CB1-immunoreactive boutons (visualized by immunoperoxidase staining using the DAB precipitate) forming symmetrical synapses (thick arrows) on CB1-negative pyramidal cell dendrites (d, in A-C). Postembedding immunogold staining performed on these ultrathin sections demonstrates that all CB1-positive boutons are immunoreactive for GABA (see accumulation of colloidal gold particles over the mitochondria of DAB-labeled boutons; particles are accumulated over mitochondria attributable to the fixation method used). Axon terminals that form asymmetrical synapses (arrowhead) on dendritic spines were always negative for both GABA and CB1. These correspond to glutamatergic boutons and can be used to indicate the level of background staining for GABA. Scale bars: A-C, 0.2 μm.
Cellular expression pattern of CB1 receptors in the somatosensory cortex
To determine which of the many cortical interneuron subtypes express CB1 receptors, we performed double-immunofluorescence experiments for CB1 and for several neurochemical markers of cortical interneurons, namely, CCK, PV, VIP, SOM, CR, and CaBP.
Colocalization of CB1 with CCK
The degree of colocalization between CB1 and CCK was high in the somatosensory cortex (Fig. 5A,B). In layers II-III, 62% (CI, 57-67%) of CB1-positive cells expressed CCK, whereas in layers V-VI this percentage was 52% (CI, 44-60%; n = 545 cells from 5 animals) (Table 2). In layer I and IV, in which there were only a few cells, the ratio seemed to be similar. In the other direction, of 200 CCK-positive somata, collected from all layers, altogether 66 were positive for CB1 (33%; CI, 27-40%; n = 200 cells from 2 animals).
Figure 5.
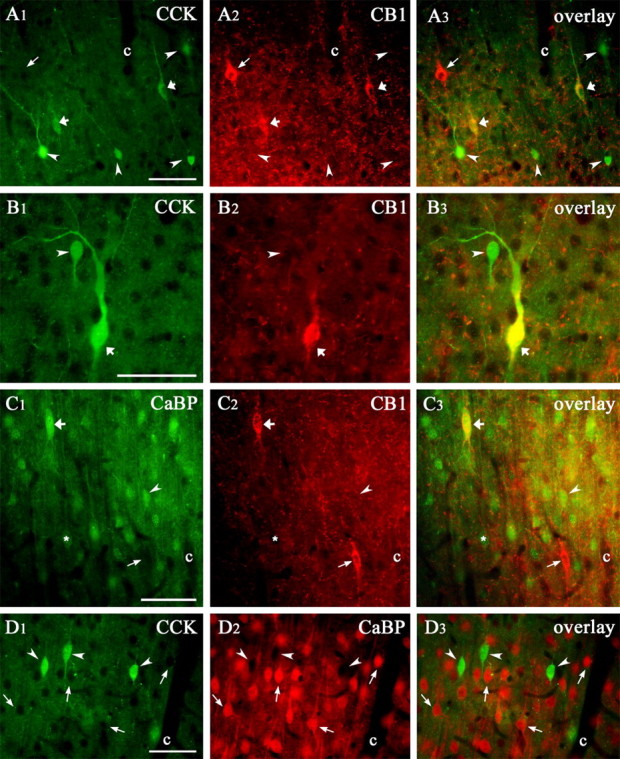
CB1 receptors are expressed by two neurochemically distinct subpopulations of interneurons in the rat somatosensory cortex. A1-A3, B1-B3, CCK/CB1 double-labeled cells are shown by the thick arrows. On the overlay, they appear in yellow (CCK immunostaining in A1 and B1; CB1 immunostaining in A2 and B2; the overlay in A3 and B3). The arrowheads show cells that are positive only for CCK, and the thin arrow points to a CB1-positive cell devoid of CCK. Two CCK-positive cells are shown in B1, a large (thick arrow) and a small (arrowhead), but only the large one expresses CB1 (B2). C1-C3, CaBP/CB1 double-fluorescence immunostaining. CaBP is the other marker expressed by CB1-positive cells. In layers II-III, in addition to interneurons, pyramidal cells also weakly express CaBP (C1, asterisk). Of the two CB1-positive cells, just the upper one expresses CaBP (C1, C2, thick arrow); this cell is yellow on the overlay (C3, thick arrow). The other CB1-positive cell does not express CaBP; hence, we can see only its outline in C1 (thin arrow). D1-D3, CCK- and CaBP-immunoreactive cells do not overlap in rat somatosensory cortex. Three CCK-containing cells are shown in D1 (arrowhead), but none of them is visible in the CaBP-staining (D2, arrowhead). The capillaries (c) are used throughout as to align profiles. Scale bars: A-D, 50 μm.
CCK-immunoreactive neurons in the frontal cortex were classified as two separate groups based on soma size (Kubota and Kawaguchi, 1997). Indeed, two distinct CCK-positive cell populations could be distinguished in the somatosensory cortex as well (Fig. 5B1). Comparison of CB1 content in the large and small CCK-immunoreactive neurons revealed that only large CCK-positive cells contained the receptor, whereas none of the small CCK-positive neurons expressed CB1 (Fig. 5B).
Quantitative morphological analysis of CB1- and CCK-positive cell bodies
Separation of soma size based exclusively on visual inspection can be misleading because of subjective factors. Therefore, we performed quantitative morphological analysis to estimate the size of CCK- and CB1-immunoreactive neurons. The cross-sectional area of the CB1- and CCK-positive cells was drawn by camera lucida from the light microscope and then measured with the NIH Image analyzer program. Data were pooled from three animals and are shown in Figure 6. We established that CCK-positive cells form two subpopulations based on the size of their cross-sectional area, and we calculated their ratio from the area of the two fitted normal distributions. The large cells, the cross-sectional area of which is 155 ± 47 μm2 (mean ± SD) represent 42% (CI, 38-46%) of all CCK-positive neurons. This ratio is similar to the ratio of the CCK-positive cells containing CB1 (see above). The cross-sectional area of the smaller cells was 77 ± 17 μm2 and formed 58% (CI, 54-62%) of all CCK-positive neurons (Fig. 6). Remarkably, the size of the CB1-containing cell bodies (181 ± 36 μm2) overlapped with the large CCK-positive group but not with the small CCK-containing cells (Fig. 6).
Figure 6.
Distribution and morphological analysis of CCK- and CB1 receptor-positive somata. Based on their size, two CCK-positive cell populations can be separated. In the somatosensory cortex, only the large cells contain CB1 receptors. The estimated size of the two populations of CCK-positive cells according to their cross-sectional area is 77 ± 17 μm2 (mean ± SD) for the small group and 155 ± 47 μm2 for the large CCK-positive subpopulation. Remarkably, the calculated size of the CB1 receptor-containing cell bodies (181 ± 36 μm2) overlapped with the large but not with the small CCK-positive cell population.
Colocalization of CB1 with CaBP suggests the existence of a second CB1 receptor-positive interneuron subtype
The second neurochemical marker that showed colocalization with CB1 was CaBP (Fig. 5C). Altogether 24% (CI, 18-31%) and 47% (CI, 38-56%) of the CB1-positive cells express CaBP in layers II-III and in layers V-VI, respectively (n = 341 cells from 5 animals) (Table 2). Because some pyramidal neurons also express CaBP, the colocalization ratio between CaBP and CB1 in interneurons was impossible to determine unequivocally. Conversely, colocalization of CB1 receptors with two different neurochemical markers (CCK and CaBP) raised the question whether these markers define the same population of neurons or whether they dissect the CB1-immunoreactive neurons into two nonoverlapping subsets. Double-immunofluorescence staining for CCK and CaBP showed a nearly complete lack of colocalization in the somatosensory cortex: of 261 CCK-positive cells, only seven were positive for CaBP (3%; n = 2 animals) (Fig. 6D; Table 3), as shown previously in the frontal cortex (Kubota and Kawaguchi, 1997).
Table 3.
Ratio of the interneuron types showing low level or no colocalization with CB1
|
Interneuron markers showing low level/lack of colocalization with CB1 |
|
|---|---|
| VIP (n = 360) | CB1-positive, 12 (3%) |
| CB1 (n = 230) | VIP-positive, 12 (5%) |
| SOM (n = 100) | CB1-positive, 0 |
| CB1 (n = 100) | SOM-positive, 0 |
| PV (n = 100) | CB1-positive, 0 |
| CB1 (n = 100) | PV-positive, 0 |
| CR (n = 100) | CB1-positive, 0 |
| CB1 (n = 100) |
CR-positive, 0 |
This table shows colocalization of CB1 with VIP, SOM, PV, and CR. In rows, n indicates the number of the cells, which are positive for the first marker, whereas the second number indicates the number of cells with colocalization of the first and the second marker. In the parentheses, the ratio of the colocalization is presented as a percentage.
Colocalization of CB1 with other neurochemical markers
To further identify interneuron subtypes that express CB1, we performed double-immunofluorescence staining for other neurochemical markers as well (Fig. 7). Previously, CaBP- and SOM-positive cells were shown to represent highly overlapping populations (Kawaguchi and Kubota, 1997). However, we found that all SOM-positive cells were negative for CB1 and vice versa (n = 100 cells in both cases; n = 2 animals) (Fig. 7B), excluding the possibility that the CaBP/SOM double-labeled cells correspond to the CaBP/CB1-positive cell population. On the contrary, we conclude that CB1 is present only in those CaBP cells that lack SOM.
Figure 7.
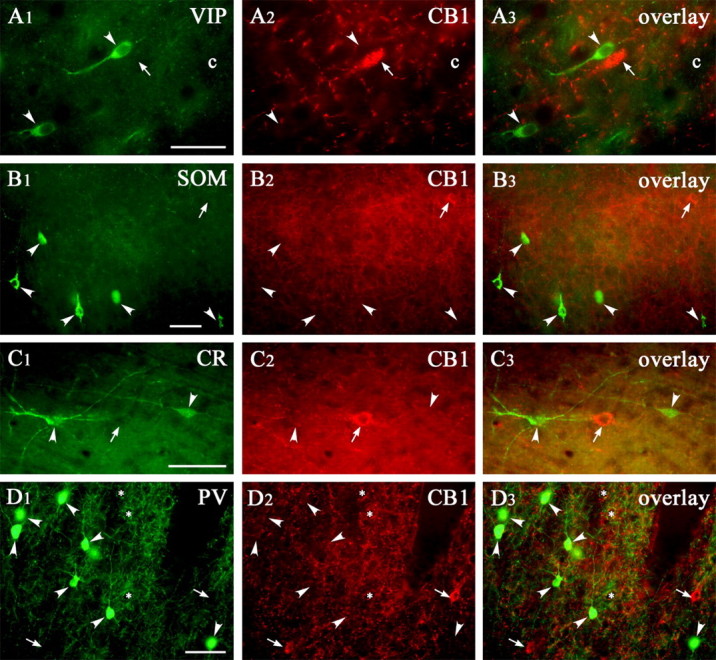
CB1 receptor is not expressed by other interneuron subpopulations. VIP/CB1 (row A), SOM/CB1 (row B), CR/CB1 (row C), and PV/CB1 (row D) double-immunofluorescence staining in the somatosensory cortex showed the lack of colocalization between these neurochemical markers and CB1 receptor. The arrowheads show the cells that are positive only for the first marker, whereas the thin arrows show the CB1 receptor-positive cells. The capillaries (c) are used as landmarks. Scale bars: A-D, 50 μm.
In a previous mapping report, the neuropeptide VIP and the calcium-binding protein CR were found to colocalize with CCK in GABAergic interneurons in the frontal cortex (Kubota and Kawaguchi, 1997). Nevertheless, of 230 CB1-positive cells, only 12 (5%) were positive for VIP, and, of 360 VIP-positive cells, only 12 (3%) were positive for CB1 (n = 3 animals) (Fig. 7A; Table 3). Likewise, none of the CB1-positive cells were found to be CR immunoreactive and vice versa (n = 100 cells in both cases; n = 2 animals) (Fig. 7C; Table 3).
Layer- and cell type-specific complementary distribution of CB1 and PV
A major marker for neocortical GABAergic interneurons responsible for perisomatic inhibition is the calcium-binding protein PV (Celio, 1986). However, we did not find colocalization between CB1 and PV (n = 100 cells in both cases; n = 2 animals) (Fig. 7D).
Furthermore, closer inspection of double-immunofluorescence staining revealed that CB1- and PV-immunoreactive axons were enriched in alternate layers in a complementary manner (Fig. 8A). The difference in the density of fiber meshwork was striking even between sublayers, although the alternate pattern for the axons was not mutually exclusive (Fig. 8). Layer I was essentially devoid of axons of both types. The highest density of PV-positive axons was found in layers IV and VB, whereas the density of CB1-postive axons was very low in these layers. The most conspicuous difference in density was found in layers IV and VA. In layer IV, CB1-postive axons were strikingly sparse, in contrast to PV-positive fibers, which formed an extensive network throughout the width of the layer. In layer VA, the density difference was the opposite. In layers II and VI, both fiber types reached high densities.
Figure 8.
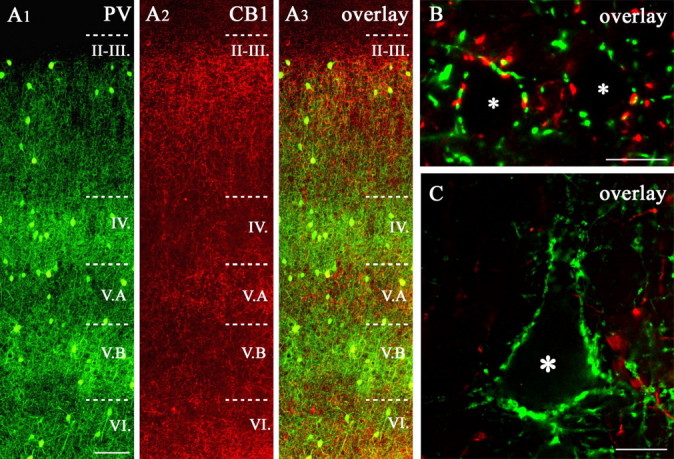
Comparison of CB1 and PV immunostaining in the rat somatosensory cortex. A1-A3, PV/CB1 receptor double-immunostained section of rat somatosensory cortex. Note that the laminar density of the labeled axons is essentially complementary in the two immunostainings (B, C). In layers II-III, the PV- and the CB1-positive terminals occurred in a similar density around the pyramidal cell somata (asterisks in B), although PV staining becomes more dense from layer II toward layer III, whereas CB1 staining becomes more sparse. In contrast, in layers IV and VB, the density of the PV-positive boutons was high (particularly around large pyramids in VB, see asterisk in C), whereas low levels of CB1 receptor expression were seen. In layer VA, the opposite was found: higher CB1 expression was coupled to lower levels of PV. Scale bars: A, 100 μm; B, C, 10 μm.
This striking density difference between cortical layers led us to the question whether individual pyramidal cells receive different ratios of perisomatic input from CB1- and PV-positive axons. To answer this question, we analyzed in detail the double-immunofluorescence stainings for PV and CB1. In layers II-III, VA, and VI, immunonegative cell bodies (most of which likely corresponded to pyramidal neurons) were encircled by both PV- and CB1-positive terminals (Fig. 8B). In remarkable contrast, large pyramidal cells in layer VB were surrounded almost exclusively by PV-positive terminals (Fig. 8C).
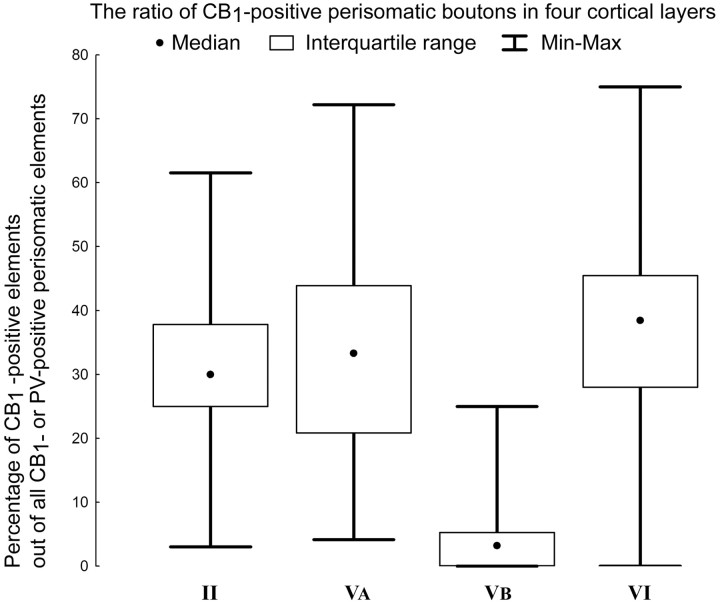
To quantify this observation, we counted the number of CB1-positive and PV-positive terminals in baskets in layers II, VA, VB, and VI (Fig. 9). Then we determined and compared the proportion of the CB1-positive elements on single cells (percentage of CB1-positive elements in a basket out of all CB1- or PV-positive elements within a basket) among different layers. The median of the ratio in layer II was 30%, 33% in layer VA, 3% in layer VB, and 39% in layer VI. Statistical tests (Kruskall-Wallis test, post hoc Siegel and Castellan comparisons of mean ranks for all groups) confirmed that the difference in the ratio of inputs in layer VB compared with layers II, VA, and VI was significant and layers II and VI were also different, whereas the other comparisons showed no difference. The significantly lower level of CB1-positive terminals in layer VB was remarkable (Fig. 9). The maximum values of the ratios show that the highest CB1 occurrence is in layer VI, in contrast to layer VB, in which CB1-positive terminals were rarely seen in perisomatic baskets around the large pyramidal cells.
Figure 9.
Ratio of CB1-positive terminals in baskets around pyramidal cell bodies, located in layers II, VA, VB, and VI. The graph shows the percentages of CB1-positive elements out of all CB1- or PV-positive perisomatic boutons in the baskets in layers II, VA, VB, and VI around presumed pyramidal cell somata. Note the large variability of the percentages of CB1-positive terminals within the layer. The lowest percentages of CB1-positive axon terminals were found in baskets in layer VB, and it was significantly different from the other layers; in addition, layer VI was also significantly different from layer II. The number of PV-positive terminals was higher in baskets in all examined layers.
Activation of CB1 cannabinoid receptors by exogenous or endogenous ligands differently alters inhibitory synaptic transmission in layer II and layer VB pyramidal cells
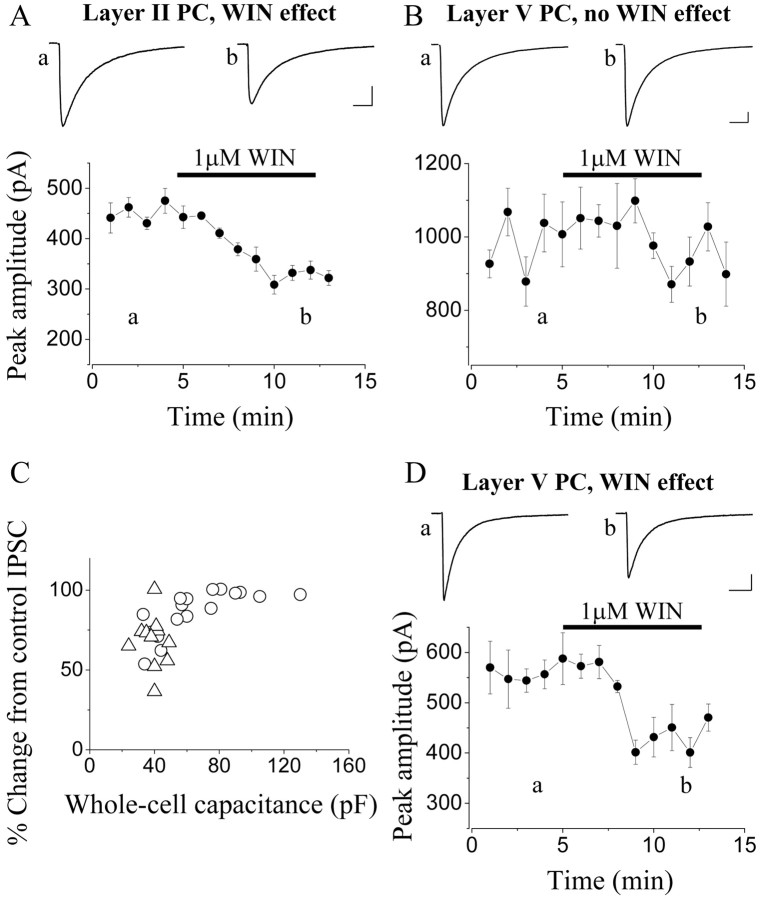
According to our anatomical observations, the perisomatic region of layer II pyramidal cells was innervated by CB1-immunopositive as well as CB1-immunonegative (or PV-positive) axon terminals. In contrast, a large proportion of layer VB pyramidal cells were surrounded mostly by PV-expressing axon terminals. Other pyramidal cells, mostly those with small soma size in the same layer, as well as in layer VA, received mixed innervation. To confirm the physiological significance of these immunocytochemical data, we first investigated the cannabinoid sensitivity of IPSCs in layers II and VB pyramidal cells (Fig. 10). These currents were evoked by focal electrical stimulation in the close vicinity of the pyramidal cell somata in the presence of 2-3 mm kynurenic acid, an ionotropic glutamate receptor blocker. Bath application of 1 μm WIN 55,212-2, a cannabinoid receptor agonist, significantly suppressed the amplitude of evoked IPSCs compared with control in all but one layer II pyramidal cells (67.9 ± 4.9% of control; n = 11) (Fig. 10A,C). In contrast, WIN 55,212-2 caused a significant reduction in the IPSC amplitude only in 7 of 17 pyramidal cells in layer VB (Fig. 10D), whereas in remaining cells, there was no change after the drug application (Fig. 10B). After pooling data from layer VB neurons, the effect of WIN 55,212-2 (86.8 ± 3.4%; n = 17) was significantly different from those obtained in layer II pyramidal cells (p = 0.003, Student's unpaired test). Using Fisher's exact test, we compared the difference in the proportion of cells sensitive for the CB1 receptor agonist in layers II and VB and found a significant difference (p = 0.002). When we plotted the magnitude of the WIN 55,212-2 effect as a function of whole-cell capacitance (approximated by the value obtained from the capacitance compensation), there was a relationship between these two values (r = 0.64; p < 0.001), indicating that pyramidal cells with larger cell bodies tend to receive WIN 55,212-2-insensitive IPSCs (Fig. 10C).
Figure 10.
IPSCs recorded in pyramidal cells (PCs) from layer II and layer VB of somatosensory cortex show different sensitivity to a cannabinoid receptor agonist, WIN 55,212-2 (WIN). A, In layer II pyramidal cells, bath-applied WIN 55,212-2 (1 μm) significantly reduces the amplitude of IPSCs evoked by focal electrical stimulation in the close vicinity of cell bodies. B, Evoked IPSCs in the majority of layer VB pyramidal cells (59%) are not changed after application of the cannabinoid agonist. C, The magnitude of the reduction of evoked IPSCs after application of WIN 55,212-2 is plotted as a function of the whole-cell capacitance (obtained from the whole-cell capacitance compensation), showing a tendency that neurons with larger somata receive only cannabinoid-insensitive IPSCs (layer II PCs, triangles; layer VB PCs, circles). D, The amplitude of IPSCs in a minority of layer VB pyramidal cells was significantly suppressed by WIN 55,212-2. All data points on the plots of the IPSC amplitude represent a mean ± SEM of six consecutive events recorded with the whole-cell patch-clamp technique. Insets are averaged recordings of six consecutive IPSCs at the labeled time points. Calibration: A, B, D, insets, 100 pA, 20 ms.
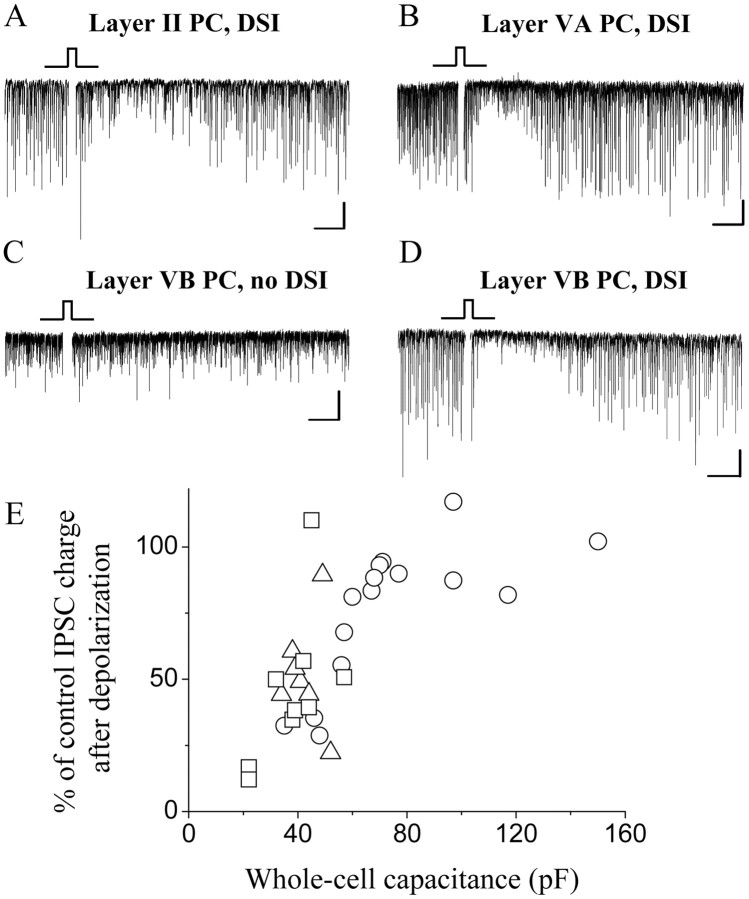
In the next set of experiments, we asked whether similar differences could be found in endocannabinoid signaling. To address this question, we investigated the presence and magnitude of DSI (Fig. 11), a phenomenon that is thought to be mediated by endocannabinoids (Wilson and Nicoll, 2002). Macroscopically, after 1 s depolarization, sIPSCs recorded in the postsynaptic cells were transiently suppressed for tens of seconds. In the presence of kynurenic acid, both inhibitory synaptic transmission and endocannabinoid signaling was enhanced by a cholinergic agonist, carbachol (5 μm), to reduce the possibility of occurrence of false-negative results in DSI (Kim et al., 2002). In all but one layer II pyramidal cells, depolarization caused a significant reduction in the sIPSC charge compared with control (51.9 ± 7.7% of control; n = 7; p < 0.001) (Fig. 11A), similar to previous results (Trettel and Levine, 2002). In layer VA neurons, a significant DSI has been observed in eight of nine pyramidal cells (45.4 ± 9.5%; n = 9; p < 0.001) (Fig. 11B). In layer VB pyramidal cells, however, only 5 of 15 neurons showed significant DSI (Fig. 11D), whereas no change in the IPSC charge was noticed in the remaining 10 neurons (Fig. 11C). The magnitude of DSI in layer VB pyramidal cells was 75.8 ± 6.8% (n = 15). Similar to the WIN 55,212-2 effect, DSI was more robust in those pyramidal cells that have smaller whole-cell capacitance regardless of their location (r = 0.69; p < 0.001) (Fig. 11E). According to the maximum-likelihood χ2 test, there is a significant correlation between the proportion of cells showing DSI and their localization in all three layers tested (p = 0.015).
Figure 11.
Presence of DSI is different in layer II and layer VB pyramidal cells (PCs). A, B, DSI is observed in the vast majority of layers II and VA pyramidal cells, as indicated by the transient reduction of sIPSCs (depicted as downward deflections from the baseline) after a 1-2 s depolarization of the postsynaptic neuron (marked with the square pulse). C, In contrast, no DSI occurs after depolarization in two-thirds of layer VB pyramidal cells. D, However, in one-third of layer VB pyramidal cells, the magnitude of DSI is similar to that measured in layers II or VA pyramidal cells. E, Relationship between the whole-cell capacitance and the magnitude of DSI, showing that neurons with larger soma tend to have no DSI (layer II PCs, triangles; layer VA PCs, squares; layer VB PCs, circles). Calibration: A-D, 50 pA, 5 s.
Thus, in layer VB, a lower percentage of cells showed cannabinoid sensitivity compared with those neurons found in layers II and VA. In summary, these pharmacological and physiological results verified that layer VB pyramidal cells with large somata are distinct from pyramidal cells in layers II and VA with regard to the cannabinoid sensitivity of their perisomatic inhibitory input.
Discussion
The main findings of the present study are the following: (1) CB1 receptors are expressed by two distinct subpopulations of interneurons in the rat somatosensory cortex; (2) functional CB1 receptors are located presynaptically on GABA-positive axon terminals; (3) large amounts of CB1 receptors are localized in the membrane of multivesicular bodies and lysosomes in the perinuclear cytoplasm of the same subset of interneurons; and (4) striking differences in the susceptibility of pyramidal cells of different cortical layers to endocannabinoid signaling were found, which correlated well with CB1 expression.
CB1 receptors are expressed by at least two different interneuron subpopulations in the rat somatosensory cortex
Cortical interneurons form functionally distinct types as determined by their laminar distribution, neurochemical characteristics, receptor expression patterns, and physiological properties (Cauli et al., 1997; Kawaguchi and Kubota, 1997; Somogyi et al., 1998; Kawaguchi, 2001).
In the neocortex, CCK-positive interneurons form at least two subpopulations according to their size, morphology, and neurochemical marker content (Kawaguchi and Kubota, 1997; Kubota and Kawaguchi, 1997). In the present study, we showed that only CCK-expressing interneurons with large cell bodies expressed CB1 receptors. Similarly, large CCK-positive cells were found to express CB1 receptors in both the basolateral amygdala (Katona et al., 2001; McDonald and Mascagni, 2001) and hippocampus (Katona et al., 1999). These cells, innervating primarily the perisomatic region of principal neurons, are in a position to control network activity patterns (Kawaguchi, 2001; Freund, 2003; Galarreta et al., 2004), because they can effectively control the spike timing of large cell ensembles (Cobb et al., 1995; Miles et al., 1996).
Besides the large CCK-positive cells, a subset of interneurons containing CaBP was also identified to express CB1 receptors in the neocortex, similar to the hippocampus (Marsicano and Lutz, 1999; Tsou et al., 1999) and amygdala (Marsicano and Lutz, 1999). The ratio of CB1-immunoreactive CCK- and CaBP-containing interneurons, which form nonoverlapping populations (Kawaguchi and Kubota, 1997; Kubota and Kawaguchi, 1997; present study), was different between layers. In layers II-III, the CCK-positive subpopulation was dominant, whereas in layer V-VI, these two types were equally represented. The lack of colocalization between CCK and CaBP suggests the existence of at least two populations of CB1-containing interneurons in the somatosensory cortex. Together, the fact that the sum of the percental values of the CCK- and the CaBP-positive CB1-containing cells was close to 100% within these layers (86 and 99% in layers II-III and layers V-VI, respectively) (Table 2) and that no other interneuron marker was substantially colocalized with CB1, it can be concluded that no other major CB1-positive subpopulations exist in the rat somatosensory cortex. Interneurons containing CaBP are known to belong to dendrite-targeting inhibitory cells in the hippocampus and likely also in the neocortex (Gulyas and Freund, 1996; Kawaguchi and Kubota, 1997; Thomson and Bannister, 2003). These GABAergic cells could regulate the efficacy and/or plasticity of excitatory inputs arriving onto principal cells (Miles et al., 1996). Because CCK and CaBP are expressed in separate populations of neocortical interneurons (Kawaguchi and Kubota, 1997; Kubota and Kawaguchi, 1997), endocannabinoids could modulate at least two functionally distinct types of inhibition, one that primarily deals with population synchrony (perisomatic inhibition) and another controlling input plasticity (dendritic inhibition).
Selective control of inhibitory input by CB1 receptors in the somatosensory cortex
Using electron microscopy, we showed that CB1 receptors are exclusively found on axons of GABAergic neurons or in their perinuclear cytoplasm, similar to the hippocampus or basolateral amygdala (Katona et al., 1999, 2000, 2001; Hájos et al., 2000). The immunopositive axons likely originate from local circuit neurons expressing CB1. Supporting this idea, a recent study showed that intracellularly labeled CB1-positive cells in layers II-III had axons that arborized mainly in these superficial layers but also projected to deeper parts (Galarreta et al., 2004). The activation of CB1 receptors located at inhibitory synapses has been shown to regulate GABA release, for instance, during DSI. According to current knowledge, repetitive firing of principal cells triggers the synthesis of endocannabinoids that bind to CB1 receptors expressed at presynaptic GABAergic terminals causing suppression of inhibition (Wilson and Nicoll, 2002). Endocannabinoid-mediated retrograde signaling may allow strongly excited cells to partly escape inhibitory control, which could facilitate potentiation of its excitatory input (Carlson et al., 2002). Initially, DSI was described in the cerebellum (Llano et al., 1991) as well as in the hippocampus (Pitler and Alger, 1992), and only recently in the superficial layers of the neocortex (Trettel and Levine, 2003). Our electrophysiological recordings uncovered that endocannabinoid-mediated signaling was not uniformly present in all cortical principal cells. DSI was missing from a significant fraction of pyramidal cells located in layer VB but was readily detectable in the superficial layers, similar to previous observations (Trettel and Levine, 2003). Furthermore, a large part of electrically evoked IPSCs recorded from pyramidal cells of layer VB, but not layer II, were insensitive to a cannabinoid agonist, confirming the results of our DSI experiments.
Two functionally distinct inhibitory cell types innervating the perisomatic domain of pyramidal neurons are present in cortical circuitries: PV-containing and CCK/CB1-positive interneurons (Freund, 2003). Double-labeling experiments revealed that pyramidal cells could differ in the composition of their perisomatic inhibition in a layer-specific manner. Whereas pyramidal cells in layers II and VI and partly in layer VA were covered by both PV- and CB1-expressing axon terminals, a significant number of large pyramidal cells in layer VB were decorated only with boutons immunopositive for PV but not for CB1, which is in line with our physiological data. Thus, both electrophysiological and anatomical results showed that there is a pyramidal cell population in layer VB that is not innervated by CB1-expressing terminals; therefore, their GABAergic input escapes control via endocannabinoids.
In addition to the presynaptic location of CB1 receptors, immunostaining found in the somata of interneurons was restricted to the endoplasmic reticulum, Golgi apparatus, multivesicular bodies, or the endosome-lysosome system, indicating that the antibodies specific for this receptor recognized both the newly synthesized and transported proteins. A recent study in the neocortex showed that high-frequency firing of CCK-positive interneurons results in a long-lasting decrease of their membrane potential and probability of firing (Bacci et al., 2004). This effect was blocked by a CB1 antagonist, suggesting the involvement of endocannabinoid signaling. However, our electron microscopic investigations revealed no CB1 receptors on the soma-dendritic membrane surface of CCK-positive interneurons. Thus, the long-lasting inhibition of firing of CCK-expressing cells might be mediated via different cannabinoid-sensitive receptors or CB1 receptors at a very low density. An especially intriguing alternative is that CB1 receptors in multivesicular bodies or the endosome-lysosome system could mediate this effect, generating second messengers intracellularly.
Possible function of CB1 receptor activation in the neocortex
The majority of corticocortical connections originate from pyramidal cells located in superficial layers that receive both cannabinoid-sensitive and -insensitive inhibitory afferents. Thus, intracortical communication is under the control of activity-dependent modulation of neuronal firing by endocannabinoids, adding further plasticity to the system. In contrast, pyramidal cells located in layer VB give rise to subcortical projections to the brainstem, spinal cord, and midbrain (Wise and Jones, 1977). Importantly, this extracortical information flow seems to lack endocannabinoid-mediated regulation. One may speculate that activity-dependent fine-tuning of plasticity that allows the formation of functional assemblies of cortical neurons is required primarily for those circuits that are responsible for encoding of information. Even layer VA pyramidal cells, some of which project to the striatum and the thalamus (Wise and Jones, 1977), were shown recently to markedly differ from layer VB and play a unique role in intracortical processing of sensory information (Schubert et al., 2005). Conversely, members of the effector circuits (including layer VB), forwarding cortical instructions downstream to subcortical centers, need to be more rigid to faithfully execute this task. Activity-dependent endocannabinoid signaling may thus be required for information processing by intracortical circuits but not for subcortical output.
Footnotes
This work was supported by Grants T046820 (T.F.F.) and F046407 (I.K.), Egészségügyi Tudományos Tanács Grant 474/2003 (N.H.), Nemzeti Kutatási és Fejlesztési Pályázatok Grant 1A/002/2004, National Institutes of Health Grants DA00286 (K.M.), NS30549 (T.F.F.), and DA11322 (K.M.), European Union Grant LSHM-CT-2004-005166, and Philip Morris External Research Program (T.F.F.). N.H. and I.K. are grantees of the Bolyai János scholarship. We thank Katalin Lengyel, Katalin Iványi, and Gyôzô Goda for excellent technical assistance and Ferenc Mátyás for help with immunocytochemical experiments.
Correspondence should be addressed to Tamás F. Freund, Institute of Experimental Medicine, Hungarian Academy of Sciences, Szigony utca 43, H-1083 Budapest, Hungary. E-mail: freund@koki.hu.
Copyright © 2005 Society for Neuroscience 0270-6474/05/256845-12$15.00/0
References
- Alger BE (2002) Retrograde signaling in the regulation of synaptic transmission: focus on endocannabinoids. Prog Neurobiol 68: 247-286. [DOI] [PubMed] [Google Scholar]
- Bacci A, Huguenard JR, Prince DA (2004) Long-lasting self-inhibition of neocortical interneurons mediated by endocannabinoids. Nature 431: 312-316. [DOI] [PubMed] [Google Scholar]
- Baimbridge KG, Miller JJ, Parkes CO (1982) Calcium-binding protein distribution in the rat brain. Brain Res 239: 519-525. [DOI] [PubMed] [Google Scholar]
- Berod A, Hartman BK, Pujol JF (1981) Importance of fixation in immunohistochemistry: use of formaldehyde solutions at variable pH for the localization of tyrosine hydroxylase. J Histochem Cytochem 29: 844-850. [DOI] [PubMed] [Google Scholar]
- Carlson G, Wang Y, Alger BE (2002) Endocannabinoids facilitate the induction of LTP in the hippocampus. Nat Neurosci 5: 723-724. [DOI] [PubMed] [Google Scholar]
- Cauli B, Audinat E, Lambolez B, Angulo MC, Ropert N, Tsuzuki K, Hestrin S, Rossier J (1997) Molecular and physiological diversity of cortical non-pyramidal cells. J Neurosci 17: 3894-3906. [DOI] [PMC free article] [PubMed] [Google Scholar]
- Celio MR (1986) Parvalbumin in most gamma-aminobutyric acid-containing neurons of the rat cerebral cortex. Science 231: 995-997. [DOI] [PubMed] [Google Scholar]
- Cobb SR, Buhl EH, Halasy K, Paulsen O, Somogyi P (1995) Synchronization of neuronal activity in hippocampus by individual GABAergic interneurons. Nature 378: 75-78. [DOI] [PubMed] [Google Scholar]
- Diana MA, Marty A (2004) Endocannabinoid-mediated short-term synaptic plasticity: depolarization-induced suppression of inhibition (DSI) and depolarization-induced suppression of excitation (DSE). Br J Pharmacol 142: 9-19. [DOI] [PMC free article] [PubMed] [Google Scholar]
- Di Marzo V, Bifulco M, De Petrocellis L (2004) The endocannabinoid system and its therapeutic exploitation. Nat Rev Drug Discov 3: 771-784. [DOI] [PubMed] [Google Scholar]
- Freund TF (2003) Interneuron diversity series: rhythm and mood in perisomatic inhibition. Trends Neurosci 26: 489-495. [DOI] [PubMed] [Google Scholar]
- Freund TF, Katona I, Piomelli D (2003) Role of endogenous cannabinoids in synaptic signaling. Physiol Rev 83: 1017-1066. [DOI] [PubMed] [Google Scholar]
- Galarreta M, Erdelyi F, Szabo G, Hestrin S (2004) Electrical coupling among irregular-spiking GABAergic interneurons expressing cannabinoid receptors. J Neurosci 24: 9770-9778. [DOI] [PMC free article] [PubMed] [Google Scholar]
- Gulyas AI, Freund TF (1996) Pyramidal cell dendrites are the primary targets of calbindin D28k-immunoreactive interneurons in the hippocampus. Hippocampus 6: 525-534. [DOI] [PubMed] [Google Scholar]
- Gulyas AI, Gorcs TJ, Freund TF (1990) Innervation of different peptide-containing neurons in the hippocampus by GABAergic septal afferents. Neuroscience 37: 31-44. [DOI] [PubMed] [Google Scholar]
- Gupta A, Wang Y, Markram H (2000) Organizing principles for a diversity of GABAergic interneurons and synapses in the neocortex. Science 287: 273-278. [DOI] [PubMed] [Google Scholar]
- Hájos N, Katona I, Naiem SS, MacKie K, Ledent C, Mody I, Freund TF (2000) Cannabinoids inhibit hippocampal GABAergic transmission and network oscillations. Eur J Neurosci 12: 3239-3249. [DOI] [PubMed] [Google Scholar]
- Harkany T, Holmgren C, Hartig W, Qureshi T, Chaudhry FA, Storm-Mathisen J, Dobszay MB, Berghuis P, Schulte G, Sousa KM, Fremeau Jr RT, Edwards RH, Mackie K, Ernfors P, Zilberter Y (2004) Endocannabinoid-independent retrograde signaling at inhibitory synapses in layer 2/3 of neocortex: involvement of vesicular glutamate transporter 3. J Neurosci 24: 4978-4988. [DOI] [PMC free article] [PubMed] [Google Scholar]
- Herkenham M, Lynn AB, Johnson MR, Melvin LS, de Costa BR, Rice KC (1991) Characterization and localization of cannabinoid receptors in rat brain: a quantitative in vitro autoradiographic study. J Neurosci 11: 563-583. [DOI] [PMC free article] [PubMed] [Google Scholar]
- Hodgson AJ, Penke B, Erdei A, Chubb IW, Somogyi P (1985) Antisera to gamma-aminobutyric acid. I. Production and characterization using a new model system. J Histochem Cytochem 33: 229-239. [DOI] [PubMed] [Google Scholar]
- Katona I, Sperlagh B, Sik A, Kafalvi A, Vizi ES, Mackie K, Freund TF (1999) Presynaptically located CB1 cannabinoid receptors regulate GABA release from axon terminals of specific hippocampal interneurons. J Neurosci 19: 4544-4558. [DOI] [PMC free article] [PubMed] [Google Scholar]
- Katona I, Sperlagh B, Magloczky Z, Santha E, Kofalvi A, Czirjak S, Mackie K, Vizi ES, Freund TF (2000) GABAergic interneurons are the targets of cannabinoid actions in the human hippocampus. Neuroscience 100: 797-804. [DOI] [PubMed] [Google Scholar]
- Katona I, Rancz EA, Acsady L, Ledent C, Mackie K, Hajos N, Freund TF (2001) Distribution of CB1 cannabinoid receptors in the amygdala and their role in the control of GABAergic transmission. J Neurosci 21: 9506-9518. [DOI] [PMC free article] [PubMed] [Google Scholar]
- Kawaguchi Y (2001) Distinct firing patterns of neuronal subtypes in cortical synchronized activities. J Neurosci 21: 7261-7272. [DOI] [PMC free article] [PubMed] [Google Scholar]
- Kawaguchi Y, Kubota Y (1997) GABAergic cell subtypes and their synaptic connections in rat frontal cortex. Cereb Cortex 7: 476-486. [DOI] [PubMed] [Google Scholar]
- Kim J, Isokawa M, Ledent C, Alger BE (2002) Activation of muscarinic acetylcholine receptors enhances the release of endogenous cannabinoids in the hippocampus. J Neurosci 22: 10182-10191. [DOI] [PMC free article] [PubMed] [Google Scholar]
- Kubota Y, Kawaguchi Y (1997) Two distinct subgroups of cholecystokinin-immunoreactive cortical interneurons. Brain Res 752: 175-183. [DOI] [PubMed] [Google Scholar]
- Ledent C, Valverde O, Cossu G, Petitet F, Aubert JF, Beslot F, Bohme GA, Imperato A, Pedrazzini T, Roques BP, Vassart G, Fratta W, Parmentier M (1999) Unresponsiveness to cannabinoids and reduced addictive effects of opiates in CB1 receptor knockout mice. Science 283: 401-404. [DOI] [PubMed] [Google Scholar]
- Llano I, Marty A, Armstrong CM, Konnerth A (1991) Synaptic- and agonist-induced excitatory currents of Purkinje cells in rat cerebellar slices. J Physiol (Lond) 434: 183-213. [DOI] [PMC free article] [PubMed] [Google Scholar]
- Markram H, Toledo-Rodriguez M, Wang Y, Gupta A, Silberberg G, Wu C (2004) Interneurons of the neocortical inhibitory system. Nat Rev Neurosci 5: 793-807. [DOI] [PubMed] [Google Scholar]
- Marsicano G, Lutz B (1999) Expression of the cannabinoid receptor CB1 in distinct neuronal subpopulations in the adult mouse forebrain. Eur J Neurosci 11: 4213-4225. [DOI] [PubMed] [Google Scholar]
- Matsuda LA, Bonner TI, Lolait SJ (1993) Localization of cannabinoid receptor mRNA in rat brain. J Comp Neurol 327: 535-550. [DOI] [PubMed] [Google Scholar]
- McDonald AJ, Mascagni F (2001) Localization of the CB1 type cannabinoid receptor in the rat basolateral amygdala: high concentrations in a subpopulation of cholecystokinin-containing interneurons. Neuroscience 107: 641-652. [DOI] [PubMed] [Google Scholar]
- Miles R, Toth K, Gulyas AI, Hajos N, Freund TF (1996) Differences between somatic and dendritic inhibition in the hippocampus. Neuron 16: 815-823. [DOI] [PubMed] [Google Scholar]
- Newcombe RG (1998) Two-sided confidence intervals for the single proportion: comparison of seven methods. Stat Med 17: 857-872. [DOI] [PubMed] [Google Scholar]
- Pitler TA, Alger BE (1992) Postsynaptic spike firing reduces synaptic GABAA responses in hippocampal pyramidal cells. J Neurosci 12: 4122-4132. [DOI] [PMC free article] [PubMed] [Google Scholar]
- Schubert D, Kotter R, Luhmann HJ, Staiger JF (2005) Morphology, electrophysiology and functional input connectivity of pyramidal neurons characterizes a genuine layer Va in the primary somatosensory cortex. Cereb Cortex, in press. [DOI] [PubMed]
- Sjostrom PJ, Turrigiano GG, Nelson SB (2003) Neocortical LTD via coincident activation of presynaptic NMDA and cannabinoid receptors. Neuron 39: 641-654. [DOI] [PubMed] [Google Scholar]
- Sjostrom PJ, Turrigiano GG, Nelson SB (2004) Endocannabinoid-dependent neocortical layer-5 LTD in the absence of postsynaptic spiking. J Neurophysiol 92: 3338-3343. [DOI] [PubMed] [Google Scholar]
- Somogyi P, Hodgson AJ (1985) Antisera to gamma-aminobutyric acid. III. Demonstration of GABA in Golgi-impregnated neurons and in conventional electron microscopic sections of cat striate cortex. J Histochem Cytochem 33: 249-257. [DOI] [PubMed] [Google Scholar]
- Somogyi P, Tamas G, Lujan R, Buhl EH (1998) Salient features of synaptic organisation in the cerebral cortex. Brain Res Brain Res Rev 26: 113-135. [DOI] [PubMed] [Google Scholar]
- Thomson AM, Bannister AP (2003) Interlaminar connections in the neocortex. Cereb Cortex 13: 5-14. [DOI] [PubMed] [Google Scholar]
- Toledo-Rodriguez M, Blumenfeld B, Wu C, Luo J, Attali B, Goodman P, Markram H (2004) Correlation maps allow neuronal electrical properties to be predicted from single-cell gene expression profiles in rat neocortex. Cereb Cortex 14: 1310-1327. [DOI] [PubMed] [Google Scholar]
- Trettel J, Levine ES (2002) Cannabinoids depress inhibitory synaptic inputs received by layer 2/3 pyramidal neurons of the neocortex. J Neurophysiol 88: 534-539. [DOI] [PubMed] [Google Scholar]
- Trettel J, Levine ES (2003) Endocannabinoids mediate rapid retrograde signaling at interneuron right-arrow pyramidal neuron synapses of the neocortex. J Neurophysiol 89: 2334-2338. [DOI] [PubMed] [Google Scholar]
- Trettel J, Fortin DA, Levine ES (2004) Endocannabinoid signalling selectively targets perisomatic inhibitory inputs to pyramidal neurones in juvenile mouse neocortex. J Physiol (Lond) 556: 95-107. [DOI] [PMC free article] [PubMed] [Google Scholar]
- Tsou K, Mackie K, Sanudo-Pena MC, Walker JM (1999) Cannabinoid CB1 receptors are localized primarily on cholecystokinin-containing GABAergic interneurons in the rat hippocampal formation. Neuroscience 93: 969-975. [DOI] [PubMed] [Google Scholar]
- Wilson EB (1927) Probable inference, the law of succession, and statistical inference. J Am Stat Assoc 22: 209-212. [Google Scholar]
- Wilson RI, Nicoll RA (2002) Endocannabinoid signaling in the brain. Science 296: 678-682. [DOI] [PubMed] [Google Scholar]
- Wise SP, Jones EG (1977) Cells of origin and terminal distribution of descending projections of the rat somatic sensory cortex. Comp Neurol 175: 129-158. [DOI] [PubMed] [Google Scholar]
- Zimmer A, Zimmer AM, Hohmann AG, Herkenham M, Bonner TI (1999) Increased mortality, hypoactivity, and hypoalgesia in cannabinoid CB1 receptor knockout mice. Proc Natl Acad Sci USA 96: 5780-5785. [DOI] [PMC free article] [PubMed] [Google Scholar]


