

Abstract
Corelease of GABA and glycine by mixed neurons is a prevalent mode of inhibitory transmission in the vertebrate hindbrain. However, little is known of the functional organization of mixed inhibitory networks. Golgi cells, the main inhibitory interneurons of the cerebellar granular layer, have been shown to contain GABA and glycine. We show here that, in the vestibulocerebellum, Golgi cells contact both granule cells and unipolar brush cells, which are excitatory relay interneurons for vestibular afferences. Whereas IPSCs in granule cells are mediated by GABAA receptors only, Golgi cell inhibition of unipolar brush cells is dominated by glycinergic currents. We further demonstrate that a single Golgi cell can perform pure GABAergic inhibition of granule cells and pure glycinergic inhibition of unipolar brush cells. This specialization results from the differential expression of GABAA and glycine receptors by target cells and not from a segregation of GABA and glycine in presynaptic terminals. Thus, postsynaptic selection of coreleased fast transmitters is used in the CNS to increase the diversity of individual neuronal outputs and achieve target-specific signaling in mixed inhibitory networks.
Keywords: GABA, glycine, corelease, vestibular system, cerebellum, inhibition
Introduction
GABA and glycine are the fast inhibitory transmitters of the mammalian CNS. Although each transmitter acts on specific ionotropic receptors, both inhibitory systems are tightly linked. Unlike other neurotransmitter systems that define segregated groups of neurons, GABA and glycine are frequently accumulated in the same cells (Ottersen et al., 1988; Todd, 1990; Schneider and Fyffe, 1992), which are thus considered to be mixed inhibitory neurons. GABA and glycine colocalize in the majority of inhibitory terminals in the brainstem (Wentzel et al., 1993; Dumba et al., 1998), spinal cord (Ornung et al., 1994; Taal and Holstege, 1994; Todd et al., 1996), and cerebellar granular layer (Ottersen et al., 1988). Additional evidence for the prevalence of mixed interneurons is the colocalization of the glutamic acid decarboxylase (GAD), the synthetic enzyme for GABA, with GlyT2, the neuronal plasma membrane glycine transporter (Tanaka and Ezure, 2004). Furthermore, vesicular loading of both transmitters is operated by a common vesicular transporter VIAAT (or VGAT) (McIntire et al., 1997; Sagne et al., 1997). Thus, a large proportion of inhibitory transmission in the hindbrain is mediated by coreleased GABA and glycine.
Functional corelease of GABA and glycine by the same vesicle has been demonstrated in the spinal cord (Jonas et al., 1998) and brainstem (O'Brien and Berger, 1999; Russier et al., 2002; Nabekura et al., 2004; Awatramani et al., 2005), in which miniature IPSCs display both GABAA and glycine components. These results support the idea that mixed interneurons mediate GABAergic and glycinergic cotransmission. A challenging possibility would be that individual mixed neurons perform cotransmission at some of their synapses but pure glycinergic or GABAergic inhibition at others. Several sets of data suggest that the phenotype of inhibition can be adjusted at individual synapses by a change in the content of neurotransmitters (Nabekura et al., 2004) and/or by the expression of different ratios of postsynaptic GABAA receptors (GABAARs) and glycine receptors (GlyRs) (O'Brien and Berger, 2001), which may be modified by maturation processes (Kotak et al., 1998; Korada and Schwartz, 1999; Geiman et al., 2000; Keller et al., 2001). In all cases, however, the comparison of immunohistochemical and/or functional phenotypes of different synaptic terminals of a given mixed neuron is still lacking.
In the cerebellar cortex, Golgi cells have been reported to contain both GABA and glycine (Ottersen et al., 1988), although their identified targets, the granule cells, display GABAergic IPSCs exclusively (Kaneda et al., 1995; Rossi and Hamann, 1998; Farrant and Brickley, 2003). It has been postulated recently that Golgi cells also inhibit unipolar brush cells (UBCs) (Mugnaini and Floris, 1994; Dino et al., 2000), a group of excitatory interneurons of the vestibulocerebellum. Using a combination of paired recordings and immunohistochemical techniques, we examined whether GABA and glycine are used differentially at Golgi cell synapses established on granule cells and on UBCs.
Materials and Methods
Antibodies. Monoclonal antibodies against GABA (1:10,000; Swant, Bellinzona, Switzerland), GAD65 (1:500; Boehringer Mannheim, Mannheim, Germany), gephyrin (mAb7a, 1:500; Alexis Biochemicals, San Diego, CA), and GlyR (mAb4a, 1:500; Alexis Biochemicals) and polyclonal antibodies against glycine (raised in rabbit, 1:100; Chemicon, Temecula, CA), calretinin (CR) (raised in rabbit, 1:4000; Swant), the metabotropic glutamate receptor mGluR1α subunit (raised in rabbit, 1:200; Chemicon), VIAAT [gift from B. Gasnier, Institut de Biologie Physico-Chimique, Paris, France; raised in rabbit, 1:500 (Dumoulin et al., 1999)], and GlyT2 (raised in guinea pig, 1:10,000; Chemicon) were used at the indicated dilutions. All fluorescent secondary antibodies, coupled to fluorescein isothiocyanate (FITC), carboxymethyl indocyanine-3 (Cy3), or carboxymethyl indocyanine-5 (Cy5), were from Jackson ImmunoResearch (West Grove, PA) and used at 1:500.
Immunohistochemistry. Sections of fixed cerebellum of young adult Sprague Dawley rats were processed for immunocytochemistry as described previously (Dumoulin et al., 2001). No staining was observed when primary antibodies were omitted. Sections from spinal cord were used as a control for the specificity of antibody labeling. All immunostaining experiments were examined with a standard epifluorescence microscope (DMRD; Leica, Nussloch, Germany), and images were acquired with a high-resolution MicroMax CCD camera (Princeton Instruments, Trenton, NJ) or with a Leica SP2 confocal microscope (when specified). In this case, FITC, Cy3, and Cy5 were detected by sequential scanning, using for excitation the 488 nm line of an argon laser, the 543 nm line of a green laser, and the 650 nm line of a helium neon laser, respectively. MetaMorph (Universal Imaging Corporation, Downington, PA), Leica Control software (Leica), and Adobe Photoshop 7.0 (Adobe Systems, San Jose, CA) softwares were used for image processing.
Immunohistochemistry data quantification. The percentage of terminals containing GAD and VIAAT was assessed by analysis of confocal microscope images (63× objective, zoom 2). The number of GAD-positive terminals was assessed on the Cy3 channel and then the number of VIAAT-positive terminals on the FITC channel, and finally colocalizations were quantified on the merged image. Results from two independent experiments are presented as the mean ± SEM percentage value (StatView F.4.11; Abacus Concepts, Calabasas, CA). The same method was applied for GAD and GlyT2 and for GABA and glycine double stainings. The percentage of UBC-containing glomeruli in lobule X was assessed by analysis of epifluorescence microscope images (63× objective). The number of glomeruli defined by VIAAT-containing boutons was assessed on the FITC channel, and GlyR immunoreactivity (in red) was checked in every glomeruli on the merged image. Results from two independent experiments are presented as the mean ± SEM percentage value (StatView F.4.11; Abacus Concepts). In the combined electrophysiological and immunohistochemical experiments, Golgi cells were filled with Neurobiotin (Vector Laboratories, Burlingame, CA) (see below). Series of confocal microscope stacks were examined to identify the glomeruli (aggregates of gephyrin-positive clusters visualized on the Cy3 channel) containing varicose branches of the axon (visualized on the FITC channel). The percentage of those glomeruli containing the brush of a UBC was assessed by checking their calretinin or mGluR1α immunoreactivity (visualized on the Cy5 channel).
Preparation of cerebellar slices. Slices (220 μm) were prepared from the cerebellum of Wistar rats (aged 17-21 d). Under deep anesthesia, the cerebellum was quickly removed, and parasagittal slices of the vermis were cut using a vibrating blade microtome (VT 1000 S; Leica) in an ice-cold solution containing the following (in mm): 130 K-gluconate, 15 KCl, 0.05 EGTA, 20 HEPES, and 25 glucose, with pH adjusted to 7.4 by NaOH. This solution was designed to mimic the intracellular medium and to limit the entry of calcium and other extracellular ions into cells whose neurites were cut during the slicing procedure. d-(-)-2-amino-5-phosphonovaleric acid) (d-APV) at 50 μm was added to this solution to prevent glutamate excitotoxicity. Slices were transferred to artificial CSF (ACSF) (32°C) containing the following (in mm): 125 NaCl, 2.5 KCl, 1.25 NaH2PO4, 26 NaHCO3, 25 glucose, 2 CaCl2, and 1 MgCl2 (bubbled with 95% O2, 5% CO2).
Whole-cell recordings. Slices were transferred to a recording chamber mounted on an upright microscope (Axioskop; Zeiss, Oberkochen, Germany) and perfused with bubbled (95% O2,5%CO2) ACSF (2 ml/min, 32°C). Slices were visualized using deep red light (750 ± 25 nm). All cells were recorded in lobule X of the cerebellum. Patch pipettes were pulled from borosilicate glass capillaries (Hilgenberg, Maisfeld, Germany) with a vertical puller (David Kopf Instruments, Tujunga, CA). For Golgi cell recordings, the pipette was filled with an intracellular solution containing the following (in mm): 150 K-gluconate, 6 NaCl, 10 HEPES, 1 MgCl2, 4 ATP-Mg, and 0.4 GTP-Na, with pH adjusted to 7.35 by KOH. For UBC and granule cell recordings, the pipette was filled with an intracellular solution containing the following (in mm): 145 CsCl, 10 HEPES, 1 EGTA, 5 MgCl2, 0.1 CaCl2, 4 ATP-Na2, and 0.4 GTP-Na, with pH adjusted to 7.35 by N-methyl-d-glucamine. Alexa 488 at 100 μm (Molecular Probes, Eugene, OR) was added to these intracellular solutions to allow on-line visualization of recorded cells with a high-resolution digital camera (CoolSNAP HQ; Roper Scientific, Trenton, NJ) and a wavelength switcher illumination system (Lambda DG-4; Sutter Instruments, Novato, CA). In some cases, the dye was replaced by 4 mg/ml Neurobiotin (Vector Laboratories) for off-line confocal observation. Recordings were made with an Axopatch 200B and an Axopatch-1D amplifier (Axon Instruments, Union City, CA). The signal was filtered at 2 kHz and sampled at 5-20 kHz with a Digidata 1200 interface (Axon Instruments). Golgi cells were recorded in the current-clamp mode. Action potentials were elicited by short depolarizing current steps (500 pA for 1 ms). UBCs and granule cells were voltage clamped at -70 mV. Ionotropic glutamate receptors were blocked with 2 μm 1,2,3,4-dihydro-2,3-dioxo-benzoquinoxaline-7-sulfonamide (NBQX) and 50 μmd-APV. GlyRs were blocked with 300-600 nm strychnine. GABAARs were blocked with 5 μm SR 95531 [6-imino-3-(4-methoxyphenyl)-1(6H)-pyridazinebutanoic acid hydrobromide] (SR). All drugs were bath applied.
Identification of cell types during electrophysiological recordings. Cells could be easily identified according to their capacitive currents and morphology. Granule cells had a fast monoexponential capacitive current with a capacitance of <4 pF. UBCs had a slower capacitive current and a capacitance between 10 and 20 pF. UBCs and granule cells were visualized during recording (see above) and could be easily distinguished according to their morphology. Granule cells had a classical morphology with a small round soma (4-7 μm) and several dendrites. UBCs had an ovoid cell body (10 μm) and a single thick dendrite terminating in a spray of dendrioles. Golgi cells could be unambiguously differentiated from other cells in the granular layer by the size of their soma (10-25 μm) and their biexponential capacitive current (Dieudonne, 1995).
Combined electrophysiological recording and immunohistochemistry. Neurobiotin (4 mg/ml; Vector Laboratories) was added to the intracellular solution. Golgi cells were filled with the tracer through the patch pipette. After recording, slices were fixed overnight in 4% paraformaldehyde at 4°C and processed for immunocytochemistry. Neurobiotin was revealed with FITC-coupled streptavidin. An anti-gephyrin monoclonal antibody (see above) was used and revealed by a Cy3-coupled donkey anti-mouse IgG. Two non-overlapping populations of UBCs can be distinguished by their immunoreactivity against the calcium-binding protein CR and mGluR1α (Nunzi et al., 2002). To label all UBCs independently of the expressed marker, a mixture of rabbit polyclonal anti-calretinin and rabbit polyclonal anti-mGluR1α antibodies (see above) was revealed with the same secondary antibody (a Cy5-coupled goat anti-rabbit IgG). Images were acquired on a Leica SP2 confocal microscope as described previously.
Electrophysiological data analysis. Data were analyzed off-line with custom-made routines written for the Igor PRO analysis environment (WaveMetrics, Lake Oswego, OR). For Golgi cell-UBC and Golgi cell-granule cell paired recordings, the response latency was measured as the delay between the action potential peak and the half-rise point of the postsynaptic current. IPSCs whose amplitude was below 20 pA were excluded from latency measurements to limit the effect of experimental noise on the position of the half-rise point. A standard algorithm was used to detect spontaneous IPSCs in UBCs and granule cell-UBC paired recordings. It consisted of a threshold detection performed on a discrete time derivative of the recorded trace, as described previously (Vincent and Marty, 1993). Cross-correlograms were generated based on the time of occurrence of IPSCs in each cell, as measured at their half-rise point. The average jitter distribution was generated by pooling all data after offsetting the cross-correlogram for each pair by the value of the mean lag. A predicted jitter distribution for granule cell-UBC pairs was computed from Golgi cell-UBC and Golgi cell-granule cell pairs as follows: first, for each pair, jitter distribution was offset by the value of the mean lag; then jitter distributions were pooled for granule cells and UBCs; finally, the two jitter distributions were convolved to produce the prediction for the granule cell-UBC jitter based on independence of release at all the synapses.
Statistical analysis. Electrophysiological results are reported as mean ± SD to account for cell-to-cell variability and skewed non-Gaussian distributions. For the same reason, all statistical tests were nonparametric, to prevent any assumption regarding parameter distribution. The Mann-Whitney U test and the sign test were used to test for statistical differences between two independent and two related samples, respectively. The bootstrap version of the Kolmogorov-Smirnov test was used to compare two distributions. Morphological quantifications are reported as mean ± SEM, and Student's t test was used to conclude that the percentages of colocalization of different markers were not significantly different between cerebellar lobules. For all tests, significance was assumed if p < 0.05.
Results
Golgi cells mediate GABAergic inhibition of granule cells and glycinergic inhibition of UBCs
Paired recordings were performed in cerebellar slices of lobule X (the nodular lobule of the vestibulocerebellum) to characterize the synapses between Golgi cells and their two target neurons, granule cells and UBCs. Action potentials in Golgi cells triggered current responses in 8 of 21 recorded granule cells (Fig. 1A) and in 11 of 25 recorded UBCs (Fig. 1B) (supplemental Fig. 1, available at www.jneurosci.org as supplemental material). Long-lasting paired recordings of connected Golgi cells and granule cells and of connected Golgi cells and UBCs were obtained in six and eight cases, respectively. The mean amplitude of the response was similar (Mann-Whitney U test) in granule cells (54 ± 41 pA; n = 6) and in UBCs (53 ± 58 pA; n = 8) (Fig. 1D,F). The latency of the responses was measured in both types of paired recordings (Fig. 1C,E), and Gaussian curves were fitted to latency histograms. Their mean value was taken as an estimate of the transmission delay, and their full-width at half-maximum was taken as a measure of the transmission jitter. The transmission delays measured in granule cells (1.10 ± 0.30 ms; n = 6) and in UBCs (1.05 ± 0.10 ms; n = 6) were similar (Mann-Whitney U test) and in agreement with a monosynaptic transmission at near-physiological temperature. The transmission jitter was also similar (Mann-Whitney U test) in granule cells (0.35 ± 0.15 ms; n = 6) and UBCs (0.35 ± 0.10 ms; n = 6). Thus, the two synapses are comparable in terms of speed of transmission and postsynaptic conductances.
Figure 1.

Golgi cells evoke IPSCs in granule cells and UBCs with different pharmacological profiles. A, B, Short depolarizing current steps (500 pA, 1 ms) triggered single action potentials in Golgi cells. Superposition of 10 consecutive action potentials and the corresponding current responses in a granule cell (A) and in a UBC (B). Vh, Holding potential (-70 mV). C, E, Histograms of the response latency in a granule cell and in a UBC, respectively. D, F, Average amplitude histograms of the current response in six granule cells and seven UBCs, respectively (bin, 20 pA). Scaled histograms of the noise amplitude (7.9 ± 4.6 pA in granule cells and 4.9 ± 1.6 pA in UBCs) are superimposed in black (bin, 10 pA). G, Example of the effect of 5 μm SR on the mean postsynaptic response in a granule cell. H, Plot of the absolute amplitude of postsynaptic responses in six granule cells in control conditions and after application of 5 μm SR (*p < 0.04, sign test). I, Effect of 600 nm strychnine on the mean postsynaptic response in a UBC. J, Plot of the absolute amplitude of postsynaptic responses in eight UBCs in control conditions, after the application of 600 nm strychnine (*p < 0.01, sign test) and after consecutive application of 5 μm SR. ctrl, Control; str, strychnine.
We characterized the pharmacological profile of postsynaptic responses to determine which neurotransmitter was used at each synapse (Fig. 1G,I). In granule cells, bath application of 5 μm SR, an antagonist of GABAARs, decreased the response amplitude to 2.8 ± 5.2% (n = 6) of its control value (Fig. 1H), in agreement with published data (Rossi and Hamann, 1998; Farrant and Brickley, 2003). In contrast, bath application of 600 nm strychnine, an antagonist of GlyRs, decreased significantly (p < 0.01, sign test) the mean amplitude of the response recorded from UBCs to 35 ± 34% (n = 8) of its control value (Fig. 1J). In some cases (n = 3), the block was complete, indicating a purely glycinergic transmission. In other cases, a variable strychnine-resistant component remained and was reduced to 1.9 ± 2.8% (n = 4) of its value by application of 5 μm SR. Thus, Golgi cells evoke GABAergic IPSCs in granule cells and glycinergic or mixed GABAergic and glycinergic IPSCs in UBCs.
The absence of a GABAergic component at some Golgi cell to UBC connections may represent the extremum of a continuous distribution of GABAergic contributions at different Golgi cell to UBC connections. To better estimate this distribution, we examined the effect of 600 nm strychnine on the spontaneous synaptic activity recorded from 47 UBCs in the presence of 2 μm NBQX and 50 μm d-APV (Fig. 2C). In 38% of the cells, the cumulative activity (CA) (the product of the mean amplitude with the mean frequency of spontaneous IPSCs) was totally suppressed, that is, no event was detected (Fig. 2A). In the other cells, the CA was partially inhibited to an average of 40 ± 31% (n = 29) of its control value (p < 0.01, sign test) (Fig. 2B). The remaining activity was blocked by application of 10 μm SR (n = 17) (Fig. 2B). Thus, as with paired recordings, a large fraction of UBCs received pure glycinergic inhibition. In addition, the frequency of spontaneous IPSCs was significantly (p < 0.01, sign test) decreased to 17 ± 20% (n = 16) of its control value after application of 500 nm tetrodotoxin, indicating that the majority of spontaneous IPSCs were action potential dependent (data not shown).
Figure 2.

The spontaneous inhibitory activity recorded from UBCs has a variable sensitivity to strychnine. A, B, Plots of the peak amplitude of detected spontaneous IPSCs, illustrating the two pharmacological profiles observed: a fully glycinergic profile (A) or a mixed glycinergic and GABAergic profile (B). C, Histogram showing the remaining cumulative activity (product of the amplitude and frequency) after the bath application of 300-600 μm strychnine (in percentage of the control cumulative activity). The detection threshold was set to 15 pA. str, Strychnine.
A single Golgi cell can mediate GABAergic and glycinergic inhibition
The expression pattern of several histochemical markers has led to the hypothesis that the cerebellar granular layer may host several subtypes of inhibitory interneurons (Geurts et al., 2003). We thus wondered whether inhibition of UBCs was mediated by a specific Golgi cell subtype. Individual Golgi cells (n = 3) were labeled with Neurobiotin, and the putative synaptic contacts made by their axons in the granular layer were identified by their apposition with gephyrin, a postsynaptic marker of both GABAergic and glycinergic synapses (Moss and Smart, 2001). In addition, the dendritic brushes of UBCs were revealed by immunodetection of specific markers (see Materials and Methods). Axonal varicosities of a single Golgi cell were found apposed to both gephyrin clusters located in glomeruli devoid of UBCs and gephyrin clusters located on UBC dendrites (supplemental Fig. 2, available at www.jneurosci.org as supplemental material). A total of 36 ± 3% of the glomeruli contacted by the axon of Golgi cells contained the dendritic brush of a UBC (110 glomeruli; n = 3 cells). Thus, a single type of Golgi cell may contact both granule cells and UBCs.
To determine whether functional contacts are made with both types of postsynaptic partners, spontaneous IPSCs were recorded simultaneously from neighboring granule cells (gIPSCs) and UBCs (uIPSCs) (Fig. 3A). Antagonists of ionotropic glutamate receptors (NBQX and d-APV) were added to the bath to prevent synaptically triggered synchronization of presynaptic Golgi cells. In each recorded pair, the temporal relationship between gIPSCs and uIPSCs was estimated by generating cross-correlation histograms (see Materials and Methods). In 75% (n = 21 of 28) of paired recordings, cross-correlograms had a marked peak at approximately zero (Fig. 3B). On average, this peak accounted for 21 ± 16% of the events detected in UBCs and for 34 ± 26% of the events detected in granule cells. The mean lag between gIPSCs and uIPSCs (mean value of the Gaussian fit) was 0.02 ± 0.18 ms (n = 12) and never exceeded 0.36 ms. The average jitter of the lag between gIPSCs and uIPSCs (full-width at half-maximum of the Gaussian fit) was 0.50 ± 0.12 ms (n = 12). The distribution of the jitter was indistinguishable (bootstrap Kolmogorov-Smirnov) from that obtained by convolution of the data from Golgi-granule cell and Golgi-UBC pairs (Fig. 3C) (see Materials and Methods), which predicts the jitter for independent release at synapses of the same axon. Thus, synchronous gIPSCs and uIPSCs are elicited by the same presynaptic Golgi cell.
Figure 3.
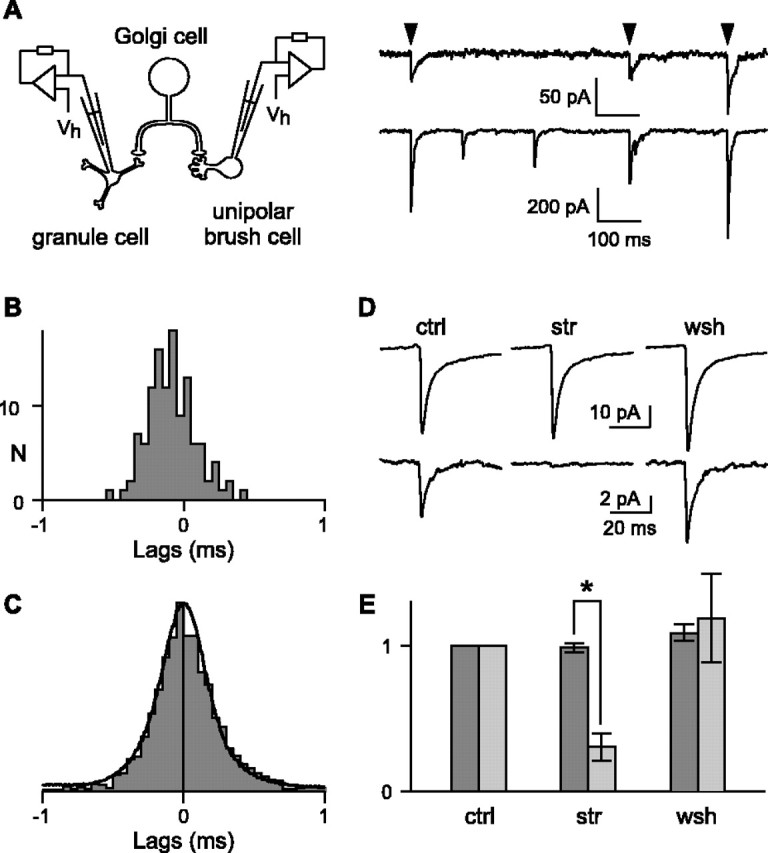
Pharmacology of IPSCs triggered by the same presynaptic Golgi cell in granule cells and UBCs. A, Synchronous spontaneous IPSCs (arrowheads) in a granule cell (top) and in a UBC (bottom). Vh, Holding potential (-70 mV). B, Corresponding cross-correlogram (bin, 50 μs). C, Convolution of pooled latencies at Golgi cell-UBC and Golgi cell-granule cell synapses (dark line) superimposed on the distribution of the jitter between uIPSCs and gIPSCs (gray; bin, 50 μs). The two distributions do not differ significantly (bootstrap Kolmogorov-Smirnov). D, Average IPSC in a granule cell (top) and average synchronous current in the UBC (bottom). ctrl, Control; str, strychnine; wsh, washout. E, Average amplitudes, normalized to their control value, of gIPSCs (dark gray) and synchronous currents in UBCs (light gray) during strychnine application (n = 12) and after 20 min washout (n = 5). The effect of strychnine is significantly different for gIPSCs and for synchronous currents in UBCs (*p < 0.01, Mann-Whitney U test). The error bars represent the SEM.
The pharmacological profile of gIPSCs and uIPSCs was investigated by bath application of 600 nm strychnine. gIPSCs were detected during the control period, during drug application, and after washout. As expected for purely GABAergic currents, the amplitude and the frequency of spontaneous gIPSCs were not affected (sign test) by strychnine (99 ± 11 and 101 ± 35% of their control value, respectively; n = 14). Spontaneous gIPSCs are thus reliable reporters of the activity of presynaptic Golgi cells and can be used as time marks to analyze the effect of strychnine on synchronous uIPSCs arising from the same presynaptic Golgi cell. Average synchronous uIPSCs were significantly (p < 0.01, sign test) and reversibly blocked to 30 ± 32% (n = 12) of their control amplitude during strychnine application (Fig. 3D,E). In two pairs, synchronous uIPSCs were completely blocked by strychnine. Therefore, a single Golgi cell can mediate simultaneously GABAergic inhibition of granule cells and glycinergic or mixed inhibition of UBCs.
Presynaptic markers of GABAergic and glycinergic transmission are not segregated
The previous results show that Golgi cells are mixed inhibitory interneurons that perform target-specific GABAergic, glycinergic, and mixed transmission. This phenotypic specialization may be of presynaptic (transmitter release) and/or postsynaptic (receptor expression and clustering) origin. Synapse-specific GABA or glycine release could, in principle, be achieved by segregation of GAD and GlyT2 at different varicosities. Double-immunostaining experiments showed that GAD and GlyT2 were not strictly colocalized. Only 81.8 ± 2.8% (n = 484) of the GAD-positive profiles were also immunopositive for GlyT2. This proportion was determined using wide-field CCD camera images and decreased to 49.5 ± 1.3% (n = 1234) when the same samples were quantified using single confocal optical sections (Fig. 4A). This discrepancy could result from the location of GlyT2 on the plasma membrane, as opposed to the intracellular location of GAD. Indeed, GAD and VIAAT, which are both intracellular molecules, were highly colocalized at immunoreactive puncta (98.9 ± 0.4%; n = 533; confocal observations) (Fig. 4B). Thus, GAD, as well as VIAAT (Dumoulin et al., 1999), are reliable markers of inhibitory varicosities in this system. GlyT2, however, could also be detected in axonal segments or at the periphery of varicosities, as defined by their VIAAT immunoreactivity (data not shown), and was almost always detected adjacent to GAD-immunoreactive puncta (Fig. 4A3). Thus, GAD-GlyT2 segregation appears to reflect different subcellular distributions rather than the specialization of two populations of varicosities. To confirm that GlyT2 was not expressed selectively at synapses on UBCs, we compared GlyT2 staining in vestibular (lobule X) and nonvestibular (e.g., lobule VI) cerebellar lobules, which contain high and low numbers of UBCs, respectively. We found that GlyT2 immunoreactivity was comparable in lobules X (Fig. 4C) and VI (Fig. 4D). Furthermore, similar values (Student's t test) were found within lobules X and VI for GAD and GlyT2 colocalization (49.5 ± 1.3%, n = 1234 vs 49.1 ± 1.9%, n = 1321, respectively) and GAD and VIAAT colocalization (98.9 ± 0.4%, n = 533 vs 98.8 ± 0.5%, n = 579, respectively).
Figure 4.

Immunohistochemical characterization of Golgi cell axon terminals. A, Partial colocalization of the glycinergic marker GlyT2 (A1) and the GABAergic marker GAD65 (A2) in the same glomerular structures. Note the characteristic GAD65 presynaptic terminal staining pattern, contrasting with the broader GlyT2-IR. A3, Superposition of A1 and A2, indicating that GlyT2-IR either colocalizes (arrows) or is apposed (asterisks and inset) to GAD65-IR. B, Massive colocalization (arrows) of GAD65-IR (B1) and VIAAT-IR (B2), as seen on superimposed images on B3. C, D, Immunodetection of GlyT2 in lobules X and VI, respectively. Note the comparable staining pattern in the granule cell layer of both lobules. Insets, Higher magnification showing GlyT2-IR profiles likely to be Golgi cell axon terminals (arrows) within a glomerulus. E, F, Glycine and GABA immunodetection in Golgi cell terminal. Both are detected in periglomerular profiles (arrows) of lobules X (E1, E2, E3) and VI (F1, F2, F3). Note that different expression levels are detected within each varicosity. A, B, Single confocal sections; C, D, wide-field CCD camera images; E, F, projection of three confocal sections (0.48 μm between each section). Scale bars: A, B, E, F, 5 μm; C, D, 100 μm; inset in A, 1 μm; insets in C, D, 10 μm.
In the absence of GAD and GlyT2 segregation, synapse-specific transmitter release could be achieved by selective vesicular accumulation of GABA or glycine. We thus investigated directly the presence of glycine and GABA in presynaptic varicosities by double immunostaining. We found that the two amino acids were colocalized in axon terminals (Fig. 4E, F), in which immunostaining is markedly enhanced compared with cell bodies or main axodendritic shafts. The number of costained varicose profiles did not significantly differ between lobules X and VI (75.4 ± 2.8%, n = 577 vs 81.6 ± 2.7%, n = 928, respectively; Student's t test). This is consistent with electron microscopy studies (Ottersen et al., 1988). Because a similar percentage of colocalization is seen at the level of Golgi cell bodies (Ottersen et al., 1988), it may indicate that 20% of Golgi cells contain predominantly GABA or glycine. Altogether, these data show that presynaptic markers of glycinergic transmission are not preferentially associated with Golgi cell to UBC synapses.
Expression of postsynaptic receptors correlates with the transmission phenotype
In the absence of presynaptic differentiation, the target specificity of the transmission at Golgi cell synapses could be attributable to the selective expression and/or clustering of GABAAR and GlyR by postsynaptic neurons. If this were true, glycinergic transmission observed at Golgi-UBC synapses would result from the selective expression of GlyRs in UBCs but not in granule cells. Many aggregates of GlyR-positive clusters were stained by pan-GlyR immunohistochemistry in the granule cell layer of lobule X (Fig. 5A). Such clusters were seen only rarely in the granular layer of lobule VI (Fig. 5B). To quantify GlyR-positive clusters, glomeruli were outlined by VIAAT immunostaining of Golgi cell axonal varicosities. Double detection of GlyR and VIAAT (Fig. 5C,D) showed that GlyR was present in 33.3 ± 2.1% (n = 352) of the glomeruli in lobule X. The spatial relationship between GlyR clusters and the dendritic brushes of the two classes of UBCs (Nunzi et al., 2002) was defined using their immunoreactivity toward CR and mGluR1α. GlyR aggregates were associated with the brush of all CR-positive (Fig. 5E) and all mGluR1α-positive (Fig. 5F) UBCs. When UBCs were labeled simultaneously for CR and mGluR1α (see Materials and Methods), 95.2 ± 1.5% (n = 212) of GlyR-immunoreactive glomerular-like structures were associated with UBC brushes. Thus, synaptic clustering of GlyR at UBCs but not in granule cell dendrites can account for the absence of a glycinergic component of IPSCs in granule cells.
Figure 5.

Expression of GlyRs by UBCs. A, B, Immunodetection of GlyR in lobules X and VI, respectively. Numerous GlyR-IR structures (arrows) within lobule X granular layer contrasting with small numbers of GlyR-IR profiles (arrows) in lobule VI. C, F, Double detection of GlyR and different markers in the granular layer of lobule X. C, Codetection of VIAAT (green) and GlyR (red) indicating that only a subpopulation of glomeruli expresses GlyR-IR (arrows). D, High magnification of a glomerulus with presynaptic VIAAT-IR (green) apposed (arrows) to postsynaptic GlyR clusters (red). E, GlyR aggregates (red, arrows) on the dendritic brush of a CR-positive UBC (green). F, GlyR aggregates (red, arrows) are also detected on mGluR1α-IR (green) UBC dendrioles. A-F, Wide-field CCD camera images. Scale bars: A, B, 100 μm; C, 20 μm; D-F, 5 μm.
Because Golgi cells provide the only known inhibitory input to granule cells and UBCs, the presence or absence of receptors postsynaptic to Golgi cell synapses can be inferred directly from the response of the postsynaptic cells to bath application of GABA or glycine agonists (Fig. 6). Application of 100 μm glycine to postnatal day 19 (P19) to P22 granule cells of lobule X did not evoke any single-channel activity, and the response measured as an average current (6 ± 15 pA; n = 7) was not significantly different from zero (sign test), in agreement with previous reports in other lobules (Wall and Usowicz, 1997). Muscimol (5 μm) evoked a significantly greater (p < 0.01, Mann-Whitney U test) response of 255 ± 145 pA (n = 7). UBCs that received mixed synaptic inhibition responded to glycine and muscimol applications with currents of similar amplitudes (331 ± 173 pA, n = 11 and 429 ± 241 pA, n = 15, respectively). In contrast, UBCs receiving pure glycinergic inhibition had a large glycinergic current (289 ± 171 pA; n = 9) but a response to muscimol significantly smaller (p < 0.01, Mann-Whitney U test) than that of UBCs receiving mixed inhibition (38 ± 64 pA; n = 19). Thus, the expression pattern of postsynaptic GlyR and GABAAR correlates with the phenotype of inhibitory transmission at Golgi cell synapses on UBCs and granule cells.
Figure 6.

Granule cell and UBC responses to bath application of GABAAR and GlyR agonists. The effects of both agonists were compared in two separate groups of UBCs. UBCs were sorted into these groups according to the effect of strychnine on their spontaneous inhibitory synaptic activity. UBCs were considered to receive, respectively, purely glycinergic or mixed inhibition when their CA was reduced to less or more than 5% of its control value. A-C, Average responses of granule cells (A) and UBCs receiving mixed (B) or purely glycinergic (C) inhibition to bath application of 5 μm muscimol (dark gray bars) and 100 μm glycine (light gray bars). The response of granule cells to 100 μm glycine is significantly smaller than their response to 5 μm muscimol (*p < 0.01, Mann-Whitney U test) and not significantly different from zero (see Results). The current produced by 5 μm muscimol is significantly smaller in UBCs receiving purely glycinergic inhibition than in UBCs receiving mixed inhibition (*p < 0.01, Mann-Whitney U test). The error bars represent the SEM. msc, Muscimol; gly, glycine. D, Model of the postsynaptic selection of cotransmitters by the different targets of the Golgi cell. A Golgi cell releases both GABA and glycine at its terminals, but different types of transmission are recorded on three of its target cells. Specificity of the inhibition relies on the exclusive expression of GABAARs in granule cells, of GABAARs and GlyRs in some UBCs, and of GlyRs only in other UBCs.
Discussion
We have shown that Golgi cells evoke GABAergic IPSCs in granule cells but predominantly glycinergic IPSCs in UBCs. Labeling experiments performed in lobule X showed that the axon of a given Golgi cell invades numerous glomeruli, of which 36 ± 5% are occupied by the dendritic brush of a UBC. This corresponds to the overall percentage of glomeruli containing the dendrite of a UBC in lobule X (33 ± 2%) (Fig. 5C), indicating that Golgi cell axons innervate both types of glomeruli indifferently. The hypothesis that individual Golgi cells evoke IPSCs with different pharmacological profiles in granule cells and UBCs was investigated by recording spontaneous IPSCs simultaneously from gIPSCs and uIPSCs. Synchronous gIPSCs and uIPSCs are most likely triggered by action potentials occurring in the same presynaptic Golgi cell because the distribution of their lag could be predicted from the jitters of the synaptic latencies measured at the Golgi-granule cell and Golgi-UBC synapses. Synchronization of two distinct presynaptic Golgi cells by electrical synapses may provide an alternative explanation for the existence of synchronous IPSCs. The high synchronicity of gIPSCs and uIPSCs in our paired recordings strongly argues against this hypothesis. Whereas the mean lag between synchronous gIPSCs and uIPSCs never exceeded 360 μs, the typical delay between action potentials in electrically coupled neurons ranges from one to several milliseconds (Galarreta and Hestrin, 1999; Gibson et al., 1999; Mann-Metzer and Yarom, 1999; Beierlein et al., 2000; Hu and Bloomfield, 2003; Galarreta et al., 2004; Long et al., 2004). The lags between gIPSCs and uIPSCs have a sharp distribution with an average full-width at half-maximum of 500 μs, whereas the delays between action potentials in electrically coupled neurons have broader distributions, with full-widths at half-maximum comprised between one and several milliseconds. Furthermore, electrical coupling often produces bimodal cross-correlation histograms reflecting the equal probability for each cell to fire first and entrain the other (Galarreta et al., 2004), which was never observed here. Finally, the rate of synchronization in UBC-granule cell pairs corresponds to the rate of Golgi cell-UBC and Golgi cell-granule cell connection, as expected from random connectivity.
The pharmacological analysis of synchronous gIPSCs and uIPSCs confirmed that only uIPSCs are sensitive to strychnine. We performed immunohistochemical experiments to determine whether the segregation of the transmission phenotypes at Golgi cell synapses was of presynaptic or postsynaptic origin. No difference could be established between lobules containing a high density of UBCs and lobules devoid of UBCs when comparing the GlyT2 and the GABA and glycine staining profiles of the granular layer. Furthermore, the GABA and glycine stainings appeared to be highly colocalized, arguing against a functional segregation at the level of the axonal varicosities. In particular, the majority of Golgi cell varicosities that impinge on granule cells express GlyT2 and contain glycine. In contrast, immunohistochemical detection of GlyR revealed that UBCs express GlyRs, whereas granule cells do not. Bath applications of GABAARs and GlyRs agonists on recorded granule cells and UBCs confirmed this result and revealed that the expression of variable amounts of GABAARs in UBCs can account for the variability of the GABAAR component in those cells. The diverse postsynaptic GABAAR expression in UBCs may reflect a functional specialization, because UBCs form a variety of subpopulations expressing different markers (Nunzi et al., 2002, 2003). Alternatively, it may arise from a variability in the maturation state of UBCs at P17-P21. The neurogenesis of UBCs spreads over >1 week, although it is at the end of embryonic life (Sekerkova et al., 2004), and, at the morphological level, maturation of UBC-containing glomeruli is not completed until P28 (Morin et al., 2001). Because mixed inhibitory synapses always undergo maturation toward more glycinergic transmission (Kotak et al., 1998; Korada and Schwartz, 1999; Smith et al., 2000; Gao et al., 2001; Nabekura et al., 2004; Awatramani et al., 2005), our observation of a postsynaptic specialization between cell types would thus be even stronger in the adult.
Functional significance of a target-specific use of GABA and glycine
The preferential use of GABAARs or GlyRs by postsynaptic partners of the same mixed neurons has significant functional consequences. First, in all of the systems, GABAAR and GlyR expressed at the same synapse have different kinetics (Jonas et al., 1998; Chery and de Koninck, 1999; O'Brien and Berger, 1999; Dumoulin et al., 2001; Gonzalez-Forero and Alvarez, 2005) that speed up in parallel during development (Awatramani et al., 2005). In the spinal cord, fast glycinergic conductances have been proposed to efficiently hyperpolarize the cell, whereas smaller and slower GABAA components would control shunting and the time course of inhibition (Russier et al., 2002). Alternatively, differential modulations of GABAARs and GlyRs may permit fast and synapse-specific adaptation of inhibition to network states of activity. For instance, zinc ions are found in some inhibitory terminals (Wang et al., 2001) and in a fraction of glutamatergic terminals from which they are released and can spill over on nearby synapses (Li et al., 2003). Zinc ions inhibit some GABAARs (Hosie et al., 2003) and, at the same concentration, increase GlyR affinity (Laube et al., 1995) and slow down glycinergic IPSCs (Suwa et al., 2001). Another type of differential control occurs in the dorsal spinal cord, in which pain perception is decreased by neurosteroids and enhanced by inflammation through opposite modulations of GABAergic (Keller et al., 2004) and glycinergic (Harvey et al., 2004) synaptic currents. In this context, target-specific use of GABAergic or glycinergic inhibition may enable single mixed interneurons to control differentially multiple circuits. This is likely to be the case for Golgi cells that control, on the one hand, granule cells, which relay high-frequency burst firing of afferent mossy fibers (Chadderton et al., 2004), and, on the other hand, UBCs, involved in the divergent amplification and slow temporal integration of vestibular afferent inputs (Rossi et al., 1995).
Organization of circuits using cotransmitters
The multiple ways in which two transmitters released by the same neuron can be used differentially have been best studied in invertebrates. Presynaptic segregation has been described in Aplysia, in which bag cells release two types of peptides from separate branches of their axon (Sossin et al., 1990). A similar situation occurs in the decapod crustacean stomatogastric nervous system (STNS) in which the modulatory proctolin neuron releases GABA in the commissural ganglia (CoG) and proctolin in the stomatogastric ganglion (Blitz and Nusbaum, 1999). Studies on the STNS have also provided strong evidence that segregated actions of coreleased substances can be based on the selective expression of receptors by different target cells, as in the present study. This is the case for the gastropyloric cell (Katz and Harris-Warrick, 1989), for the modulatory commissural neuron 1 of the CoG (Swensen et al., 2000; Wood et al., 2000) and recently for an unidentified neuron putatively located in the CoG (Thirumalai and Marder, 2002).
An intermediate situation in which diffusion and probably recapture and enzymatic degradation differentially affect the action of cotransmitters is found in the frog sympathetic ganglion. Two populations of cells (the B and C cells) receive inputs from separate preganglionic fibers. The fibers innervating the C cells release acetylcholine (ACh) and a neuropeptide, the luteinizing hormone-releasing hormone (LHRH). Both substances elicit a response in C cells, but only the LHRH reaches the B cells, although they also express ACh receptors (Jan and Jan, 1982).
At the subcellular level, segregation of receptors may result in a differential effect of coreleased transmitters, as it has been demonstrated in layer I of the adult dorsal spinal cord (Chery and de Koninck, 1999). In this structure, miniature IPSCs are glycinergic, but a GABAergic component can be unmasked by application of benzodiazepines, indicating that GABAARs may be located extrasynaptically and activated by spillover during intense activity.
The present work provides the first demonstration of a cell-type-specific action of two fast cotransmitters released by the same neuron in the vertebrate CNS. It may apply to a large number of vertebrate neurons, because cotransmission is a common feature of the CNS (Burnstock, 2004). This principle may be used in pathways of the spinal cord and brainstem, in which GABA and glycine are often colocalized (Shupliakov et al., 1993; Ornung et al., 1994) but in which knowledge about synaptic connectivity is less detailed. It may also be used in circuits of the spinal cord dorsal horn, which use GABA and ATP as cotransmitters (Jo and Schlichter, 1999). In those circuits, virtually all neurons express GABAARs (Malcangio and Bowery, 1996; Coggeshall and Carlton, 1997), but only half of them express purinergic P2X receptors (Li and Perl, 1995; Jo et al., 1998). Glutamate and GABA are coreleased during postnatal development of future glutamatergic synapses (Walker et al., 2001; Gutierrez, 2003) or of future inhibitory synapses (Gillespie et al., 2005), as well as in the adult (Kao et al., 2004; Ottem et al., 2004). At specific stages of development, glutamate may also be coreleased with ACh (Li et al., 2004; Nishimaru et al., 2005) and with various monoamines, as assessed from the pattern of expression of vesicular glutamate transporters and vesicular monoamine transporters (Boulland et al., 2004). Thus, target-specific expression and activation of receptors may play a central role during development in the establishment, specification, and refinement of synaptic contacts. This mechanism would be extremely useful, because cell-to-cell signaling is not yet fully constrained by synaptic wiring and synapse independence. Target-specific neurotransmission may also occur when a neurotransmitter is released with one or several neuropeptides, a feature frequently found in the CNS (Burnstock, 2004) and somewhat analogous to the situation in the invertebrate nervous system. In the cases of paracrine and volume transmission, target-specific receptor expression would indeed be the only way to ensure selective cell-to-cell communication by chemical coding of transmission.
Footnotes
This work was supported by Centre National de la Recherche Scientifique, Institut National de la Santéet de la Recherche Médicale, and École Normale Supérieure and an Action Concertée Incitative grant from the French Ministry of Research (S.D.). We thank P. Ascher, A. Feltz, and C. Lena for helpful discussion and comments on this manuscript and Boris Barbour for help with data analysis. This work is dedicated to the late “Coco” Gerschenfeld.
Correspondence should be addressed to S. Dieudonné, Laboratoire de Neurobiologie, Unité Mixte de Recherche 8544, École Normale Supérieure, 46, rue d'Ulm, 75005 Paris, France. E-mail: dieudon@biologie.ens.fr.
Copyright © 2005 Society for Neuroscience 0270-6474/05/256490-09$15.00/0
G.P.D. and A.D. contributed equally to this work.
References
- Awatramani GB, Turecek R, Trussell LO (2005) Staggered development of GABAergic and glycinergic transmission in the MNTB. J Neurophysiol 93: 819-828. [DOI] [PubMed] [Google Scholar]
- Beierlein M, Gibson JR, Connors BW (2000) A network of electrically coupled interneurons drives synchronized inhibition in neocortex. Nat Neurosci 3: 904-910. [DOI] [PubMed] [Google Scholar]
- Blitz DM, Nusbaum MP (1999) Distinct functions for cotransmitters mediating motor pattern selection. J Neurosci 19: 6774-6783. [DOI] [PMC free article] [PubMed] [Google Scholar]
- Boulland JL, Qureshi T, Seal RP, Rafiki A, Gundersen V, Bergersen LH, Fremeau Jr RT, Edwards RH, Storm-Mathisen J, Chaudhry FA (2004) Expression of the vesicular glutamate transporters during development indicates the widespread corelease of multiple neurotransmitters. J Comp Neurol 480: 264-280. [DOI] [PubMed] [Google Scholar]
- Burnstock G (2004) Cotransmission. Curr Opin Pharmacol 4: 47-52. [DOI] [PubMed] [Google Scholar]
- Chadderton P, Margrie TW, Hausser M (2004) Integration of quanta in cerebellar granule cells during sensory processing. Nature 428: 856-860. [DOI] [PubMed] [Google Scholar]
- Chery N, de Koninck Y (1999) Junctional versus extrajunctional glycine and GABAA receptor-mediated IPSCs in identified lamina I neurons of the adult rat spinal cord. J Neurosci 19: 7342-7355. [DOI] [PMC free article] [PubMed] [Google Scholar]
- Coggeshall RE, Carlton SM (1997) Receptor localization in the mammalian dorsal horn and primary afferent neurons. Brain Res Brain Res Rev 24: 28-66. [DOI] [PubMed] [Google Scholar]
- Dieudonne S (1995) Glycinergic synaptic currents in Golgi cells of the rat cerebellum. Proc Natl Acad Sci USA 92: 1441-1445. [DOI] [PMC free article] [PubMed] [Google Scholar]
- Dino MR, Nunzi MG, Anelli R, Mugnaini E (2000) Unipolar brush cells of the vestibulocerebellum: afferents and targets. Prog Brain Res 124: 123-137. [DOI] [PubMed] [Google Scholar]
- Dumba JS, Irish PS, Anderson NL, Westrum LE (1998) Electron microscopic analysis of gamma-aminobutyric acid and glycine colocalization in rat trigeminal subnucleus caudalis. Brain Res 806: 16-25. [DOI] [PubMed] [Google Scholar]
- Dumoulin A, Rostaing P, Bedet C, Levi S, Isambert MF, Henry JP, Triller A, Gasnier B (1999) Presence of the vesicular inhibitory amino acid transporter in GABAergic and glycinergic synaptic terminal boutons. J Cell Sci 112: 811-823. [DOI] [PubMed] [Google Scholar]
- Dumoulin A, Triller A, Dieudonne S (2001) IPSC kinetics at identified GABAergic and mixed GABAergic and glycinergic synapses onto cerebellar Golgi cells. J Neurosci 21: 6045-6057. [DOI] [PMC free article] [PubMed] [Google Scholar]
- Farrant M, Brickley SG (2003) Properties of GABAA receptor-mediated transmission at newly formed Golgi-granule cell synapses in the cerebellum. Neuropharmacology 44: 181-189. [DOI] [PubMed] [Google Scholar]
- Galarreta M, Hestrin S (1999) A network of fast-spiking cells in the neocortex connected by electrical synapses. Nature 402: 72-75. [DOI] [PubMed] [Google Scholar]
- Galarreta M, Erdelyi F, Szabo G, Hestrin S (2004) Electrical coupling among irregular-spiking GABAergic interneurons expressing cannabinoid receptors. J Neurosci 24: 9770-9778. [DOI] [PMC free article] [PubMed] [Google Scholar]
- Gao BX, Stricker C, Ziskind-Conhaim L (2001) Transition from GABAergic to glycinergic synaptic transmission in newly formed spinal networks. J Neurophysiol 86: 492-502. [DOI] [PubMed] [Google Scholar]
- Geiman EJ, Knox MC, Alvarez FJ (2000) Postnatal maturation of gephyrin/glycine receptor clusters on developing Renshaw cells. J Comp Neurol 426: 130-142. [DOI] [PubMed] [Google Scholar]
- Geurts FJ, De Schutter E, Dieudonne S (2003) Unraveling the cerebellar cortex: cytology and cellular physiology of large-sized interneurons in the granular layer. Cerebellum 2: 290-299. [DOI] [PubMed] [Google Scholar]
- Gibson JR, Beierlein M, Connors BW (1999) Two networks of electrically coupled inhibitory neurons in neocortex. Nature 402: 75-79. [DOI] [PubMed] [Google Scholar]
- Gillespie DC, Kim G, Kandler K (2005) Inhibitory synapses in the developing auditory system are glutamatergic. Nat Neurosci 8: 332-338. [DOI] [PubMed] [Google Scholar]
- Gonzalez-Forero D, Alvarez FJ (2005) Differential postnatal maturation of GABAA, glycine receptor, and mixed synaptic currents in renshaw cells and ventral spinal interneurons. J Neurosci 25: 2010-2023. [DOI] [PMC free article] [PubMed] [Google Scholar]
- Gutierrez R (2003) The GABAergic phenotype of the “glutamatergic” granule cells of the dentate gyrus. Prog Neurobiol 71: 337-358. [DOI] [PubMed] [Google Scholar]
- Harvey RJ, Depner UB, Wassle H, Ahmadi S, Heindl C, Reinold H, Smart TG, Harvey K, Schutz B, Abo-Salem OM, Zimmer A, Poisbeau P, Welzl H, Wolfer DP, Betz H, Zeilhofer HU, Muller U (2004) GlyR alpha3: an essential target for spinal PGE2-mediated inflammatory pain sensitization. Science 304: 884-887. [DOI] [PubMed] [Google Scholar]
- Hosie AM, Dunne EL, Harvey RJ, Smart TG (2003) Zinc-mediated inhibition of GABA(A) receptors: discrete binding sites underlie subtype specificity. Nat Neurosci 6: 362-369. [DOI] [PubMed] [Google Scholar]
- Hu EH, Bloomfield SA (2003) Gap junctional coupling underlies the short-latency spike synchrony of retinal α ganglion cells. J Neurosci 23: 6768-6777. [DOI] [PMC free article] [PubMed] [Google Scholar]
- Jan LY, Jan YN (1982) Peptidergic transmission in sympathetic ganglia of the frog. J Physiol (Lond) 327: 219-246. [DOI] [PMC free article] [PubMed] [Google Scholar]
- Jo YH, Schlichter R (1999) Synaptic corelease of ATP and GABA in cultured spinal neurons. Nat Neurosci 2: 241-245. [DOI] [PubMed] [Google Scholar]
- Jo YH, Stoeckel ME, Schlichter R (1998) Electrophysiological properties of cultured neonatal rat dorsal horn neurons containing GABA and metenkephalin-like immunoreactivity. J Neurophysiol 79: 1583-1586. [DOI] [PubMed] [Google Scholar]
- Jonas P, Bischofberger J, Sandkuhler J (1998) Corelease of two fast neurotransmitters at a central synapse. Science 281: 419-424. [DOI] [PubMed] [Google Scholar]
- Kaneda M, Farrant M, Cull-Candy SG (1995) Whole-cell and single-channel currents activated by GABA and glycine in granule cells of the rat cerebellum. J Physiol (Lond) 485: 419-435. [DOI] [PMC free article] [PubMed] [Google Scholar]
- Kao YH, Lassova L, Bar-Yehuda T, Edwards RH, Sterling P, Vardi N (2004) Evidence that certain retinal bipolar cells use both glutamate and GABA. J Comp Neurol 478: 207-218. [DOI] [PubMed] [Google Scholar]
- Katz PS, Harris-Warrick RM (1989) Serotonergic/cholinergic muscle receptor cells in the crab stomatogastric nervous system. II. Rapid nicotinic and prolonged modulatory effects on neurons in the stomatogastric ganglion. J Neurophysiol 62: 571-581. [DOI] [PubMed] [Google Scholar]
- Keller AF, Coull JA, Chery N, Poisbeau P, De Koninck Y (2001) Region-specific developmental specialization of GABA-glycine cosynapses in laminas I-II of the rat spinal dorsal horn. J Neurosci 21: 7871-7880. [DOI] [PMC free article] [PubMed] [Google Scholar]
- Keller AF, Breton JD, Schlichter R, Poisbeau P (2004) Production of 5α-reduced neurosteroids is developmentally regulated and shapes GABAA miniature IPSCs in lamina II of the spinal cord. J Neurosci 24: 907-915. [DOI] [PMC free article] [PubMed] [Google Scholar]
- Korada S, Schwartz IR (1999) Development of GABA, glycine, and their receptors in the auditory brainstem of gerbil: a light and electron microscopic study. J Comp Neurol 409: 664-681. [DOI] [PubMed] [Google Scholar]
- Kotak VC, Korada S, Schwartz IR, Sanes DH (1998) A developmental shift from GABAergic to glycinergic transmission in the central auditory system. J Neurosci 18: 4646-4655. [DOI] [PMC free article] [PubMed] [Google Scholar]
- Laube B, Kuhse J, Rundstrom N, Kirsch J, Schmieden V, Betz H (1995) Modulation by zinc ions of native rat and recombinant human inhibitory glycine receptors. J Physiol (Lond) 483: 613-619. [DOI] [PMC free article] [PubMed] [Google Scholar]
- Li J, Perl ER (1995) ATP modulation of synaptic transmission in the spinal substantia gelatinosa. J Neurosci 15: 3357-3365. [DOI] [PMC free article] [PubMed] [Google Scholar]
- Li WC, Soffe SR, Roberts A (2004) Glutamate and acetylcholine corelease at developing synapses. Proc Natl Acad Sci USA 101: 15488-15493. [DOI] [PMC free article] [PubMed] [Google Scholar]
- Li YV, Hough CJ, Sarvey JM (2003) Do we need zinc to think? Sci STKE 2003: pe19. [DOI] [PubMed] [Google Scholar]
- Long MA, Landisman CE, Connors BW (2004) Small clusters of electrically coupled neurons generate synchronous rhythms in the thalamic reticular nucleus. J Neurosci 24: 341-349. [DOI] [PMC free article] [PubMed] [Google Scholar]
- Malcangio M, Bowery NG (1996) GABA and its receptors in the spinal cord. Trends Pharmacol Sci 17: 457-462. [DOI] [PubMed] [Google Scholar]
- Mann-Metzer P, Yarom Y (1999) Electrotonic coupling interacts with intrinsic properties to generate synchronized activity in cerebellar networks of inhibitory interneurons. J Neurosci 19: 3298-3306. [DOI] [PMC free article] [PubMed] [Google Scholar]
- McIntire SL, Reimer RJ, Schuske K, Edwards RH, Jorgensen EM (1997) Identification and characterization of the vesicular GABA transporter. Nature 389: 870-876. [DOI] [PubMed] [Google Scholar]
- Morin F, Dino MR, Mugnaini E (2001) Postnatal differentiation of unipolar brush cells and mossy fiber-unipolar brush cell synapses in rat cerebellum. Neuroscience 104: 1127-1139. [DOI] [PubMed] [Google Scholar]
- Moss SJ, Smart TG (2001) Constructing inhibitory synapses. Nat Rev Neurosci 2: 240-250. [DOI] [PubMed] [Google Scholar]
- Mugnaini E, Floris A (1994) The unipolar brush cell: a neglected neuron of the mammalian cerebellar cortex. J Comp Neurol 339: 174-180. [DOI] [PubMed] [Google Scholar]
- Nabekura J, Katsurabayashi S, Kakazu Y, Shibata S, Matsubara A, Jinno S, Mizoguchi Y, Sasaki A, Ishibashi H (2004) Developmental switch from GABA to glycine release in single central synaptic terminals. Nat Neurosci 7: 17-23. [DOI] [PubMed] [Google Scholar]
- Nishimaru H, Restrepo CE, Ryge J, Yanagawa Y, Kiehn O (2005) Mammalian motor neurons corelease glutamate and acetylcholine at central synapses. Proc Natl Acad Sci USA 102: 5245-5249. [DOI] [PMC free article] [PubMed] [Google Scholar]
- Nunzi MG, Shigemoto R, Mugnaini E (2002) Differential expression of calretinin and metabotropic glutamate receptor mGluR1alpha defines subsets of unipolar brush cells in mouse cerebellum. J Comp Neurol 451: 189-199. [DOI] [PubMed] [Google Scholar]
- Nunzi MG, Russo M, Mugnaini E (2003) Vesicular glutamate transporters VGLUT1 and VGLUT2 define two subsets of unipolar brush cells in organotypic cultures of mouse vestibulocerebellum. Neuroscience 122: 359-371. [DOI] [PubMed] [Google Scholar]
- O'Brien JA, Berger AJ (1999) Cotransmission of GABA and glycine to brain stem motoneurons. J Neurophysiol 82: 1638-1641. [DOI] [PubMed] [Google Scholar]
- O'Brien JA, Berger AJ (2001) The nonuniform distribution of the GABAA receptor α 1 subunit influences inhibitory synaptic transmission to motoneurons within a motor nucleus. J Neurosci 21: 8482-8494. [DOI] [PMC free article] [PubMed] [Google Scholar]
- Ornung G, Shupliakov O, Ottersen OP, Storm-Mathisen J, Cullheim S (1994) Immunohistochemical evidence for coexistence of glycine and GABA in nerve terminals on cat spinal motoneurones: an ultrastructural study. NeuroReport 5: 889-892. [DOI] [PubMed] [Google Scholar]
- Ottem EN, Godwin JG, Krishnan S, Petersen SL (2004) Dual-phenotype GABA/glutamate neurons in adult preoptic area: sexual dimorphism and function. J Neurosci 24: 8097-8105. [DOI] [PMC free article] [PubMed] [Google Scholar]
- Ottersen OP, Storm-Mathisen J, Somogyi P (1988) Colocalization of glycine-like and GABA-like immunoreactivities in Golgi cell terminals in the rat cerebellum: a postembedding light and electron microscopic study. Brain Res 450: 342-353. [DOI] [PubMed] [Google Scholar]
- Rossi DJ, Hamann M (1998) Spillover-mediated transmission at inhibitory synapses promoted by high affinity alpha6 subunit GABAA receptors and glomerular geometry. Neuron 20: 783-795. [DOI] [PubMed] [Google Scholar]
- Rossi DJ, Alford S, Mugnaini E, Slater NT (1995) Properties of transmission at a giant glutamatergic synapse in cerebellum: the mossy fiber-unipolar brush cell synapse. J Neurophysiol 74: 24-42. [DOI] [PubMed] [Google Scholar]
- Russier M, Kopysova IL, Ankri N, Ferrand N, Debanne D (2002) GABA and glycine co-release optimizes functional inhibition in rat brainstem motoneurons in vitro. J Physiol (Lond) 541: 123-137. [DOI] [PMC free article] [PubMed] [Google Scholar]
- Sagne C, El Mestikawy S, Isambert MF, Hamon M, Henry JP, Giros B, Gasnier B (1997) Cloning of a functional vesicular GABA and glycine transporter by screening of genome databases. FEBS Lett 417: 177-183. [DOI] [PubMed] [Google Scholar]
- Schneider SP, Fyffe RE (1992) Involvement of GABA and glycine in recurrent inhibition of spinal motoneurons. J Neurophysiol 68: 397-406. [DOI] [PubMed] [Google Scholar]
- Sekerkova G, Ilijic E, Mugnaini E (2004) Time of origin of unipolar brush cells in the rat cerebellum as observed by prenatal bromodeoxyuridine labeling. Neuroscience 127: 845-858. [DOI] [PubMed] [Google Scholar]
- Shupliakov O, Ornung G, Brodin L, Ulfhake B, Ottersen OP, Storm-Mathisen J, Cullheim S (1993) Immunocytochemical localization of amino acid neurotransmitter candidates in the ventral horn of the cat spinal cord: a light microscopic study. Exp Brain Res 96: 404-418. [DOI] [PubMed] [Google Scholar]
- Smith AJ, Owens S, Forsythe ID (2000) Characterisation of inhibitory and excitatory postsynaptic currents of the rat medial superior olive. J Physiol (Lond) 529: 681-698. [DOI] [PMC free article] [PubMed] [Google Scholar]
- Sossin WS, Sweet-Cordero A, Scheller RH (1990) Dale's hypothesis revisited: different neuropeptides derived from a common prohormone are targeted to different processes. Proc Natl Acad Sci USA 87: 4845-4848. [DOI] [PMC free article] [PubMed] [Google Scholar]
- Suwa H, Saint-Amant L, Triller A, Drapeau P, Legendre P (2001) High-affinity zinc potentiation of inhibitory postsynaptic glycinergic currents in the zebrafish hindbrain. J Neurophysiol 85: 912-925. [DOI] [PubMed] [Google Scholar]
- Swensen AM, Golowasch J, Christie AE, Coleman MJ, Nusbaum MP, Marder E (2000) GABA and responses to GABA in the stomatogastric ganglion of the crab Cancer borealis. J Exp Biol 203: 2075-2092. [DOI] [PubMed] [Google Scholar]
- Taal W, Holstege JC (1994) GABA and glycine frequently colocalize in terminals on cat spinal motoneurons. NeuroReport 5: 2225-2228. [DOI] [PubMed] [Google Scholar]
- Tanaka I, Ezure K (2004) Overall distribution of GLYT2 mRNA-containing versus GAD67 mRNA-containing neurons and colocalization of both mRNAs in midbrain, pons, and cerebellum in rats. Neurosci Res 49: 165-178. [DOI] [PubMed] [Google Scholar]
- Thirumalai V, Marder E (2002) Colocalized neuropeptides activate a central pattern generator by acting on different circuit targets. J Neurosci 22: 1874-1882. [DOI] [PMC free article] [PubMed] [Google Scholar]
- Todd AJ (1990) An electron microscope study of glycine-like immunoreactivity in laminae I-III of the spinal dorsal horn of the rat. Neuroscience 39: 387-394. [DOI] [PubMed] [Google Scholar]
- Todd AJ, Watt C, Spike RC, Sieghart W (1996) Colocalization of GABA, glycine, and their receptors at synapses in the rat spinal cord. J Neurosci 16: 974-982. [DOI] [PMC free article] [PubMed] [Google Scholar]
- Vincent P, Marty A (1993) Neighboring cerebellar Purkinje cells communicate via retrograde inhibition of common presynaptic interneurons. Neuron 11: 885-893. [DOI] [PubMed] [Google Scholar]
- Walker MC, Ruiz A, Kullmann DM (2001) Monosynaptic GABAergic signaling from dentate to CA3 with a pharmacological and physiological profile typical of mossy fiber synapses. Neuron 29: 703-715. [DOI] [PubMed] [Google Scholar]
- Wall MJ, Usowicz MM (1997) Development of action potential-dependent and independent spontaneous GABAA receptor-mediated currents in granule cells of postnatal rat cerebellum. Eur J Neurosci 9: 533-548. [DOI] [PubMed] [Google Scholar]
- Wang Z, Li JY, Dahlstrom A, Danscher G (2001) Zinc-enriched GABAergic terminals in mouse spinal cord. Brain Res 921: 165-172. [DOI] [PubMed] [Google Scholar]
- Wentzel PR, De Zeeuw CI, Holstege JC, Gerrits NM (1993) Colocalization of GABA and glycine in the rabbit oculomotor nucleus. Neurosci Lett 164: 25-29. [DOI] [PubMed] [Google Scholar]
- Wood DE, Stein W, Nusbaum MP (2000) Projection neurons with shared cotransmitters elicit different motor patterns from the same neural circuit. J Neurosci 20: 8943-8953. [DOI] [PMC free article] [PubMed] [Google Scholar]