

Abstract
Voltage-gated channels in a retinal ganglion cell are necessary for spike generation. However, they also add noise to the graded potential and spike train of the ganglion cell, which may degrade its contrast sensitivity, and they may also amplify the graded potential signal. We studied the effect of blocking Na+ channels in a ganglion cell on its signal and noise amplitudes and its contrast sensitivity. A spot was flashed at 1–4 Hz over the receptive field center of a brisk transient ganglion cell in an intact mammalian retina maintained in vitro. We measured signal and noise amplitudes from its intracellularly recorded graded potential light response and measured its contrast detection thresholds with an “ideal observer.” When Na+ channels in the ganglion cell were blocked with intracellular lidocaine N-ethyl bromide (QX-314), the signal-to-noise ratio (SNR) decreased (p < 0.05) at all tested contrasts (2–100%). Likewise, bath application of tetrodotoxin (TTX) reduced the SNR and contrast sensitivity but only at lower contrasts (≤50%), whereas at higher contrasts, it increased the SNR and sensitivity. The opposite effect of TTX at high contrasts suggested involvement of an inhibitory surround mechanism in the inner retina. To test this hypothesis, we blocked glycinergic and GABAergic inputs with strychnine and picrotoxin and found that TTX in this case had the same effect as QX-314: a reduction in the SNR at all contrasts. Noise analysis suggested that blocking Na+ channels with QX-314 or TTX attenuates the amplitude of quantal synaptic voltages. These results demonstrate that Na+ channels in a ganglion cell amplify the synaptic voltage, enhancing the SNR and contrast sensitivity.
Keywords: retinal ganglion cell, contrast threshold, QX-314, tetrodotoxin, signal amplification, signal-to-noise ratio
Introduction
Voltage-gated membrane channels in a spiking neuron are necessary for spike generation, but they add noise to the spike train through several mechanisms. Their voltage gating is stochastic and therefore directly adds noise to the membrane current. In addition, below spike threshold, the voltage sensitivity of Na+ channels and the resulting modulation of regenerative currents can amplify noise from channels and synaptic inputs. This suggests that the function of voltage-gated channels is a trade-off between coding information and adding noise to the spike train (Schneidman et al., 1998; White et al., 2000; van Rossum et al., 2003).
In a retinal ganglion cell, the spike generator limits the efficiency by which visual information is transferred to spikes and thus to the brain (Dhingra and Smith, 2004). This loss of information originates in several mechanisms: the threshold for spiking, the limited rate at which the spike generator can sample the graded membrane potential, and noise generated by voltagegated ion channels (van Rossum et al., 2003; Dhingra and Smith, 2004). Voltage-gated channels are mainly localized in the axon hillock and the initial segment of the ganglion cell axon (Wollner and Catterall, 1986; Boiko et al., 2003), but they have also been found in dendrites (Velte and Masland, 1999). Compartmental models indicate that dendritic voltage-gated channels in the ganglion cell are necessary for the spike rate to be appropriately modulated (Fohlmeister and Miller, 1997a,b; Sheasby and Fohlmeister, 1999). Furthermore, the extended dendritic tree sums noise from its synaptic inputs and voltage-gated channels in multiple compartments, generating more spike train variability than a single compartment with identical numbers of channels and synaptic inputs (van Rossum et al., 2003). These observations imply that the distribution of voltage-gated ion channels in the dendrites of a neuron can affect the processing it performs, in particular, how it sums signal and noise.
However, voltage-gated channels can also amplify the subthreshold signal (Stuart and Sakmann, 1995; Juusola et al., 2003; Niven et al., 2003; Ichinose et al., 2005), complicating their role because amplification from voltage-gating has been suggested to increase the signal-to-noise ratio (SNR) of membrane currents (Juusola and French, 1997). Here we investigated the role of voltage-gated Na+ channels in a brisk transient ganglion cell in modulating the signal and noise properties of the cell. We measured the effect of blocking these channels on the SNR and calculated quantal size using fluctuation analysis (Freed, 2000a,b). We also measured contrast detection thresholds in the graded potential response using an ideal observer method (Dhingra and Smith, 2004) and their modulation by Na+ channels. The results imply that Na+ channels in a ganglion cell not only add noise but also amplify the visual signal by increasing the quantal amplitude of postsynaptic potentials (PSPs). Furthermore, the activation of Na+ channels amplifies the signal more than the noise, thus improving the contrast sensitivity of the ganglion cell.
Materials and Methods
Stimulation and recording. These methods have been described in detail previously (Dhingra et al., 2003; Dhingra and Smith, 2004; Xu et al., 2005). Briefly, a retina attached to choroid and sclera was removed from an anesthetized adult guinea pig, placed into a perfusion chamber on a microscope stage (BX50WI; Olympus Optical, Tokyo, Japan), and super-fused with oxygenated Ames medium (4–7 ml/min at 35–37°C, 5% CO2 and 95% O2), and visualized through infrared differential interference contrast optics.
We targeted brisk transient ganglion cells, identified by the largest somata (15–25 μm diameter) in the visual streak, for intracellular recording with a sharp electrode containing 1.5 m potassium acetate (tip resistance, 70–200 MΩ), using a mechanical manipulator (Narishige, Tokyo, Japan). The voltage was sampled at 5 kHz, amplified (Neurodata IR-283; Cygnus Technologies, Delaware Water Gap, PA), and stored in digital form (Axoscope; Molecular Devices, Union City, CA). After recording, some cells (n = 4) were stained with DiI. Spikes were recognized based on rate of voltage change (dV/dt) exceeding a criterion value (typically 20–60 V/s), and were removed by an algorithm that substituted a straight line for data points from specified times (typically –0.4 and +0.8 ms) before and after the initial rise of the spike. We found that the spike removal method was not critical because the spike duration was much smaller than the time bins used for analysis (see below).
Visual stimuli were generated in Matlab (MathWorks, Natick, MA), displayed with a 12-bit precision on a color monitor (640 × 480 pixels, 120 Hz), and focused on photoreceptors. The mean background intensity was ∼20,000 photons · μm– r2 · s–1 (equivalent to ∼8000 R* · cone–1 · s–1, where R* is photoisomerized rhodopsin) at 535 nm, well into the photopic range. The stimulus was typically a 100 ms square-wave spot repeating at 1, 2, or 4 Hz. For some cells, the stimulus was a 50% duty cycle at 2 Hz. The noise content of the stimulus, measured with a photodiode, was <0.06% contrast in the range of 2–70 Hz. Poisson photon fluctuation was also not a concern because it is known to be negligible at photopic backgrounds (Schellart and Spekreijse, 1973; Freed, 2000a). This implies that noise in the stimulus did not affect our measurements of performance (0.5% or higher contrast, with time bins of 40 ms; see below).
Drug application. All drugs were obtained from Sigma (St. Louis, MO). Na+ channels were blocked either from outside with bath application of 100 nm tetrodotoxin (TTX) or from inside by filling the recording electrode with 5 mm lidocaine N-ethyl bromide (QX-314). In some cells (see Results), glycinergic and GABAergic inputs to the ganglion cell were blocked with bath application of 0.5 μm strychnine (STR) and 100 μm picrotoxin (PTX). Bath agents were dissolved in Ames medium, and the solutions were kept in separate reservoirs connected by valves to the chamber and were applied by manually switching appropriate valves.
Signal, noise, and contrast–response function. For measuring the SNR (see Figs. 1, 2, 3, 4), the signal was defined as the mean response in a 10 ms bin, averaged over all the trials:
 |
(1) |
where rij is the absolute value of the stimulus-evoked response in the ith trial, jth bin, and m and n are the numbers of trials and bins per trial, respectively. The noise was defined as follows:
 |
(2) |
where σj is the SD of the response in the jth bin across all trials. This definition included both the background and the stimulus-evoked noise.
Figure 1.

QX-314 reduced the SNR in the ganglion cell response at all contrasts. A, Light response of a representative cell (left) was diminished when Na+ channels were blocked intracellularly with QX-314 (middle). Addition of TTX in the superfusate did not further affect the response amplitude (right). B, Both signal (left) and noise (right) (mean ± SE) in the ganglion cell response declined consistently with QX-314 at all contrasts, but signal declined more than noise. Curve fits were generated with a modified Naka–Rushton function (Eq. 3). C, Because of a larger decline in signal, QX-314 reduced the SNR at all contrasts.
Figure 2.
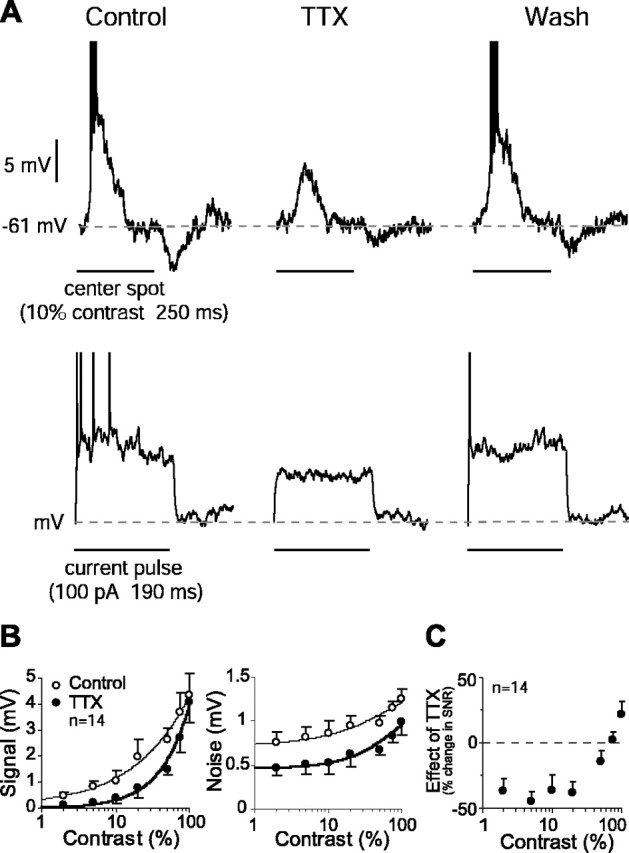
TTX reduced the SNR in the graded potential response of the ganglion cell. A, Top plot, Graded potential and spike response of an OFF ganglion cell to a dark center spot (left). Bath application of TTX abolished spiking completely and reduced the graded potential response and the associated noise (middle). The effect was reversed with removal of TTX (right). Bottom plot, Graded potential response to a pulse of depolarizing current also declined reversibly with application of TTX. B, TTX reduced the signal (mean ± SE) over all contrasts but enhanced linearity with little or no saturation at high contrasts (left). Mean noise ± SE also declined with TTX (right). Curve fits were generated with a modified Naka–Rushton function (Eq. 3). C, The mean SNR in graded potential response declined with TTX application at low contrasts. This is attributable to a bigger reduction in signal than in noise (see Results). At contrasts above ∼50%, however, the signal did not decline as much, and the SNR increased slightly.
Figure 3.
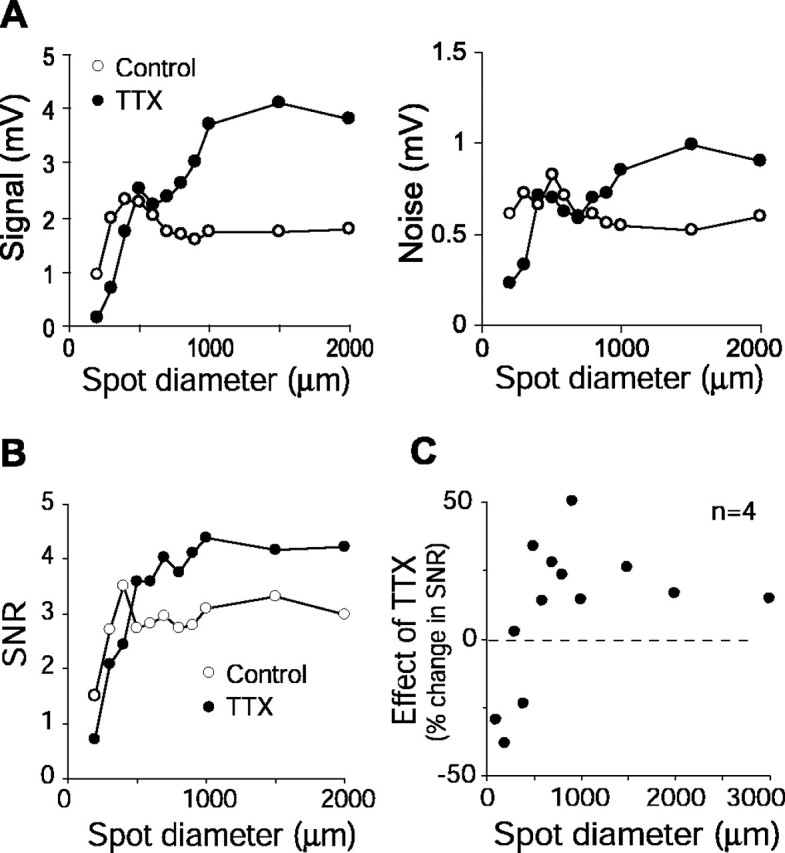
TTX reduced the SNR in the graded potential response for a small center spot but increased the SNR for a larger spot that covered the surround. A, Effect of TTX on signal (left) and noise (right) as a function of spot diameter for a representative cell. For a small spot (≤400 μm diameter, 50% contrast), TTX resulted in lower signal and lower noise, but as the spot enlarged, TTX produced higher signal and higher noise. The effects on signal were more pronounced than on noise. B, Effect of TTX on the SNR (same cell as shown in A). Because of the bigger effect of TTX on signal than on noise, the SNR declined with TTX for small spots but increased for larger spots. C, Data from four cells showing that TTX reduced the mean SNR for small spots but increased SNR for larger spots. Spot contrast, 50% (n = 2), 100% (n = 2). Error bars have been removed for clarity.
Figure 4.
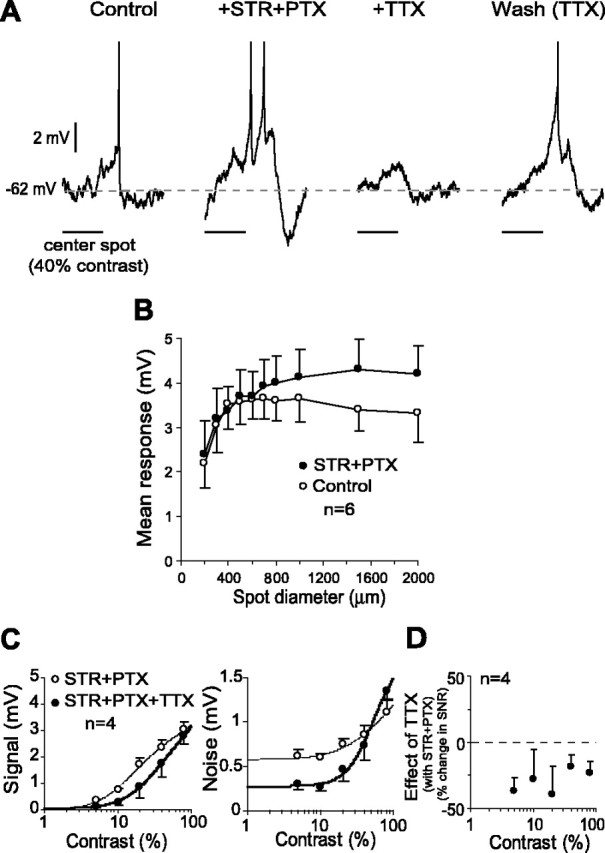
TTX reduced the SNR in both the center and surround response. A, Graded potential and spike responses of a representative cell increased with bath application of STR and PTX. Addition of TTX to the bath reversibly abolished the spike response and reduced the graded potential response. B, The diameter–response function of ganglion cell graded potential responses showed a weak but consistent surround inhibition (open circles). Addition of STR and PTX removed this inhibition (filled circles). C, With surround inhibition blocked, TTX reduced both signal (left graph) and noise (right graph). The mean reduction in signal was slightly more pronounced (28%) than in noise (21%). Curve fits were generated with a modified Naka–Rushton function (Eq. 3). D, As a result of the larger reduction in the signal, TTX reduced SNR in the graded potential response over the entire range of contrasts.
The contrast–response function of a cell was measured as the evoked response (signal) versus stimulus contrast. It was fitted with a modified Naka–Rushton equation (see Figs. 1 B, 2 B, 4C) (Naka and Rushton, 1966; Dhingra and Smith, 2004):
 |
(3) |
where R(C) is the response of the cell at contrast C, Rmax is maximum response, k is the half-saturation constant, and p and q are parameters that determine the shape of the function at high and low contrasts, respectively.
Measurement of quantal amplitude. We calculated from the response of the cell the amplitude of a single quantum in the ganglion cell input using fluctuation analysis (Freed, 2000a,b). Because the quantal arrival times are thought to have Poisson statistics and the quantal voltage has a simple exponential decay, the peak quantal amplitude a was estimated (Katz and Miledi, 1972; Freed, 2000a) as follows:
 |
(4) |
where σ2 is stimulus-evoked variance and v is the evoked voltage response in a very small (0.2 ms) bin, averaged over all the bins and 20–40 trials. The value of a was corrected for the dispersion in the quantal size by dividing it by 1.25 (Freed, 2000a).
Ideal observer analysis. The ideal observer analysis was similar in detail to that of our previous study (Dhingra and Smith, 2004). Briefly, to measure the threshold of a ganglion cell for contrast detection, we constructed an ideal observer using a template filter followed by a maximum likelihood discriminator. Based on the temporal pattern of the responses, the ideal observer discriminated between responses to a pair of contrasts in a single-interval, two-alternative, forced-choice paradigm (Geisler et al., 1991; Dhingra and Smith, 2004).
We recorded ganglion cell responses to 200–400 repetitions each of up to 30 contrast values. Because contrast adaptation is complex with several time constants, we tested different stimulus protocols in an attempt to mitigate adaptation effects. We settled on presentation of different contrasts in a random sequence in blocks of 20 trials, presenting 3–5 s of the mean background between blocks and discarding the first trial in each block. To determine whether the responses to a pair of contrasts were discriminable, we filtered the individual responses using an optimal template (40 ms time bins) and compared them using the maximum likelihood rule (Duda and Hart, 1973). The template was computed from a randomly selected half of the responses and was constructed using a modification of Fisher's Linear Discriminant Analysis (Duda and Hart, 1973; Dhingra and Smith, 2004). This is a template method that projects multidimensional data into one dimension to maximize the difference between the two projected response means and minimize the variances, without assuming that responses in neighboring bins are independent. The difference between the two averages, representing between-class scatter, was divided by the covariance matrix of the binned responses, representing within-class scatter, to generate the optimal template vector, defined as follows:
 |
(5) |
where m is the mean response vector when the stimulus is A or B, n is total number of responses, (Ri–m) is deviation of the ith response vector from the mean, and (Ri–m)t is transposed (Ri–m). Each response was multiplied bin for bin by the template vector, and the product was summed across all of the bins to give an optimally filtered value (arbitrary units) unique for each response, denoted the Fisher value (F).
The Fisher values of the responses that generated the template were used to construct for each contrast a probability density function (PDF). A pair of such PDFs represented the ideal observer for a given pair of contrasts (Dhingra and Smith, 2004). The ideal observer was then presented the remaining half of the responses (each with its unique Fisher value) and asked to choose for each response which of the two contrasts had most likely been presented. The choice was governed by the likelihood ratio (Green and Swets, 1974):
 |
(6) |
where F is the Fisher value when the stimulus is B or A. For L > k, the ideal observer chose B; for L < k, it chose A, where k is the criterion. Because the stimuli had equal presentation probability, setting k = 1 minimized the total error rate (Green and Swets, 1974). When the choice corresponded to the stimulus actually presented, it was “correct.” A neurometric function was defined as the fraction of correct responses plotted against the difference between the two contrasts and fitted with a cumulative Weibull function (Dhingra and Smith, 2004). Threshold was defined as the contrast that gave 68% correct choices.
Results
The brisk transient ganglion cells reported here included mostly OFF-center (n = 28) and some ON-center (n = 5) types. The cells had monostratified, radiating dendrites (400–700 μm diameter), an input resistance at rest of 20–70 MΩ, and a resting membrane potential of –59 ± 5 mV (mean ± SD). The maintained spike rate was 6.0 ± 1 Hz for OFF cells and 21.4 ± 11.1 Hz for ON cells, as reported previously (Troy and Robson, 1992; Zaghloul et al., 2003; Dhingra and Smith, 2004). The response to a stimulus typically peaked at 100 ms (range, 70–150 ms) after the stimulus onset (see Fig. 2A, top plot). Blocking Na+ channels with QX-314 or TTX did not cause any significant change in the resting membrane potential (McMahon et al., 2004).
QX-314 reduced the SNR at all contrasts
In a subset of ganglion cells (n = 7), we blocked the Na+ channels intracellularly by including QX-314 in the recording electrode. The spike response of the cell recorded within 2 min of penetration had little or no change, suggesting that Na+ channels were active and that QX-314 in the concentration used here (5 mm) did not diffuse from the sharp electrode immediately and spontaneously into the cell. Therefore, these initial measurements were taken as a “control.” Current pulses were applied after these 2 min to deliver the drug. Although QX-314 apparently did not block all of the Na+ channels, these recordings suggested that a large fraction of them were blocked because the drug-treated cells did not produce any spike to the stimulus at up to 80% contrast.
QX-314 reduced both the signal (41% mean reduction, averaged across contrasts; p < 0.01; df = 6; paired t test) and the noise (23% mean reduction; p < 0.05) (Fig. 1A,B), which resulted in a lower SNR over all contrasts (24% mean reduction; p < 0.05) (Fig. 1C). In some cells (n = 4), after recording the effect of QX-314, we added 100 nm TTX to the superfusate but did not find any significant effect of TTX (Fig. 1A).
TTX reduced the SNR in the center response
Bath application of TTX completely blocked the spike response of the cell typically in <1 min and reduced the amplitude of its graded potential response to a center spot stimulus as well as to a current pulse injected directly into the soma (Fig. 2A). That TTX reduced the response to both current pulse and light implied that much of the effect of TTX on the light response was attributable to Na+ channels intrinsic to the ganglion cell. TTX also reduced the noise in the graded potential response (Fig. 2A). The reduction in the response and the noise recovered when the drug was removed. The effect of TTX as well as the recovery developed slowly, requiring up to 30 min to reach plateau (data not shown).
We quantified the effect of TTX on the ganglion cell signal and noise amplitudes (Eqs. 1, 2). Application of TTX resulted in lower amplitude of both the signal (35% mean reduction; p < 0.05, except at 100% contrast; df = 4–9; paired t test) and the noise (31% mean reduction; p < 0.05) (Fig. 2B), resulting in a lower SNR (15% mean reduction). However, the effect of TTX on the signal was more pronounced at lower contrasts. As a result, the TTX-induced change in the SNR showed a specific pattern: at low contrasts (≤50%), the SNR decreased by as much as 45% (p < 0.05), but at higher contrasts, it increased by up to 22% (p > 0.05) (Fig. 2C). This differential effect of TTX on the SNR suggested that higher contrasts (50–100%) stimulated an expansive nonlinearity in the circuit responsible for the receptive field surround. Therefore, we hypothesized that, at high contrasts, stimulation of spiking amacrine cells reduces the SNR in the ganglion cell, and by blocking Na+ channels in these amacrine cells, TTX increases the SNR.
TTX increased the SNR in the surround response
We tested the above hypothesis by stimulating the receptive field surround with a spot of increasing diameter (Fig. 3). We found that for small spots (up to 400–500 μm), TTX reduced signal and noise (Fig. 3A), but as the spot enlarged and covered the surround, TTX increased signal and noise. The effect of TTX on the signal was more pronounced than on the noise, which was reflected in our computation of the SNR: for smaller spots, the SNR declined by as much as ∼40% with TTX, but for larger spots, SNR increased by up to 50% (Fig. 3B,C). The increase in SNR for larger spots was more pronounced in OFF-center cells than in ON-center cells, likely because at the background light intensity used here, the surround inhibition in OFF-center cells was more evident (data not shown). These results suggested that stimulation of the receptive field surround of the ganglion cell reduces the SNR by subtracting from the signal and/or adding noise, and TTX increases the SNR by blocking signal transmission in this surround circuit.
TTX reduced the SNR at all contrasts in the presence of strychnine and picrotoxin
To isolate the role of Na+ channels intrinsic to the ganglion cell and to exclude those in the long-range amacrine cells, we pharmacologically blocked the glycinergic and GABAergic amacrine inputs. As expected, simultaneous application of STR and PTX increased the response of the cell to a spot (Fig. 4A), suggesting that these drugs abolished or at least weakened the lateral inhibition from the long-range amacrine cells. Additional evidence that these drugs blocked the surround came from the response of the cell to a spot of increasing diameter. When the spot diameter was enlarged to 400 μm, the mean response increased rapidly, but enlarging it further to 2 mm resulted in a gradual decline of the response (Fig. 4B, open circles), consistent with the inhibition from surround. For the background light intensity used here, the surround inhibition in the brisk transient cells was relatively weak. Application of STR and PTX abolished this inhibition (Fig. 4B, filled circles). In the presence of STR and PTX, application of TTX resulted in lower mean amplitudes of the signal (28% mean reduction) and the noise (21% mean reduction) (Fig. 4C). As a consequence of the larger reduction in the signal, the SNR declined with TTX on average by 25% (p < 0.05; df = 3; paired t test) at all contrasts tested (Fig. 4C). This is similar in pattern and magnitude to the decline in the SNR with QX-314 (24% mean reduction; see above) (Fig. 1C). These results further confirmed that the Na+ channels intrinsic to ganglion cell increase the SNR.
TTX reduced quantal amplitude
We estimated from the light-evoked signal and noise values the amplitude of quanta impinging on the ganglion cell membrane as sampled by the electrode at the soma (Eq. 4). The quantal amplitude values found here were larger than noted previously (Freed, 2000a), likely because we calculated these values from the transient response. Application of TTX resulted in a quantal amplitude that was 40% lower (p < 0.05; df = 6; paired t test) (Fig. 5A). For a spot presented in the receptive field center, we assumed that the measurement represented quanta predominantly from bipolar cell inputs. To confirm this, we blocked inhibitory inputs with STR and PTX and found that the quantal amplitude did not change significantly, but a further addition of TTX reduced the amplitude by 35% (Fig. 5B). Finally, in cells in which Na+ channels were blocked internally with QX-314, the quantal amplitude declined by 32% (p < 0.05; df = 2).
Figure 5.

Blocking Na+ channels in the ganglion cell reduced quantal amplitude. A, Quantal amplitude (mean ± SE) calculated from signal and noise in the ganglion cell response (50% contrast) declined significantly with TTX. B, TTX reduced quantal amplitude even when inhibitory amacrine inputs were blocked with STR and PTX. C, Blocking Na+ channels intracellularly in the ganglion cell also reduced the quantal amplitude.
Na+ channels improve contrast thresholds
The finding that blocking Na+ channels in a ganglion cell reduced the SNR in its graded potential response suggested that active Na+ channels improve contrast sensitivity. To investigate this directly, we measured contrast detection thresholds using ideal observer analysis before and after blocking the Na+ channels. We found that blocking Na+ channels with TTX raised the contrast detection threshold from 1.2 ± 0.4% (SD) to 2.0 ± 0.8% (p < 0.05; df = 2; paired t test) (Fig. 6A). Similarly, when inhibitory inputs were blocked with STR and PTX, application of TTX increased the detection threshold from 1.6 to 2.4% (n = 1) (Fig. 6B). These results imply that Na+ channels in a ganglion cell improve its contrast sensitivity.
Figure 6.

Blocking Na+ channels in the ganglion cell raised the contrast detection thresholds. A, Contrast detection performance measured as percentage correct response (mean ± SD) by ideal observer analysis declined with TTX, thus raising the detection threshold. The dashed line represents a 68% correct criterion level for threshold. The detection task compared responses to zero contrast and the contrast shown. B, TTX reduced performance and increased the detection threshold even when inhibitory amacrine inputs were blocked.
Discussion
We measured the effect of blocking voltage-gated Na+ channels in a retinal ganglion cell on its signal and noise properties and on its contrast sensitivity. We found that blocking Na+ channels in a brisk transient ganglion cell reduced the signal and, to a lesser degree, the noise and therefore reduced the SNR, raising the contrast detection threshold. This implies that Na+ channels, which are known to amplify and contribute noise to the visual signal, also enhance the SNR and improve sensitivity. We found no significant difference between ON- and OFF-center cells in the effect of Na+ channel block on SNR.
Na+ channels in the ganglion cell amplify signal and noise
Our main finding that the increase in SNR is attributable to Na+ channels intrinsic to the ganglion cell is dependent on several observations: (1) the light response and the associated noise declined at all contrasts with QX-314 (Fig. 1) or with TTX (in the presence of STR and PTX) (Fig. 4); (2) the magnitude of reduction in the SNR when Na+ channels were blocked with QX-314 or with TTX (in the presence of STR and PTX) was similar; (3) these effects were similar to the reduction in amplitude in response to intracellularly injected current (Figs. 1, 2); and (4) there was no additional effect of TTX during block by QX-314.
In the experiment in which we added TTX to the superfusate while Na+ channels in the ganglion cell were blocked with intracellular QX-314 (Fig. 1) (see Results), we note that although there was no statistically significant effect of TTX, the SNR declined slightly at low contrasts and increased slightly at high contrasts, a pattern also observed without intracellular QX-314 (Fig. 2). This raised the possibility that a part of the TTX effect shown in Figure 2 might originate in block of Na+ channels that reside in the presynaptic neurons, e.g., bipolar cells (Ichinose et al., 2005). However, signal amplification by Na+ channels has been shown only in a subset of bipolar cells: transient ON-type (Ichinose et al., 2005), whereas most of the ganglion cells reported here are OFF-type. We conclude that Na+ channels within the ganglion cell amplify its light response by up to 50% and also amplify the associated noise but to a lesser degree, thus increasing the SNR.
Contrast modulates the effect of TTX
At high contrasts (>50%), TTX increased the SNR, which suggested additional mechanisms specific to these contrasts. One possibility is contrast adaptation, because high contrasts induce more inactivation of Na+ channels, reducing the number of Na+ channels available (Fleidervish et al., 1996; Kim and Rieke, 2003) for signal amplification. Then blocking with TTX would reduce the signal less at high contrasts, resulting in higher SNR. However, the experimental paradigm used here was designed to minimize the effect of one contrast on the response to the next by presenting different contrasts in a random sequence separated by 3–5 s of the stimulus-off period and by discarding the first trial in the next block of trials (see Materials and Methods). A related possibility is that TTX, by blocking spiking activity in the dopaminergic amacrine cell and thus the release of dopamine (Steffen et al., 2003), might reduce specific adaptational effects of dopamine at high contrasts on Na+ channels (Hayashida and Ishida, 2004), thereby enhancing responses. This possibility seems unlikely, because dopamine diffuses slowly throughout the retina and thus with a stimulus protocol designed to reduce adaptational effects would persist for all contrasts.
Alternatively, the increased SNR with TTX at high contrasts might be related to surround stimulation. The stimulation of long-range amacrine cells may reduce the SNR in the ganglion cell via lateral inhibition, and TTX, by removing this inhibition (Cook et al., 1998; Taylor, 1999; Flores-Herr et al., 2001; Shields and Lukasiewicz, 2002; McMahon et al., 2004), may increase the SNR. We tested this hypothesis by explicitly stimulating the surround with large spots and found it to be consistent with our results (Figs. 4, 5). Blocking inhibitory amacrine inputs with STR and PTX increased the SNR, indicating that, in our preparation, amacrine inputs under normal conditions reduce the SNR to high-contrast spots. Furthermore, this block of surround inhibition abolished the paradoxical effect of TTX on the SNR at high contrasts (Figs. 2C,4C), indicating that this effect originates from Na+ channels in amacrine cells.
Mechanisms for Na+ channels to improve contrast sensitivity
The finding that TTX reduced the estimate of quantal amplitude (Fig. 5) is consistent with the known regenerative action of Na+ channels in the spike generator. However, an enhanced quantal amplitude alone does not explain the increased SNR because, assuming the noise originates only in the timing of stochastic quantal release, the SNR would be unaffected by quantal amplitude (Katz and Miledi, 1972; Freed, 2000a). One possibility is that processing by Na+ channels in ganglion cell dendrites interacts nonlinearly with postsynaptic currents (Juusola and French, 1997); e.g., activated Na+ channels depolarize ganglion cell dendrites to unblock NMDA receptors, increasing the effective number of quanta that carry the synaptic signal (Diamond and Copenhagen, 1993).
Another possibility is that the ganglion cell contains a source of noise unaffected by regenerative amplification from Na+ channels so that its noise contribution remains when TTX blocks amplification of the synaptic signal and noise. A noise source consistent with this hypothesis is stochastic gating of K+ channels, which are abundant in ganglion cells. It seems plausible, for example, that Na+ channels in remote dendritic compartments amplify synaptic signals more than in the soma because the dendritic membrane is depolarized (Schwindt and Crill, 1995). During normal synaptic processing, this mechanism would enhance propagation of subthreshold dendritic signals to the soma (Taylor et al., 1995), but during block by TTX, electrotonic decay and noise from somatic K+ channels would reduce the SNR. Although hypothesizing a second noise source invalidates the assumptions behind the estimate of quantal amplitude, this alternative is attractive because K+ channels are known to generate significant noise compared with Na+ channels and synaptic PSPs (van Rossum et al., 2003).
Implications for visual processing
Sodium channels in the ganglion cell produce several interrelated effects on signal and noise that contribute to processing of visual signals. The ganglion cell is dependent on Na+ channels for generation of action potentials (Fohlmeister and Miller, 1997a,b), but these channels are known to amplify the generator potential in the subthreshold voltage range before each spike (Hodgkin and Huxley, 1952; Vallet et al., 1992), and this amplification can have a transient component (Koch, 1984). Stochastic gating of Na+ and K+ channels in the ganglion cell adds noise to the generator potential and increases variability of the spike train, reducing the information available (Schneidman et al., 1998; van Rossum et al., 2003; Dhingra and Smith, 2004). In addition, however, our present results imply that Na+ channels can selectively amplify the synaptic input signal. Besides their obvious spike-generating function, therefore, Na+ channels appear to enhance the information capacity of the ganglion cell closer to the limit imposed by its synaptic input.
Footnotes
This work was supported by National Institutes of Health Grants MH48168 (R.G.S.) and EY13333 (M.A.F.). We thank W. R. Taylor for comments on this manuscript.
Correspondence should be addressed to Narender K. Dhingra, National Brain Research Center, Nainwal Mode, NH-8, Manesar (Gurgaon), Haryana 122050, India. E-mail: naren@nbrc.ac.in.
DOI:10.1523/JNEUROSCI.1962-05.2005
Copyright © 2005 Society for Neuroscience 0270-6474/05/258097-07$15.00/0
References
- Boiko T, Wart AV, Caldwell JH, Levinson SR, Trimmer JS, Matthews G (2003) Functional specialization of the axon initial segment by isoform-specific sodium channel targeting. J Neurosci 23: 2306–2313. [DOI] [PMC free article] [PubMed] [Google Scholar]
- Cook PB, Lukasiewicz PD, McReynolds JS (1998) Action potentials are required for the lateral transmission of glycinergic transient inhibition in the amphibian retina. J Neurosci 18: 2301–2308. [DOI] [PMC free article] [PubMed] [Google Scholar]
- Dhingra NK, Smith RG (2004) Spike generator limits efficiency of information transfer in a retinal ganglion cell. J Neurosci 24: 2914–2922. [DOI] [PMC free article] [PubMed] [Google Scholar]
- Dhingra NK, Kao YH, Sterling P, Smith RG (2003) Contrast threshold of a brisk-transient ganglion cell in vitro. J Neurophysiol 89: 2360–2369. [DOI] [PubMed] [Google Scholar]
- Diamond JS, Copenhagen DR (1993) The contribution of NMDA and non-NMDA receptors to the light-evoked input-output characteristics of retinal ganglion cells. Neuron 11: 725–738. [DOI] [PubMed] [Google Scholar]
- Duda RO, Hart PE (1973) Pattern classification and scene analysis. New York: Wiley.
- Fleidervish IA, Friedman A, Gutnick MJ (1996) Slow inactivation of Na+ current and slow cumulative spike adaptation in mouse and guinea-pig neocortical neurones in slices. J Physiol (Lond) 493: 83–97. [DOI] [PMC free article] [PubMed] [Google Scholar]
- Flores-Herr N, Protti DA, Wassle H (2001) Synaptic currents generating the inhibitory surround of ganglion cells in the mammalian retina. J Neurosci 21: 4852–4863. [DOI] [PMC free article] [PubMed] [Google Scholar]
- Fohlmeister JF, Miller RF (1997a) The impulse encoding mechanisms of ganglion cells in the tiger salamander retina. J Neurophysiol 78: 1935–1947. [DOI] [PubMed] [Google Scholar]
- Fohlmeister JF, Miller RF (1997b) Mechanisms by which cell geometry controls repetitive impulse firing in retinal ganglion cells. J Neurophysiol 78: 1948–1964. [DOI] [PubMed] [Google Scholar]
- Freed MA (2000a) Rate of quantal excitation to a retinal ganglion cell evoked by sensory input. J Neurophysiol 83: 2956–2966. [DOI] [PubMed] [Google Scholar]
- Freed MA (2000b) Parallel cone bipolar pathways to a ganglion cell use different rates and amplitudes of quantal excitation. J Neurosci 20: 3956–3963. [DOI] [PMC free article] [PubMed] [Google Scholar]
- Geisler WS, Albrecht DG, Salvi RJ, Saunders SS (1991) Discrimination performance of single neurons: rate and temporal-pattern information. J Neurophysiol 66: 334–362. [DOI] [PubMed] [Google Scholar]
- Green DM, Swets JA (1974) Signal detection theory and psychophysics. New York: Wiley.
- Hayashida Y, Ishida AT (2004) Dopamine receptor activation can reduce voltage-gated Na+ current by modulating both entry and recovery from inactivation. J Neurophysiol 92: 3134–3141. [DOI] [PMC free article] [PubMed] [Google Scholar]
- Hodgkin AL, Huxley AF (1952) A quantitative description of membrane current and its application to conduction and excitation in nerve. J Physiol (Lond) 117: 500–544. [DOI] [PMC free article] [PubMed] [Google Scholar]
- Ichinose T, Shields CR, Lukasiewicz PD (2005) Sodium channels in transient retinal bipolar cells enhance visual responses in ganglion cells. J Neurosci 25: 1856–1865. [DOI] [PMC free article] [PubMed] [Google Scholar]
- Juusola M, French AS (1997) The efficiency of sensory information coding by mechanoreceptor neurons. Neuron 18: 959–968. [DOI] [PubMed] [Google Scholar]
- Juusola M, Niven JE, French AS (2003) Shaker K+ channels contribute early nonlinear amplification to the light response in Drosophila photoreceptors. J Neurophysiol 90: 2014–2021. [DOI] [PubMed] [Google Scholar]
- Katz B, Miledi R (1972) The statistical nature of the acetylcholine potential and its molecular components. J Physiol (Lond) 224: 665–699. [DOI] [PMC free article] [PubMed] [Google Scholar]
- Kim KJ, Rieke F (2003) Slow Na+ inactivation and variance adaptation in salamander retinal ganglion cells. J Neurosci 23: 1506–1516. [DOI] [PMC free article] [PubMed] [Google Scholar]
- Koch C (1984) Cable theory in neurons with active, linearized membranes. Biol Cybern 50: 15–33. [DOI] [PubMed] [Google Scholar]
- McMahon MJ, Packer OS, Dacey DM (2004) The classical receptive field surround of primate parasol ganglion cells is mediated primarily by a non-GABAergic pathway. J Neurosci 24: 3736–3745. [DOI] [PMC free article] [PubMed] [Google Scholar]
- Naka KI, Rushton WA (1966) S-potentials from colour units in the retina of fish (Cyprinidae). J Physiol (Lond) 185: 536–555. [DOI] [PMC free article] [PubMed] [Google Scholar]
- Niven JE, Vahasoyrinki M, Kauranen M, Hardie RC, Juusola M, Weckstrom M (2003) The contribution of shaker K+ channels to the information capacity of Drosophila photoreceptors. Nature 421: 630–634. [DOI] [PubMed] [Google Scholar]
- Schellart NA, Spekreijse H (1973) Origin of the stochastic nature of ganglion cell activity in isolated goldfish retina. Vision Res 13: 337–345. [DOI] [PubMed] [Google Scholar]
- Schneidman E, Freedman B, Segev I (1998) Ion channel stochasticity may be critical in determining the reliability and precision of spike timing. Neural Comput 10: 1679–1703. [DOI] [PubMed] [Google Scholar]
- Schwindt PC, Crill WE (1995) Amplification of synaptic current by persistent sodium conductance in the apical dendrite of neocortical neurons. J Neurophysiol 74: 2220–2224. [DOI] [PubMed] [Google Scholar]
- Sheasby BW, Fohlmeister JF (1999) Impulse encoding across the dendritic morphologies of retinal ganglion cells. J Neurophysiol 81: 1685–1698. [DOI] [PubMed] [Google Scholar]
- Shields CR, Lukasiewicz PD (2002) Spike-dependent GABA inputs to bipolar cell axon terminals contribute to lateral inhibition of retinal ganglion cells. J Neurophysiol 89: 2449–2458. [DOI] [PubMed] [Google Scholar]
- Steffen MA, Seay CA, Amini B, Cai Y, Feigenspan A, Baxter DA, Marshak DW (2003) Spontaneous activity of dopaminergic retinal neurons. Biophys J 85: 2158–2169. [DOI] [PMC free article] [PubMed] [Google Scholar]
- Stuart G, Sakmann B (1995) Amplification of EPSPs by axosomatic sodium channels in neocortical pyramidal neurons. Neuron 15: 1065–1076. [DOI] [PubMed] [Google Scholar]
- Taylor GC, Coles JA, Eilbeck JC (1995) Conditions under which Na+ channels can boost conduction of small graded potentials. J Theor Biol 172: 379–386. [DOI] [PubMed] [Google Scholar]
- Taylor WR (1999) TTX attenuates surround inhibition in rabbit retinal ganglion cells. Vis Neurosci 16: 285–290. [DOI] [PubMed] [Google Scholar]
- Troy JB, Robson JG (1992) Steady discharges of X and Y retinal ganglion cells of cat under photopic illuminance. Vis Neurosci 9: 535–553. [DOI] [PubMed] [Google Scholar]
- Vallet AM, Coles JA, Eilbeck JC, Scott AC (1992) Membrane conductances involved in amplification of small signals by sodium channels in photoreceptors of drone honey bee. J Physiol (Lond) 456: 303–324. [DOI] [PMC free article] [PubMed] [Google Scholar]
- van Rossum MCW, O'Brien BJ, Smith RG (2003) Effects of noise on the spike timing precision of retinal ganglion cells. J Neurophysiol 89: 2406–2419. [DOI] [PubMed] [Google Scholar]
- Velte TJ, Masland RH (1999) Action potentials in the dendrites of retinal ganglion cells. J Neurophysiol 81: 1412–1417. [DOI] [PubMed] [Google Scholar]
- White JA, Rubinstein JT, Kay AR (2000) Channel noise in neurons. Trends Neurosci 23: 131–137. [DOI] [PubMed] [Google Scholar]
- Wollner DA, Catterall WA (1986) Localization of sodium channels in axon hillocks and initial segments of retinal ganglion cells. Proc Natl Acad Sci USA 83: 8424–8428. [DOI] [PMC free article] [PubMed] [Google Scholar]
- Xu Y, Dhingra NK, Smith RG, Sterling P (2005) Sluggish and brisk ganglion cells detect contrast with similar sensitivity. J Neurophysiol 93: 2388–2395. [DOI] [PMC free article] [PubMed] [Google Scholar]
- Zaghloul KA, Boahen K, Demb JB (2003) Different circuits for ON and OFF retinal ganglion cells cause different contrast sensitivities. J Neurosci 23: 2645–2654. [DOI] [PMC free article] [PubMed] [Google Scholar]